Abstract
Fluorescence correlation spectroscopy (FCS) was developed in 1972 by Magde, Elson and Webb (Magde et al., 1972). Photon counting detectors and avalanche photodiodes have become standards in FCS to the point that there is a widespread belief that these detectors are essential to perform FCS experiments, despite the fact that FCS was developed using analog detectors. Spatial and temporal intensity fluctuation correlations using analog detection on a commercial Olympus Fluoview 300 microscope has been reported by Brown et al. (2008). However, each analog instrument has its own idiosyncrasies that need to be understood before using the instrument for FCS. In this work we explore the capabilities of the Nikon C1, a low cost confocal microscope, to obtain single point FCS, Raster-scan Image Correlation Spectroscopy (RICS) and Number & Brightness data both in solution and incorporated into the membrane of Giant Unilamellar Vesicles (GUVs). We show that it is possible to obtain dynamic information about fluorescent molecules from single point FCS, RICS and Number & Brightness using the Nikon C1. We highlighted the fact that care should be taken in selecting the acquisition parameters in order to avoid possible artifacts due to the detector noise. However, due to relatively large errors in determining the distribution of digital levels for a given microscope setting, the system is probably only adequate for determining relative brightness within the same image.
Keywords: FCS, N&B, RICS, Giant unilamellar vesicle
INTRODUCTION
Fluorescence correlation spectroscopy (FCS) was developed in 1972 by Magde, Elson and Webb (Magde et al., 1972). FCS is a technique that measures the spontaneous concentration fluctuation in a sample. The time dependence of these spontaneous fluctuations and the number of molecules in the illumination volume can be obtained from the autocorrelation function of the fluorescent signal. FCS instruments traditionally rely on photon counting detectors, where the pulse originating from a photon is detected, discriminated and the number of photons arriving within a given time period are counted. Photon counting detectors and avalanche photodiodes have become standards in FCS to the point that there is a widespread belief that these detectors are essential to perform FCS experiments, despite the fact that FCS was developed using analog detectors. Several factors have limited the use of laser scanning microscope to obtain single point FCS data: One is the necessity to fix the laser at a defined point in the image (or sample) which is a not always possible. Another is the possible presence of jitters in the mirrors when the scanning mirrors are fixed at a point and finally, that most laser scanning microscopes are equipped with analog detectors. These detectors have been largely avoided because the integration circuit used before the digital sampling of the current can introduce unwanted correlations (Brown et al., 2008). Spatial and temporal intensity fluctuation correlations using analog detection on a commercial Olympus Fluoview 300 laser scanning microscope has been reported (Brown et al., 2008). These authors investigated instrument performance to obtain reliable Raster image correlation spectroscopy (RICS) data and recommended settings for these types of experiments. However, each analog instrument has its own idiosyncrasies that need to be understood before using the instrument for FCS. Gielen et al., (Gielen et al., 2009) showed that RICS can also be performed on a Zeiss LSM510 META laser scanning confocal system with one photon excitation and analog detection and that the analog detection exhibits a sufficiently large dynamic range to study the diffusion of both lipid analogs and membrane proteins. FCS data are usually obtained to determine the diffusion coefficient or to determine the number of molecules in the detection volume (i.e. the fluorophore concentration). An important analysis of FCS data is the photon-counting histogram (PCH) analysis first introduced by Chen (Chen et al., 1999). This method allows the determination of the aggregation state and clustering of the molecules under investigation and is capable of resolving multiple species in a homogeneous solution. However, this technique is based on photon counting which follows a Poisson distribution and is therefore not applicable to analog detectors. The number and Brightness analysis first proposed by Digman et al. (Digman et al., 2008) using photon counting detectors was extended to laser scanning microscopes operating in the analog mode (Dalal et al., 2008). Using an Olympus Fluoview 300LSCM built around an IX70 inverted microscope or an Olympus Fluoview 1000 LSCM built around an IX81 inverted microscope, these authors showed the validity of this approach and that the results were comparable with FCS fluctuation correlation spectroscopy. They also mentioned that the calculation of the brightness and number of particles can be applied to other commercial laser scanning confocal microscopes, provided that the variance of the signal is proportional to the intensity.
In the late 1990s, Enrico Gratton developed SimFCS software (Laboratory for Fluorescence Dynamics, UC at Irvine, CA). The software allows simulation and analysis of FCS data. It also allows acquisition of dynamic, spatial and quantitative information on commercial laser scanning confocal microscopes with analog detection through RICS (Brown et al., 2008) and Number & Brightness analysis (Dalal et al., 2008).
In this work we explore the capabilities of the Nikon C1, a low cost confocal microscope, to obtain single point FCS data both in solution and in Giant Unilamellar Vesicles (GUVs), as well as RICS and Number & Brightness data in GUVs. Using SimFCS software for the image analysis, we present results obtained for different fluorophores both in solution and incorporated into the membrane of GUVs. Important setup parameters such as detector gain, offset and noise are discussed.
MATERIALS AND METHODS
Rhodamine B for microscopy was purchase from Merck (Darmstadt, Germany), 1,1'-dioctadecyl-3,3,3',3'-tetramethylindocarbocyanine perchlorate (DiIC18) was purchased from Molecular Probes, (Invitrogen, Carlsbad, CA), Enhanced green fluorescent protein (EGFP) was purchased from BioVision (Mountain View, CA) 1,2-dioleoyl-sn-glycero-3-phosphoethanolamine-N-(biotinyl) (18:1 Biotinyl-PE) and 1-palmitoyl 2-oleoyl-phosphatidylcholine (POPC) were purchased from Avanti Lipids (Alabaster, AL). The C16 GloPIPs BODIPY TMR Phosphatidylinositol(4,5) bisphosphate (BODIPY TMR PI(4,5)P2) was purchased from Echelon Biosciences Inc. (Salt Lake City, UT). Biotinamidocaproyl labeled bovine Albumin and Avidin were purchased from Sigma-Aldrich (St Louis, MO).
Preparation of Giant Unilamellar Vesicles (GUVs)
GUVs were prepared by the electroformation method first described by Angelova (Angelova et al., 1992), using the GUV chamber described in Fidorra (Fidorra et al., 2006). POPC and Biotinyl-PE stocks were prepared in CHCl3:MeOH mix 2:1 (v/v). GUVs were made of POPC with 0.1% mole fraction of labeled lipids (DiIC18 in MeOH or BODIPY TMR PI(4,5)P2 in CHCl3:MeOH mixture) and one Biotinyl-PE molecule per 107 lipids. The GUVs were grown as previously described (Moens and Bagatolli, 2007). 3 µl of a 0.2 mg/ml lipid stock solution were dried on the chamber platinum electrodes and the residual solvent was removed under vacuum. The chamber temperature was set at 40°C. 300 µl of a 200 mM sucrose solution were added to each well of the chamber and the electric field was applied using a function generator. A signal of 1.5V at 10 Hz was applied for 90 minutes and then the frequency was reduced to 1 Hz for 15min in order to detach the GUVs from the platinum wires. The samples were collected and 50 µl of the solution containing the GUVs were added to 150 µl of 200 mM glucose solution in each of the microscopy chambers (Lab-Tek Brand Products, Naperville IL). For the GUVs, the chambers were pretreated by sequential incubation with biotinamidocaproyl labeled bovine albumin (1 mg/ml) for 10 min followed by avidin (1 mg/ml) for 10 min. The interaction of the Biotinyl-PE in the GUVs with the avidin results in the immobilization of the GUVs in the chamber. After attachment of the GUVs to the bottom of the chamber, 200 µl of sucrose solution was added to the chambers in order to reduce membrane fluctuations.
Confocal microscopy and analysis
All data were acquired on a commercial laser scanning confocal microscope (Nikon C1 with a Ti-E motorized inverted microscope) using a Plan Apochromat VC60x WI, 1.2 NA objective lens. The pinhole was set at 33 µm. A Coherent Sapphire 488-20 (488nm, 20mW) CW laser and a Coherent Compass 215M-20 (532nm, 20mW) CW Laser (Coherent, inc Santa Clara, CA) were used for the excitation of the fluorescent probes. The emission was collected through a Brightline 512/25 nm bandpass filter for EGFP and through a BrightLine 520 dichroic mirror (Semrock, Rochester, NY) followed by a 605/75 nm bandpass barrier filter for the Rhodamine B and DiIC18 dyes. The temperature was kept at 20 ± 1 °C. For single point FCS, the field zoom of the Nikon C1 was set to 0. The data were collected as an image of 2048 × 2048 pixels and 1 frame was recorded. The pixel dwell time was adjusted to 10.08 µs. In the standard detector tab, the Gain option Pixel Time Correction was unchecked as this automatically adjusts the photomultiplier tube (PMT) gain to compensate for fluctuations in image brightness.
Calibration of the point spread function (PSF) can be achieved by measuring the autocorrelation function G(t) of a fluorophore with a known diffusion coefficient (Gendron et al., 2008; Wawrezinieck et al., 2005). In our experiments, we used Rhodamine B in water with a diffusion coefficient (D) of 420 ± 30 µm2/s (Gendron et al., 2008). We made 3 measurements of the fluctuations of fluorescence intensity for 4 different concentrations of fluorophores ranging from 5 nM to 280 nM. The autocorrelation for the 12 data sets were computed and saved for global analysis. The files were then imported into Globals for Spectroscopy (Laboratory for Fluorescence Dynamics, UC Irvine, CA) and analyzed simultaneously using a fixed diffusion coefficient of 420 µm2/s. The average value of the radial waist obtained was 0.227 ± 0.011 µm (mean ± stdev).
The data files from the C1 were saved as ‘.ids’ files with each channel in separate files. The ‘ids’ file format is identical to the ‘bin’ format used in SimFCS. The files corresponding to the channel containing the data were therefore opened directly into SimFCS after replacing the ‘.ids’ extension with a ‘.bin’ extension. For single point FCS measurements, the data were detrended in SimFCS using a moving average filter of 30,000 points to eliminate any slow fluctuations due to possible photobleaching and/or slow fluctuations of the GUV membrane. After detrending, the data were correlated using the large vector correlation function followed by fitting the autocorrelation curve.
Number and Brightness analysis
For Number & Brightness analysis, the offset of the detectors, the detector readout noise (which is the noise of the detector in the absence of photons) and the distribution of digital levels per photons were determined. All these parameters can be resolved from a measurement of the detector background using the exact conditions of the experiment but with the laser turned off (Dalal et al., 2008). Background files were recorded with the laser turned off in order to correct for possible changes in offset or digital levels due to detector and electronics fluctuations. The images were acquired over 64 × 64 pixels, the pixel size was set at 49.4 nm, and the pixel dwell time was 13.29 µs. 100 frames were recorded for each file. GUVs were then imaged by positioning the PSF on top of the membrane. In the Number & Brightness section of SimFCS the region corresponding to the membrane of the GUV was selected and analyzed, giving the apparent brightness (B) and the average intensity (<k>). The true brightness (e) and number of molecule (n) is then calculated from the following equations (Dalal et al., 2008):
| (Eq 1) |
| (Eq 2) |
and,
| (Eq 3) |
where, N is the apparent number of molecule, <k> is the average intensity, the offset is a constant quantity characteristic of the detector settings, σ2 is the variance and is the readout variance of the detector.
Raster Image Correlation Spectroscopy (RICS)
For RICS, the offset was adjusted so that it was just below the threshold level and the images were acquired using the same parameters as described for the Number & Brightness analysis (above). The theory behind RICS has been previously described (Brown et al., 2008; Digman et al., 2005). The spatial autocorrelation function (G(ξ,ψ)) for 2D diffusion and one photon system is given by:
| (Eq 4) |
where ξ and ψ refer to the spatial displacement in x and y, γ is a geometric factor accounting for the non-uniform illumination in the detection volume and is equal to 0.5. N is the average number of molecules in the detection volume, ω0 is the radial waist of the detection volume, τp and τl are the pixel dwell time and the line time, respectively and D is the diffusion coefficient.
Absorbance measurements
The concentration of the Rhodamine B solutions in water was determined using a Shimadzu dual beam spectrophotometer. The measurements were made in a 1 cm pathlength cuvette using an extinction coefficient of ε = 111 M−1cm−1 (0.1%, 550 nm) (Lundgren and Binkley, 1954). The DiIC18 stock concentration was determined in MeOH using an extinction coefficient of ε = 148 M−1cm−1 (0.1%, 549 nm) (Invitrogen, Carlsbad, CA). EGFP concentration was determined using an extinction coefficient ε = 55 M−1cm−1 (0.1%, 488 nm) (Chalfie et al., 1994).
RESULTS
Detector noise
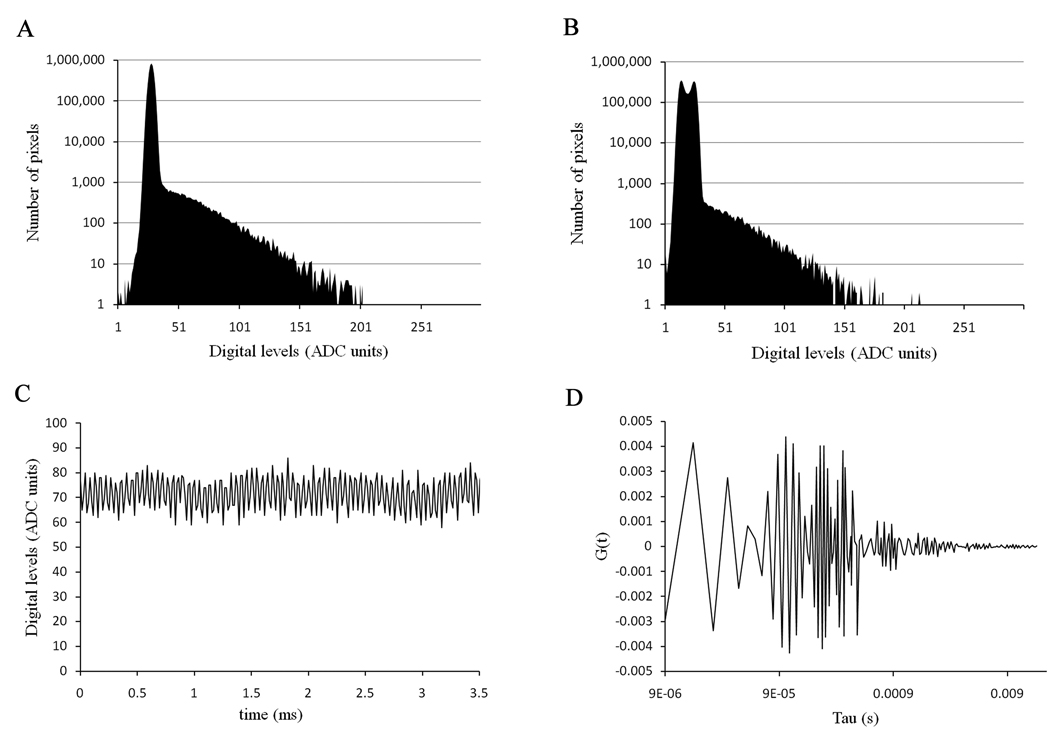
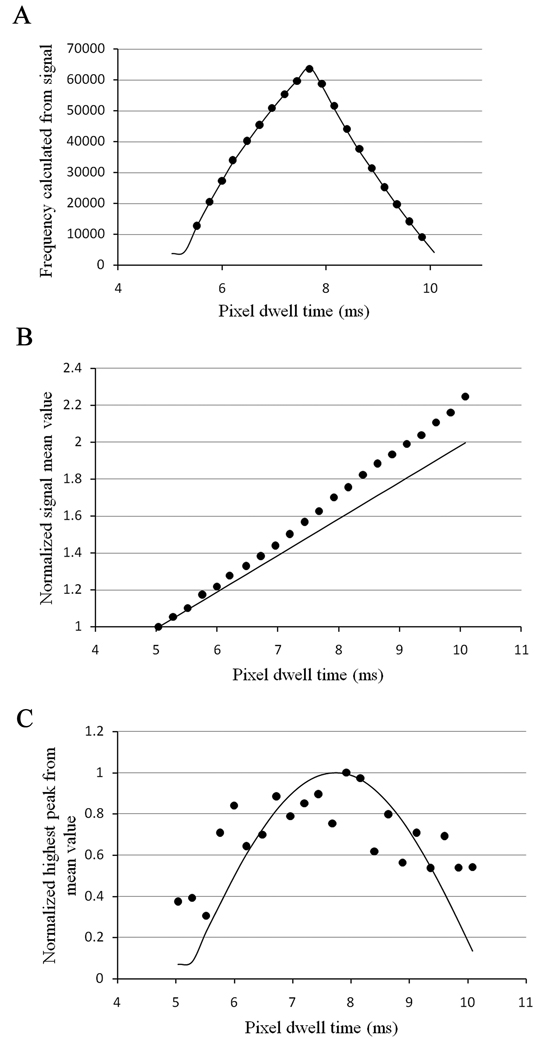
To obtain reliable FCS data, the noise of the detector should be uncorrelated. In the Nikon C1, the detector noise is only visible when the offset of the detector is set above a certain threshold. In our case, for the detector in the red channel, this offset value is 127. When a background image is taken with the laser turned off, one should get a Gaussian distribution for the detector readout noise and a distribution of digital levels for the few photons detected in those conditions (Figure 1a). However, we found that this was not always the case with our system. For instance for a pixel dwell time of 7.68 µs, we can clearly see two peaks for the readout noise of the detector (Figure 1b). When the profile trace of the background noise is analyzed (Figure 1c), we see that these two peaks result from the presence of a high frequency signal in the background noise. This will result in correlation of the detector noise as can be seen in Figure 1d. To characterize this high frequency signal, we used the “FFT properties” version 3.5 software (written by Janez Atmapuri Makovsek, Dew Research, Slovenia) to calculate the Fourier transform of the background signal for increasing pixel dwell time (from 5.04 µs to 10.08 µs). We also simulated a high frequency signal as a function of integration time and calculated the Fourier transform for these simulations. The data obtained from the measured background signals and the simulations were then compared. In addition to frequency, two other parameters that influence the analysis have been compared (Figure 2), namely the signal mean value which corresponds to the offset of the detector background signal and the ‘peak from mean’ value which corresponds to the amplitude of the contribution of the high frequency signal to the background noise. We found that no particular frequency could be obtained for the background noise of the detector for pixel dwell times of 5.04, 5.28 and 10.08 µs. For pixel dwell times between these values, we found that the frequency extracted from the data increases up to a pixel dwell time of 7.68 µs and then decreases (Figure 2a). We could match these frequencies for each pixel dwell time by simulating background signals with a sine wave and a frequency of 194.2 KHz (Figure 2a). As expected, the mean value of the signal increases with the increased integration time. The slope for the measured data is steeper than the simulated data since the readout noise of the detector increasingly contributes to the mean signal with increasing pixel dwell time (Figure 2b). We found that the amplitude contribution of this high frequency signal also varies with the integration time and although the measured data do not perfectly follow the simulated data, due to the contribution of the readout noise, they show the same trend (Figure 2c).
Figure 1.
(a) Dark current distribution of digital levels of one of the photomultipliers of the Nikon C1 with a pixel dwell time of 10.04 µs. (b) Dark current distribution of the same photomultiplier with a pixel dwell time of 7.64 µs. (c) Dark current trace of the detector with a pixel dwell time of 7.64 µs. (d) Autocorrelation function of the dark current with a pixel dwell time of 7.64 µs.
Figure 2.
(a) Frequency in the dark current of the detector. The lines are the simulation for different integration time of a 194.2 KHz signal. The dots are the frequencies calculated from the dark current. (b) Normalized mean value of the dark current (offset). (C) Amplitude variation of the signal around the mean value.
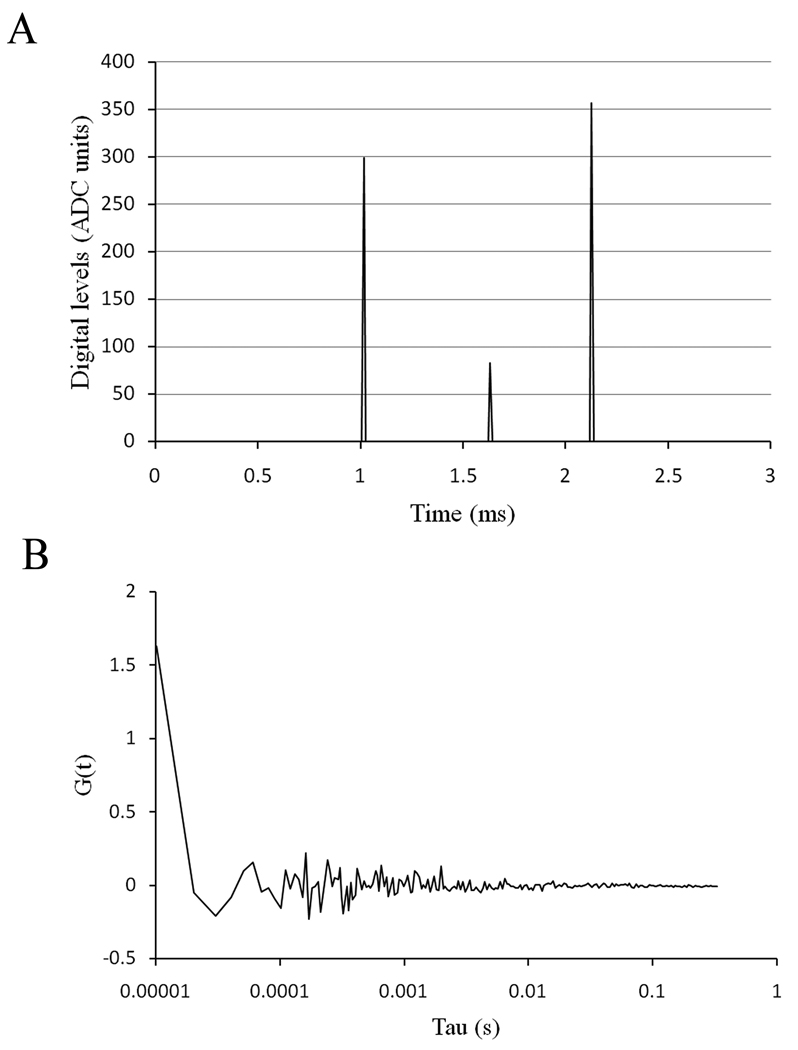
For the FCS data acquisition, we needed to minimize the effect of the background. Therefore we selected a pixel dwell time were the high frequency signal contributes the least. Also by adjusting the offset just below the threshold level, we decreased the high frequency contribution as well. When the background signal of the detector is collected under these conditions (Figure 3a), and the autocorrelation of these data is calculated, we observed that only the first 2–3 points are highly correlated (Figure 3b).
Figure 3.
(a) Dark current of the detector when the offset is lowered just below the threshold level. (b) Autocorrelation function of the dark current.
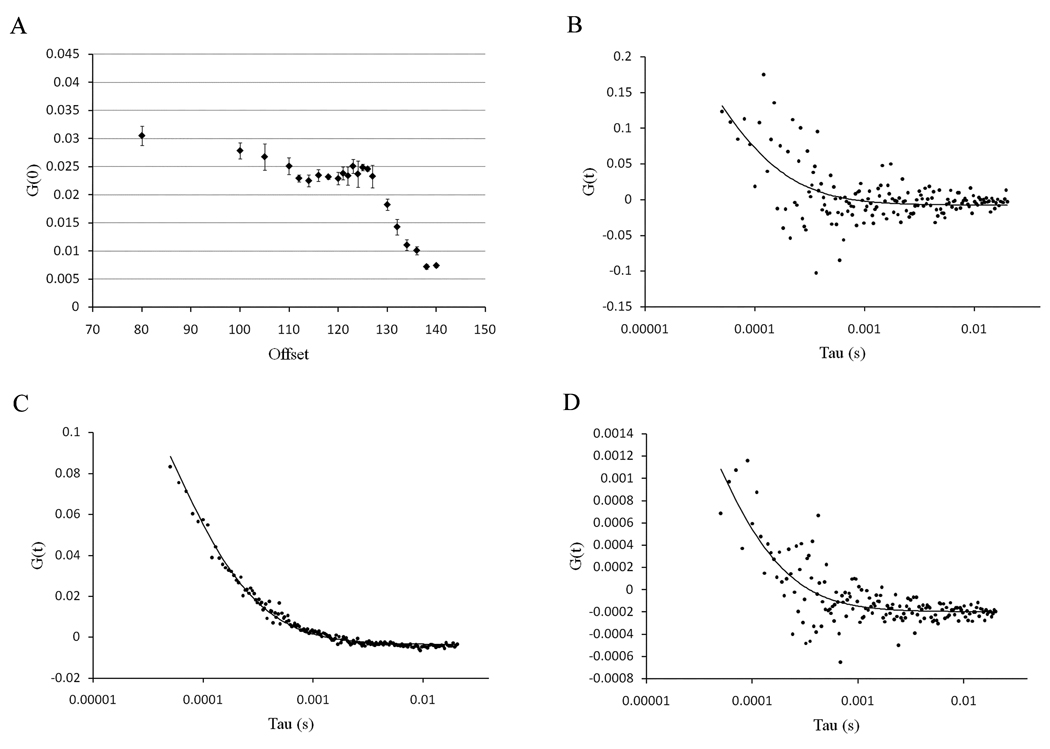
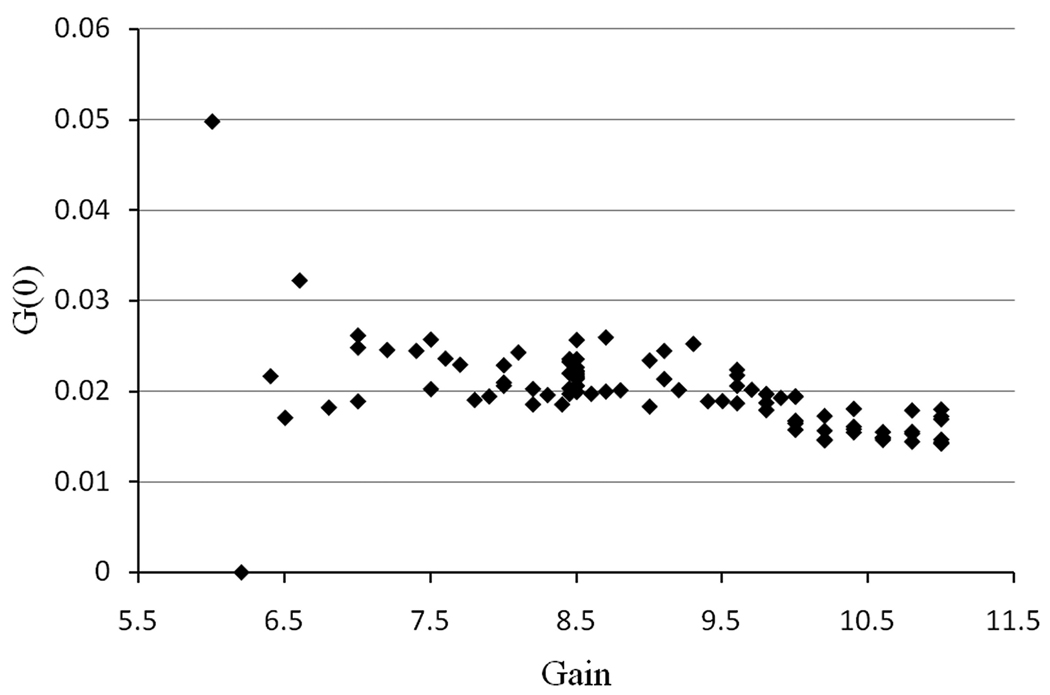
Since we decreased the offset below the threshold level, we tested the effect of the offset on the extrapolation of the autocorrelation function at time zero (G(0)). The results are presented in Figure 4. For these experiments, a large stock of Rhodamine B solution was prepared and the solution in the microscope chamber was replaced with a fresh solution for each measurement in order to prevent possible changes in the G(0) values due to progressive photobleaching. The G(0) value is reasonably constant when the offset is set below the threshold level (Figure 4a). However, as the offset is decreased we are progressively cutting off the low intensity values of the signal and the data becomes noisy (Figure 4b). For offset values slightly below the threshold, we obtain good autocorrelation curves with a minimum of noise (Figure 4c). On the other hand, for offsets above the threshold, we note that the G(0) value decreases sharply (Figure 4d).
Figure 4.
(a) Value of the autocorrelation function extrapolated to time zero as a function of offset from the Nikon C1 software. The errors are the standard error of the mean. (b) Autocorrelation curves of Rhodamine B in water calculated for an offset of 80. (c) Autocorrelation curves of Rhodamine B calculated for an offset of 125 and (d) autocorrelation curves of Rhodamine B calculated for an offset of 140. The solid line is the fit for a diffusion coefficient of 420 µm2/s.
The effect of the gain of the detector on the G(0) value was also investigated (Figure 5). This parameter sets the voltage value (between 0 to 1250 V) applied to the PMTs and thus changes the sensitivity of the detectors. Again, we used a stock solution of Rhodamine B and replaced the solution in the observation chamber for each measurement. We found that for low gain values, the sensitivity of the detector is too low and we are unable to collect enough photons, so the noise in the G(0) value is large. Raising the gain to between 7.5 and 9 in our conditions (i.e. fluorophore concentration), resulted in fairly constant G(0) values. When the gain was raised above 9, a small decrease in the G(0) value was observed due to progressive saturation of the detectors.
Figure 5.
Effect of gain on the determination of the G(0) value for Rhodamine B in water. The data were fitted for a diffusion coefficient of 420 µm2/s.
Single point FCS measurements
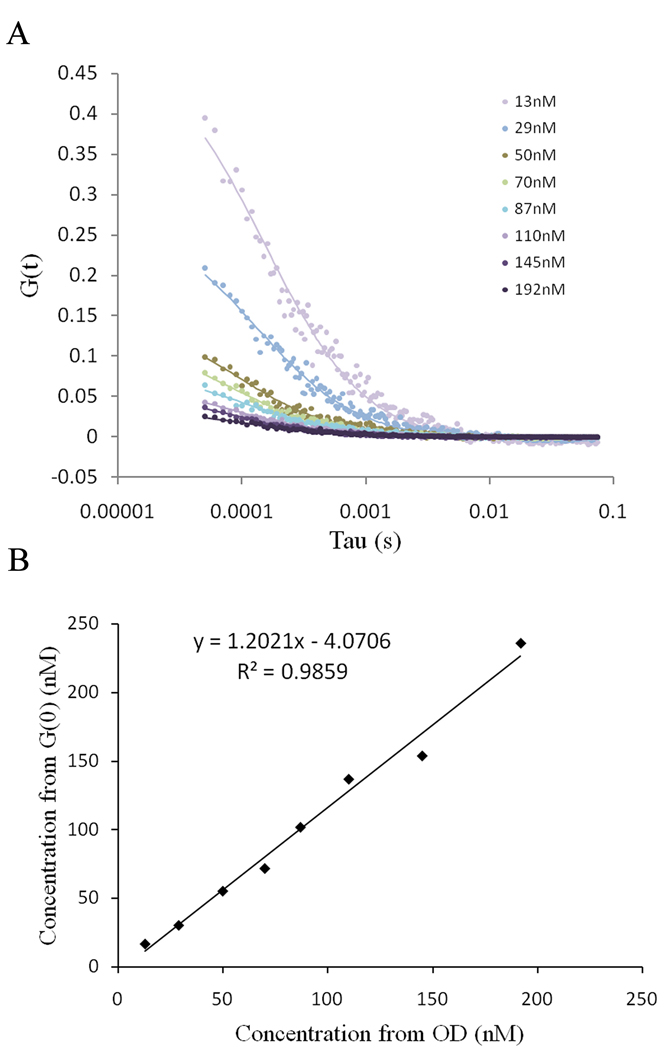
We wanted to determine whether or not our system was sensitive and accurate enough to measure both the diffusion coefficient and number of fluorophores in biological samples. We obtained FCS data in EGFP solutions of different concentration ranging from 13 nM to 192 nM (Figure 6a). The autocorrelation curves were fitted using Globals (LFD, University of California, Irvine) and a diffusion coefficient of 89.6 µm2/s (final χ2 of 4.81) was obtained. The number of molecules in the detection volume was calculated from the G(0) values using the following equation:
| (Eq 5) |
where N is the average number of molecules in the PSF, and γ is a geometric factor which depends on the shape of the excitation volume (Chen et al., 2000). Assuming a 3D Gaussian, the value of γ is 0.3536. The volume of the PSF was calculated using:
| (Eq 6) |
where ωr is the radial waist and ωz is the axial waist of the PSF.
Figure 6.
(a) Autocorrelation data (dots) for various concentrations of EGFP in PBS. The data were fitted using Global analysis (solid lines). (b) Plot of the concentration of EGFP determined from the extrapolation of the autocorrelation at time zero and the concentration determined by absorbance measurements.
The fluorophore concentrations calculated from the FCS data are in very good agreement with the concentrations of the solutions determined by optical density measurements (Figure 6b).
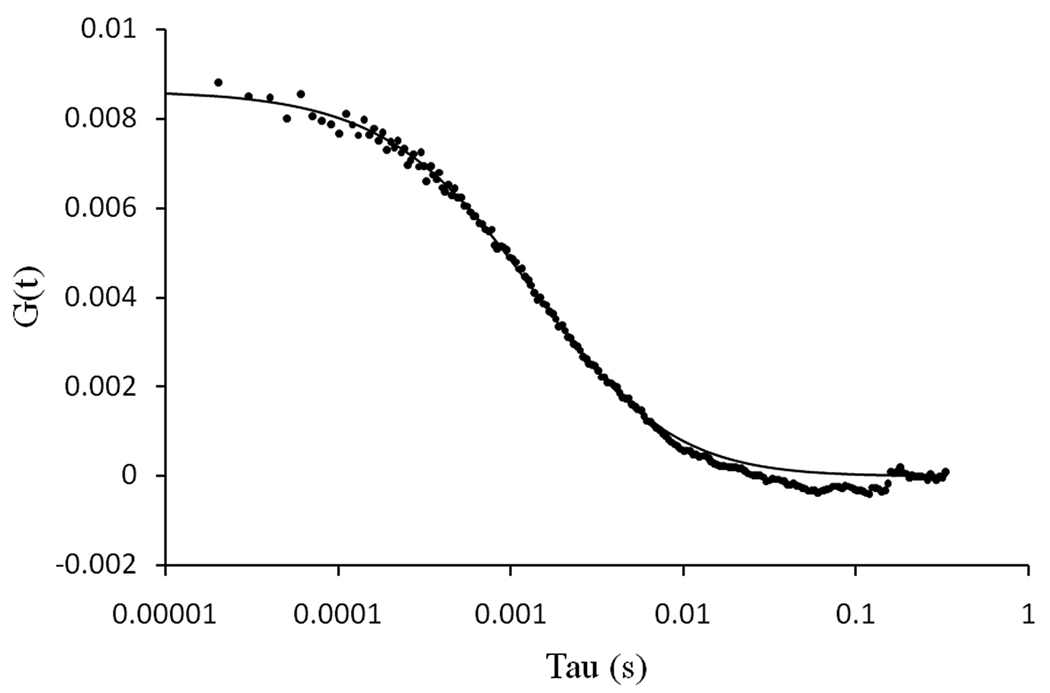
Single point FCS data were also acquired from the top of immobilized GUVs made of POPC and labeled with 0.1% DiIC18 (Figure 7). In this case, the data were fitted to a 2D diffusion process. The average diffusion coefficient at 20°C was 9.49 ± 0.5 µm2/s (mean ± stdev; n=7).
Figure 7.
Autocorrelation data (dots) obtained for 0.1% DiIC18 incorporated into the membrane of a GUV made of POPC. The solid line is the fit of the data.
Number & Brightness analysis
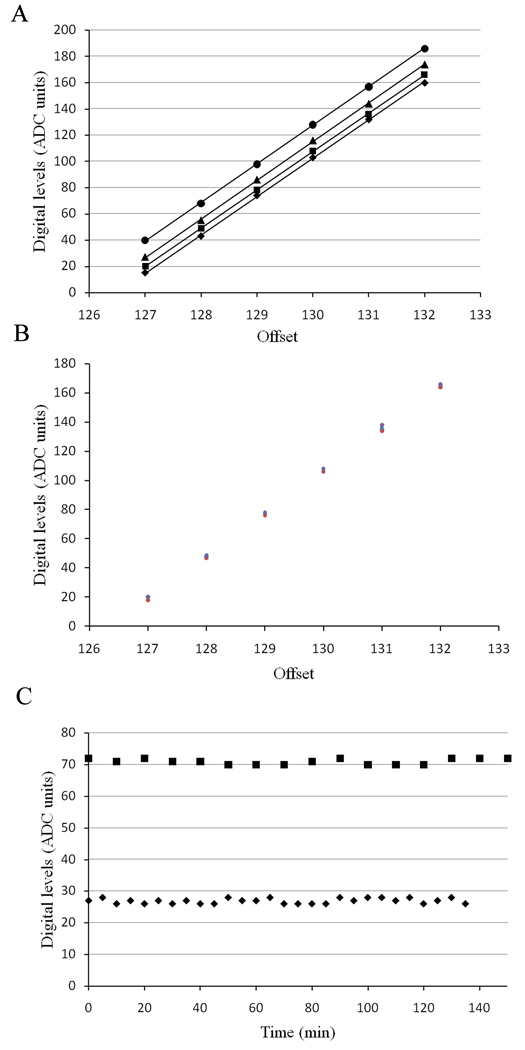
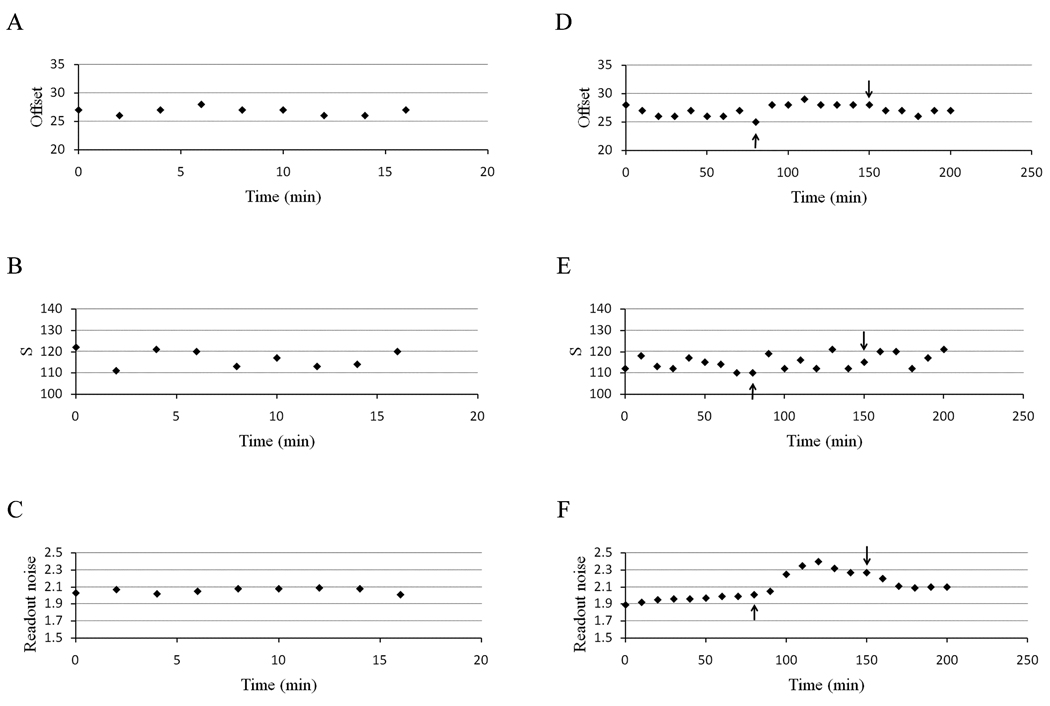
For Number & Brightness data on a laser scanning confocal microscope, three factors need to be determined: The readout noise of the detector, the distribution of digital levels (S) and the offset of the detector (Dalal et al., 2008). Also the stability of these parameters with time and temperature are important. We first investigated the relationship between the offset of the signal in digital levels and the values set in the C1 Nikon software. We found that, for a given pixel dwell time, there is a perfect linear relationship between the software values and the digital levels obtained for each offset (Figure 8). We also found that the slope of the regression curve does not change with increasing gain. In addition, there does not seem to be any significant changes in the offset values between different days or different times (after an initial warm up of the microscope) on the same day (Figure 8b). The offset values only vary by ±1 digital levels (ADC units) regardless of the value set by the software and are fairly stable with time within these limits (Figure 8c). We investigated the variations of the readout noise, the distribution of digital levels (S) and the offset between consecutive measurements (Figure 9). We observed that the offset value fluctuates within the same range (±1) regardless of whether the time between measurements is increased to 5 or 10 min (Figure 8c). We also found that while the readout noise of the detector is virtually stable (between 2.025 to 2.09), the distribution of digital levels shows large variations (Figure 9a and b). However, when the temperature of the room was increased from 20 to 26°C we found that the distribution of digital levels was not affected by the temperature (Figure 9f). The average offset value seems to increase slightly by one digital level (Figure 9e) while the readout noise is the most affected (Figure 9d). Specifically, we observe an increase in readout noise with increasing temperature and a decrease when the temperature is returned to 20°C.
Figure 8.
(a) Relationship between offset and digital levels for different gains with a pixel dwell time of 10.04 µs. (◆) Gain of 7; (■) gain of 8; (▲) gain of 9; (●) gain of 10. The solid lines are the linear regression for each gain. (b) Variation of digital level with time for a gain of 8 and a pixel dwell time of 10.08 µs. The data were collected for each offset value on the same day with 4 hour intervals and also on 3 different days of the week. (C) Variation of the digital level values as a function of time for offsets of 127 (◆) and 128 (■) for a gain of 8.4 and a pixel dwell time of 10.04 µs.
Figure 9.
Variation of the analog detector parameters as a function of time for a pixel dwell time of 10.04 µs and a gain of 8.4. Variation of the offset digital levels (a), of the digital level distribution (S) for consecutive measurements (b) and of the readout noise of the detector (c) for consecutive measurements. Variation of the same parameters with 10 minutes between the measurements and effect of the temperature on the offset (e), distribution of digital levels (f) and readout noise (g). The up arrow indicates the time at which the room temperature was increased to 26 °C, while the down arrow indicates the time when the temperature was turned back to 20°C.
Measurements in GUVs
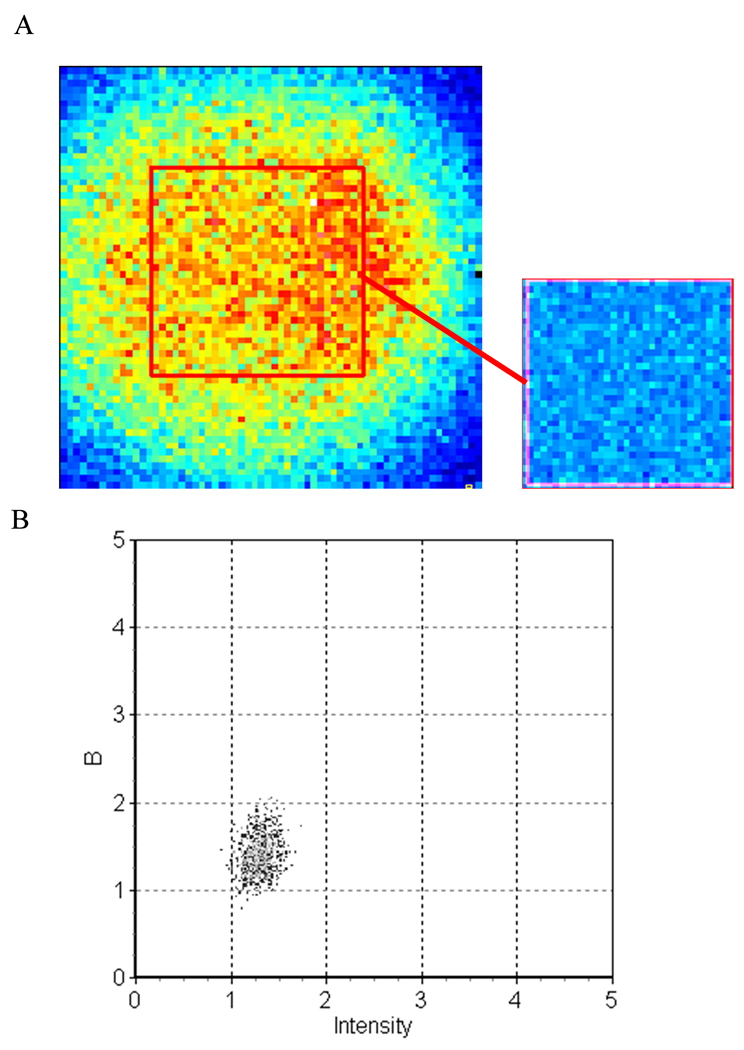
We acquired 100 frames of a 64 × 64 pixel image (pixel size of 49.4 nm) of the top of a GUV containing 0.1% BODIPY TMR PI(4,5)P2 with a detector gain value of 8.4 and an offset of 127 (just above the threshold level). We determined the average distribution of digital levels from a series of background files (i.e. with the laser off). We calculated a value for S of 502.6 ± 5.3 (mean ± stdev), a measured offset of 17 digital levels and a readout noise for the detector of 6.11. This value of the readout noise is larger than the value 2.05 in Figure 9. This is due to the fact that for images acquired using 64 × 64 pixels, the shortest possible pixel dwell time on the Nikon C1 is 13.92 µs, resulting in the presence of a high frequency background signal. To analyze the GUV for Number & Brightness, we selected only the top region of the GUV membrane using a region of interest (ROI) of 32 × 32 pixels. The plot of apparent brightness (B) versus intensity is shown in Figure 10a. We found a single population of BODIPY TMR PI(4,5)P2 uniformly distributed within the top of the GUV (Figure 10b), suggesting that the labeled PI(4,5)P2 are monomeric. From the values of B and average intensity, we calculated a true brightness of 0.405 giving ~29000 photons /molecule/sec with an average number of 6.35 molecules in the detection volume.
Figure 10.
(a) Intensity map of the top of a GUV made of POPC with 0.1% BODIPY TMR PI(4,5)P2. The red square represents the region analyzed. The insert is the brightness map of the region. (b) Plot of the apparent brightness versus intensity of the GUV for the region analyzed.
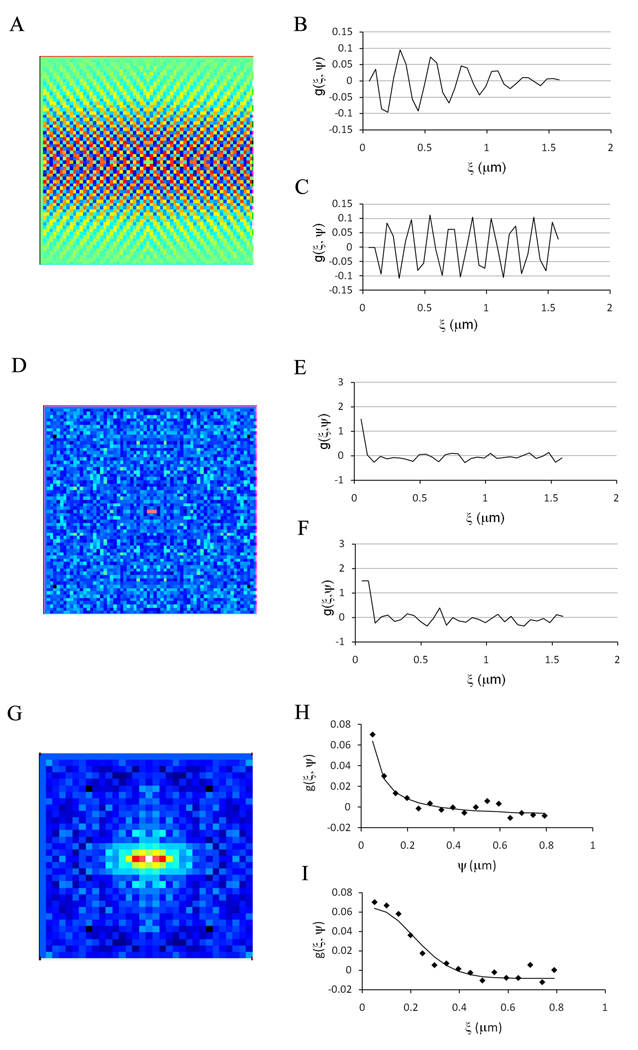
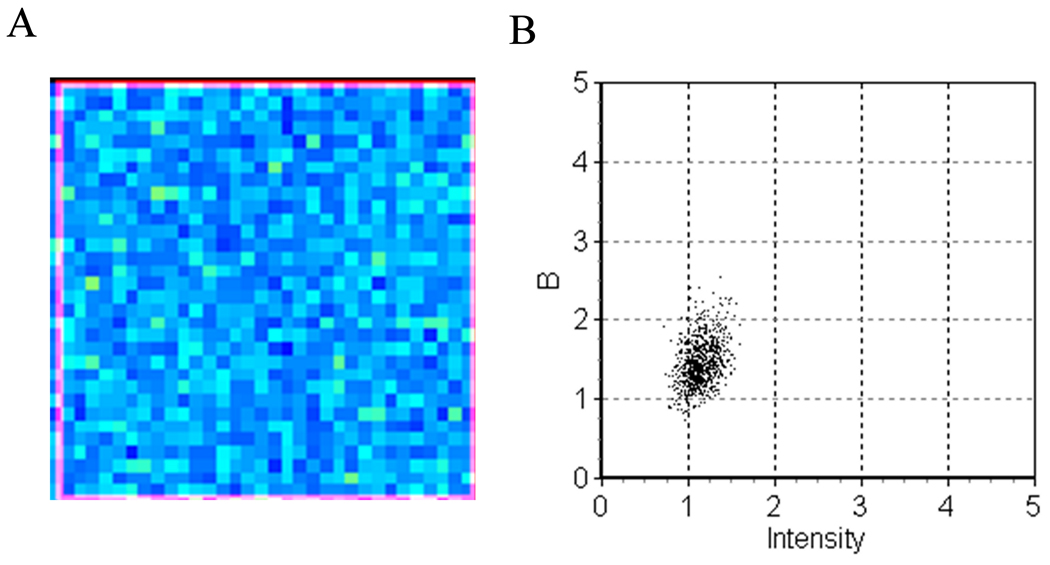
To evaluate the possibilities of performing RICS and Number & Brightness on the same data set, we first analyzed a background file (acquired with the laser off) using RICS (Figure 11a). Figure 11b and c show the vertical and horizontal autocorrelation function obtained with an offset of 127. Like the single point FCS measurements; the autocorrelation function (ACF) is dominated by the high frequency noise of the detector. By decreasing the offset below the threshold level (i.e. 125), the sensitivity was increased and we were able to detect the correlation in the first two points due to the bleed through noise from pixel to pixel (Figure 11 d–f). We then recorded 100 frames of the same GUV used for Number & Brightness but with the offset set at 125. We analyzed the top region of the GUV using a ROI of 32 × 32 pixels. The spatial autocorrelation function is shown in Figure 11g–i together with the fit of the horizontal and vertical ACF. The values obtained from the fit gives a diffusion coefficient for the labeled PI(4,5)P2 of 7.1 µm2/s and an average of 6.75 molecules in the detection volume. This lead to the question; can we analyze the same data set using Number & Brightness? Since the relationship between the offset values on the software and the digital levels is linear, and does not change significantly with time, we can extrapolate the linear relation to values of offset below the threshold. We calculated that the S value for an offset of 125 is −42.6 for a gain of 8.4. Using this value, we analyzed the data set from the same GUV using Number & Brightness. From the apparent brightness and average intensity (Figure 12), we calculated a true brightness of 0.423 corresponding to ~30,000 photons/molecules/sec and an average of 5.4 molecules in the detection volume.
Figure 11.
(a) Spatial autocorrelation map of the dark current for a pixel dwell time of 13.92 µs when the offset of the detector is set to 127, just above the threshold level. (b and c) are the vertical and horizontal autocorrelation function, respectively. (d) Spatial autocorrelation map of the dark current for a pixel dwell time of 13.92 µs when the offset of the detector is set to 125, just below the threshold level. (e and f) are the vertical and horizontal autocorrelation function, respectively. (g) Spatial autocorrelation map of the GUV analyzed in Figure 10 with the offset set at 125, a gain of 8.4 and a pixel dwell time of 13.92 µs. (h and i) are the vertical and horizontal autocorrelation function, respectively. The solid line is the fit of the data (discarding the first two points).
Figure 12.
(a) Brightness map of the GUV analyzed in Figure 10 with the offset set at 125. (b) Plot of the apparent brightness versus intensity for the region analyzed.
Single point FCS, Number and Brightness analysis and RICS on the same sample
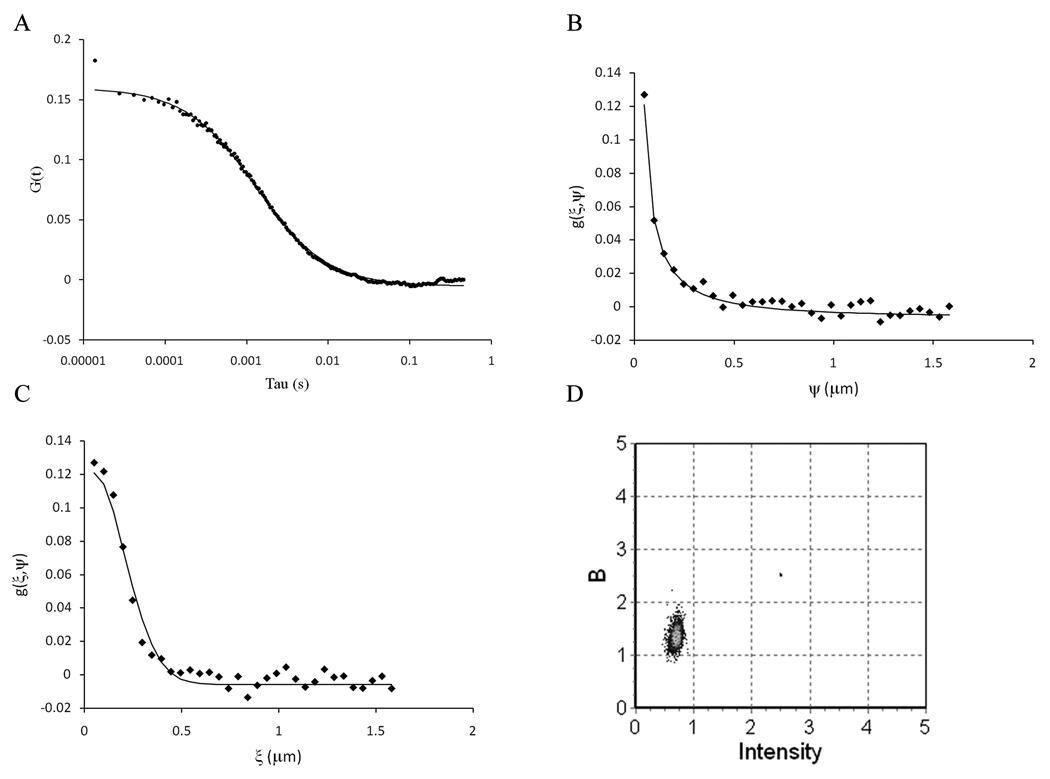
The same GUVs were analyzed using both single point FCS and RICS/Number & Brightness. The data were recorded for single point FCS (1 frame of 2048 × 2048 pixels) and immediately afterwards we recorded 100 frames of 64 × 64 pixels without changing any other parameters on the microscope. The fit of the autocorrelation function using a 2D diffusion model (Figure 13a) gave a diffusion coefficient of 9.2 µm2/s with a G(0) value of 0.165, which corresponds to an average of 3 molecules in the detection volume. The RICS analysis of the 100 frames gave a diffusion coefficient of 8.6 µm2/s with a G(0) value of 0.127, corresponding to an average of 3.9 molecules (Figure 13 b–c). When the same frames are analyzed for Number & Brightness, we obtained a true brightness of 0.305 and an average intensity of 0.654, giving on average 4.3 molecules in the detection volume and a brightness of 22000 photons/molecule/sec (Figure 13d). On average, we found that the diffusion coefficient of BODIPY TMR PI(4,5)P2 was consistently slower when determined by RICS (7.7 ± 2.0 µm2/s, mean ± stdev, n = 6) than when determined by single point FCS (10.0 ± 0.7 µm2/s) for the same GUVs. We also obtained a slightly higher number of molecules in the detection volume using RICS (3.10 ± 0.9) compared to single point FCS (2.33 ± 0.7).
Figure 13.
(a) Analysis of the same GUV using single point FCS (a), RICS (b and c) and Number & Brightness (d) using a pixel dwell time of 13.92 µs, a gain of 8.4 and an offset of 125. (a) Autocorrelation function obtained from the top of the GUV. The solid lines are the fit of the data. (b) Vertical profile of the spatial autocorrelation function. (c) Horizontal profile of the autocorrelation function. The images were acquired using 64 × 64 pixels, with a pixel size of 49.4 nm. (d) Plot of the apparent brightness versus intensity for the same image analyzed by RICS.
DISCUSSION
In this paper, we obtained single point FCS data as well as RICS and Number & Brightness data on a laser scanning confocal microscope with analog detectors both in solution and in GUVs, a model system of the plasma membrane. Recently, Dalal et al., and Brown et al. demonstrated the feasibility to determine the particle number and brightness and the diffusion coefficient on both an Olympus Fluoview 300 and an Fluoview 1000, respectively (Brown et al., 2008; Dalal et al., 2008). In 2009, Gielen et al. also used RICS to investigate the diffusion of lipid-like probes within GUV membranes using a Zeiss LSM 510 META one photon microscope (Gielen et al., 2009). Because each microscope has its own idiosyncrasies, the parameters described in these previous papers cannot necessarily be applied to other microscopes. Therefore, we characterized the Nikon C1 and discuss the optimal conditions to determine molecule dynamics using this low cost confocal microscope.
Analog detector characterization
One of the major obstacles to obtaining reliable FCS and RICS data using the Nikon C1 is due to the presence of a high frequency leakage signal in the detector noise background trace. This noise results in unwanted correlations. To reduce these, we adopted the following strategies. The pixel dwell time was selected (whenever possible) so that it was in phase with the high frequency signal. In our case, this corresponds to pixel dwell times of 5.04, 10.08, 20.16 etc µs per pixel. We also eliminate part of the influence of the signal by lowering the offset of the detector just below the threshold level and we maximize the signal of the sample against the background using a gain which results in 0.01 to 0.03% of the total number of pixels saturated. In these conditions, we observe a high correlation of the background noise of the detector only in the first few data points both in single point FCS and RICS analysis. Unlike the correlation spectrum of the background noise reported for the Zeiss LSM 510 META, which extends by several pixels in the ξ axis (Gielen et al., 2009), we only see this correlation for the first 2–3 points as reported for the detectors of the Olympus (Brown et al., 2008). These points result from the electronics not completely resetting between integration periods, so that some signal from the previous integration time is carried over to the next, producing a high correlation. A similar approach to Brown et al. was taken, whereby the contribution of these few points was eliminated by ignoring the first 2–3 data points during analysis (Brown et al., 2008).
For Number & Brightness, Dalal et al. characterized their detectors using 3 parameters (S, offset and readout noise) and showed that in their system, these parameters varied significantly over 1–2 h while successive measurements produced values that did not differ substantially (Dalal et al., 2008). On the contrary, we found that the detectors on the Nikon are more stable with time but that there is a larger range of fluctuation in the S factor between consecutive measurements. Therefore, instead of recording a background image just before and after the measurement, we can record a series of background images and calculate the mean value for the S factor. Also, while on the Olympus all 3 parameters were sensitive to temperature, on the Nikon the offset was completely unaffected by increasing room temperature, and the S factor was only slightly affected, but that the readout noise followed very quickly the temperature changes. Dalal et al. have previously reported the importance of the value of the readout variance at low light level (Dalal et al., 2008). We found that in our conditions, changing the readout variance by 200% did not change significantly the values of molecular brightness or number of particles. However, both the distribution of the digital levels (S) and the offset value are critical for determining the molecular brightness and number of particles. In the Nikon, to eliminate artifacts due to the high frequency noise for single point FCS and RICS, we need to decrease the offset to below threshold. Fortunately, due to the stability of the offset between hours or days, it is possible to extrapolate the offset value below the threshold for each detector gain and pixel dwell time setting, so that the true sample intensity can be obtained and the data compared between single point FCS, RICS or Number & Brightness.
Diffusion coefficient and number of molecules in the detection volume
For measurements of EGFP in solution by single point FCS, we show that we can ascertain the number of molecules in the detection volume for concentrations ranging from 14 to 192 nM. We determined a diffusion coefficient for EGFP of 89.6 µm2/s which is in very good agreement with the value of 87 µm2/s reported by Terry et al. (Terry et al., 1995). We further determined the diffusion coefficient of fluorescent lipid-like probes within the membrane of GUVs and reported a diffusion coefficient of 9.49 ± 0.5 µm2/s for DiIC18 and 10.0 ± 0.7 µm2/s for BODIPY TMR PI(4,5)P2. Again, the diffusion coefficient measured for the DiIC18 probe is in very good agreement with the value of 8.02 ± 0.01 µm2/s reported by Gielen et al. (Gielen et al., 2009). These results demonstrate that we are able to measure diffusion coefficient both in solution and within GUV membranes using single point FCS. The diffusion coefficient reported for BODIPY TMR PI(4,5)P2 is significantly faster than the 3.3 ± 0.8 µm2/s reported by Golebiewska (Golebiewska et al., 2006; Golebiewska et al., 2008). However, there are two major differences between our study and the ones by Golebiewska et al. First, in the above papers the detection volume was calibrated by measuring the diffusion of Rhodamine 6G assuming a value of D = 280 µm2/s. In their paper, Gendron et al. measure a diffusion coefficient for Rhodamine 6G of 400 µm2/s (Gendron et al., 2008). If in our experiments we calibrate the detection volume using the same value as Golebiewska et al. (i.e. 280 µm2/s instead of 420 µm2/s), we obtain a diffusion coefficient for BODIPY TMR PI(4,5)P2 of 6 µm2/s, which is closer to the one reported by Golebiewska (Golebiewska et al., 2006; Golebiewska et al., 2008). The second difference is the composition of the GUVs. While we only used POPC and 0.1% BODIPY TMR PI(4,5)P2 in our GUVs, Golebiewska (Golebiewska et al., 2008) made them with POPC and palmitoyl-oleoyl phosphatidylserine (POPS) in a 9 to 1 ratio. It is possible that the different lipid composition and negative charges on the membrane of these GUVs may result in a lower diffusion coefficient for BODIPY TMR PI(4,5)P2.
We also found that the diffusion coefficient of BODIPY TMR PI(4,5)P2 determined by RICS is slightly lower than the one determined for the same GUVs using single point FCS (7.7 ± 2.0 µm2/s compared to 10.0 ± 0.7 µm2/s, respectively). This difference probably results from the curvature of the membrane as, during the scanning, the PSF crosses different portions of the membrane. Similarly, the average number of molecules determined from the G(0) values in RICS is slightly higher than from the G(0) values in single point FCS.
When the data are analyzed by Number & Brightness, the average number of molecules in the detection volume is not only influenced by the cross section area of the membrane in the PSF, but also depends on the values of the offset and distribution of digital levels, and therefore may differ from the values obtained by RICS. By taking the average value of the distribution of the digital levels, we could be making a relatively large error in S. With the gain settings used, the lowest and highest S value obtained in the series of background files were 495 and 511, respectively. Using the value of 503 means that the error we would make is about 1.6%. It should be noted that reducing the gain will lower the S value and will also increase the error in the S value to about 5% (Figure 9). However, reducing the gain will also increase the dynamic range allowing larger aggregates to be measured. As previously mentioned by Dalal et al., small errors (1%) in the determination of the offset or the S values will result in larger errors (16–18%) in the absolute value of number of molecules and the true brightness (Dalal et al., 2008). However, these errors do not prevent the determination of relative brightness values across an image, and therefore will allow the characterization of aggregates, as long as the monomer state is present together with the aggregates in the same images.
Conclusions
We have shown that it is possible to obtain dynamic information about fluorescent molecules from single point FCS, RICS and Number & Brightness using a low cost commercial confocal microscope; the Nikon C1. We highlighted the fact that care should be taken in selecting the acquisition parameters in order to avoid possible artifacts due to the detector noise. Because of the presence of a high frequency signal leakage in the detector noise, it is best to select a pixel dwell time that is in phase with this high frequency noise. Also, lowering the offset to just below the threshold value and adjusting the gain to maximize the signal range both optimize the data collected. We show that we obtain a consistent set of values when comparing single point FCS and RICS or Number & Brightness. However, due to relatively large errors in determining the distribution of digital levels for a given microscope setting, the system is probably only adequate for determining relative brightness within the same image.
ACKNOWLEDGEMENTS
This work was supported by a research project grant (568301) from the National Health and Medical Research Council (NHMRC), Australia. The LFD is supported jointly by the National Center for Research Resources of the National Institutes of Health (PHS 5 P41-RR003155) and the University of California, Irvine, CA.
REFERENCES
- Angelova MI, Soleau S, Meleard P, Faucon JF, Bothorel P. Preparation of giant vesicles by external AC fields. Kinetics and application. Prog. Colloid Polym. Sci. 1992;89:127–131. [Google Scholar]
- Brown CM, Dalal RB, Herbert B, Digman MA, Horowitz AR, Gratton E. Raster image correlation spectroscopy (RICS) for measuring fast protein dynamics and concentrations with a commercial laser scanning confocal microscope. Journal of Microscopy. 2008;229(1):78–91. doi: 10.1111/j.1365-2818.2007.01871.x. [DOI] [PMC free article] [PubMed] [Google Scholar]
- Chalfie M, Tu Y, Euskirchen G, Ward WW, Prasher DC. Green fluorescent protein as a marker for gene expression. Science. 1994;263(5148):802–805. doi: 10.1126/science.8303295. [DOI] [PubMed] [Google Scholar]
- Chen Y, Muller JD, So PT, Gratton E. The photon counting histogram in fluorescence fluctuation spectroscopy. Biophys J. 1999;77(1):553–567. doi: 10.1016/S0006-3495(99)76912-2. [DOI] [PMC free article] [PubMed] [Google Scholar]
- Chen Y, Muller JD, Tetin SY, Tyner JD, Gratton E. Probing ligand protein binding equilibria with fluorescence fluctuation spectroscopy. Biophys J. 2000;79(2):1074–1084. doi: 10.1016/S0006-3495(00)76361-2. [DOI] [PMC free article] [PubMed] [Google Scholar]
- Dalal RB, Digman MA, Horwitz AF, Vetri V, Gratton E. Determination of particle number and brightness using a laser scanning confocal microscope operating in the analog mode. Microscopy Research and Technique. 2008;71(1):69–81. doi: 10.1002/jemt.20526. [DOI] [PubMed] [Google Scholar]
- Digman MA, Brown CM, Sengupta P, Wiseman PW, Horwitz AR, Gratton E. Measuring fast dynamics in solutions and cells with a laser scanning microscope. Biophysical Journal. 2005;89(2):1317–1327. doi: 10.1529/biophysj.105.062836. [DOI] [PMC free article] [PubMed] [Google Scholar]
- Digman MA, Dalal R, Horwitz AF, Gratton E. Mapping the number of molecules and brightness in the laser scanning microscope. Biophys J. 2008;94(6):2320–2332. doi: 10.1529/biophysj.107.114645. [DOI] [PMC free article] [PubMed] [Google Scholar]
- Fidorra M, Duelund L, Leidy C, Simonsen A, Bagatolli LA. Absence of fluid-ordered/fluid-disordered phase coexistence in ceramide/POPC mixtures containing cholesterol. Biophys J. 2006;90:4437–4451. doi: 10.1529/biophysj.105.077107. [DOI] [PMC free article] [PubMed] [Google Scholar]
- Gendron PO, Avaltroni F, Wilkinson KJ. Diffusion coefficients of several rhodamine derivatives as determined by pulsed field gradient-nuclear magnetic resonance and fluorescence correlation spectroscopy. J Fluoresc. 2008;18(6):1093–1101. doi: 10.1007/s10895-008-0357-7. [DOI] [PubMed] [Google Scholar]
- Gielen E, Smisdom N, vandeVen M, De Clercq B, Gratton E, Digman M, Rigo J-M, Hofkens J, Engelborghs Y, Ameloot M. Measuring Diffusion of Lipid-like Probes in Artificial and Natural Membranes by Raster Image Correlation Spectroscopy (RICS): Use of a Commercial Laser-Scanning Microscope with Analog Detection. Langmuir. 2009;25(9):5209–5218. doi: 10.1021/la8040538. [DOI] [PMC free article] [PubMed] [Google Scholar]
- Golebiewska U, Gambhir A, Hangyás-Mihályné G, Zaitseva I, Rädler J, McLaughlin S. Membrane-bound basic peptides sequester multivalent (PIP2), but not monovalent (PS), acidic lipids. Biophysical Journal. 2006;91(2):588–599. doi: 10.1529/biophysj.106.081562. [DOI] [PMC free article] [PubMed] [Google Scholar]
- Golebiewska U, Nyako M, Woturski W, Zaitseva I, McLaughlin S. Diffusion Coefficient of Fluorescent Phosphatidylinositol 4,5-bisphosphate in the Plasma Membrane of Cells. Molecular Biology of the Cell. 2008;19(4):1663–1669. doi: 10.1091/mbc.E07-12-1208. [DOI] [PMC free article] [PubMed] [Google Scholar]
- Lundgren HP, Binkley CH. Application of rhodamine-B to interaction studies in proteins and simple model systems. Journal of Polymer Science. 1954;14(74):139–158. [Google Scholar]
- Magde D, Elson E, Webb WW. Thermodynamic Fluctuations in a Reacting System - Measurement by Fluorescence Correlation Spectroscopy. Physical Review Letters. 1972;29(11):705–708. [Google Scholar]
- Moens PDJ, Bagatolli LA. Profilin binding to sub-micellar concentrations of phosphatidylinositol (4,5) bisphosphate and phosphatidylinositol (3,4,5) trisphosphate. Biochimica Et Biophysica Acta. 2007;1768(3):439–449. doi: 10.1016/j.bbamem.2006.12.012. [DOI] [PubMed] [Google Scholar]
- Terry BR, Matthews EK, Haseloff J. Molecular characterisation of recombinant green fluorescent protein by fluorescence correlation microscopy. Biochem Biophys Res Commun. 1995;217(1):21–27. doi: 10.1006/bbrc.1995.2740. [DOI] [PubMed] [Google Scholar]
- Wawrezinieck L, Rigneault H, Marguet D, Lenne PF. Fluorescence correlation spectroscopy diffusion laws to probe the submicron cell membrane organization. Biophys J. 2005;89(6):4029–4042. doi: 10.1529/biophysj.105.067959. [DOI] [PMC free article] [PubMed] [Google Scholar]


