Abstract
We have developed a microfluidics based platform and methodology named MAPS (microfluidic system for analyzing proteins in single complex) for detecting two protein interactions rapidly using a single fluorophore. Target proteins were labelled with Quantum dot 525 (QD525) via specific polyclonal antibodies, and were transported through the microfluidic channel subsequently, where the 375 nm excitation laser light was focused to form a detection volume. Photon bursts from target proteins passing through the detection volume were recorded and their photon burst histograms were plotted which demonstrated roughly the specific protein interaction ratio based on their population and statistical behavior. As a proof of concept, Src/STAT3 protein complex interaction ratios with and without EGF stimulation were obtained by MAPS within 1 h and the results were well matched with the one obtained by the conventional immunoprecipitation/Western blot (IP/WB).
Introduction
Single molecule detection (SMD) assisted by micro/nano-fluidic devices has attracted tremendous attention in the last decade.1 Most conventional bio-analytical techniques quantifying proteins, DNA or RNA utilize ensemble measurements that only average yield information for the entire population in a certain time frame. However, biological samples are mostly far from homogeneous, and therefore, any fluctuation, reaction between intermediate states and time trajectories of observables for a subpopulation within a heterogeneous system are masked with conventional ensemble measurements.2 SMD techniques, on the other hand, are able to provide us with invaluable information regarding molecular dynamics that are hidden and sometimes impossible to obtain with conventional techniques.3 Micro/nanofluidic technology, developed rapidly over the last ten years,4–9 offers a spatial confinement of molecules in one or two dimensions in a continuous flow system. This feature not only ensures a fixed position for interrogation of target molecules but also avoids repeated detection of the same molecule. As channel dimensions shrink and become comparable to or smaller than the optical excitation volume, uniform excitation of target molecules and high detection efficiency can be achieved, and signal-to-noise ratio can be improved significantly as the background from scattering or intrinsic fluorescence of unlabelled species in the probe volume is minimized. Microfluidic devices enable SMD for studying molecules in their native environment or at their physiological concentration, which is traditionally difficult to proceed. In addition, the implementation of miniaturized devices greatly reduces sample consumption and as lab-on-a-chip technology advances, integrated high-throughput parallel detection system will become feasible for large scale interaction screening process. By merging these two approaches, it is obvious that we can achieve the optimal requirements for the analysis and manipulation of samples in the single molecule level.1,10–12 This type of approach had already been applied in many different fields, such as DNA separation,13–15 sequencing,16 mapping, and fragment sizing.17–20 In addition to the aforementioned fields, molecule-molecule interaction studies at single molecule level in bulk solutions, on planer surfaces21–25 and in microfluidic flowing environment26,27 has become an active research area in recent years. For these studies, two fluorescent colors detection is the common scheme; nevertheless, it requires two separated optical paths and photodetectors. Because of the complexity of the optical and detection systems, the implementation of such system is costly. Therefore, in order to avoid such complications, the development of a single fluorescent color based molecule-molecule interaction detection system is important.
Living cells respond to stress from outside or extracellular stimulation such as hormone and growth factors and alter their gene expression profiles to adapt to it. These events are tightly regulated by signal transduction pathways, and the deregulation of the pathways is closely associated with serious diseases such as cancer, neurological disorder and diabetes. Signal transduction is mainly controlled by protein modifications such as protein phosphorylation, acetylation or methylation; e.g. one enzyme protein adds or removes some modifications in other enzyme proteins to activate or inactivate them. These series of reactions amplify the signaling and finally reach transcription factors that regulate gene expression. Because protein modifications rely on protein-protein interactions, modern molecular biology and biochemistry have developed many different approaches to identify protein-protein interactions such as mass spectrometry, immunoprecipitation (IP)/Western blot, Fluoresence resonance energy transfer (FRET), and yeast two-hybrid systems. However, these techniques have several limitations that restrict scientists from further understanding the mechanism of signal transduction. For instance, IP/Western blot is a very useful and common method to detect protein-protein interaction qualitatively. However, it is difficult to quantify protein-protein interaction by this method because it analyzes a population of target protein, but not individually. Moreover, it is very difficult to detect more than two proteins interaction by this method due to the loss of target protein complex during the very complicated procedure. In addition, it requires a large amount of samples and long processing time to perform the experiment. Proteomic mass spectrometry is another powerful tool to indentify novel protein interactions. However, similar to immunoprecipitation, it requires a large amount of samples and long sample processing and detection time. FRET is a good detection method which can indicate not only protein-protein interactions but also the complex localization. It doesn't need a large amount of samples but requires specific labelling. It is also difficult for FRET to provide quantitative information regarding the amount of interaction. In addition, it is difficult for FRET to detect interaction within a larger interaction complex since the distance of interaction might be too far to trigger FRET effect. Yeast two-hybrid system is a powerful in vitro based interaction screening technique. It can screen for potential protein-protein interactions but often shows false positive result. Therefore, the potential interactions usually need to be confirmed by other conventional methods such as IP/Western blot. In order to improve the protein-protein interaction detection technique, we report a detection scheme utilizing one fluorescent label to identify the interaction of two specific proteins, Src and STAT3, in cancer cell lysate by using a surface-treated fused silica microchannel. Continuous individual burst events are measured and analyzed in terms of their photon counts. Based on their photon burst histogram, individual specific protein or protein complex can be identified. Thus, this novel assay technique offers a simpler, faster and more reliable approach than conventional methods.
Experimental
Reagents and chemicals
Quantum dot (QD) 525 conjugated anti-rabbit secondary antibodies were purchased from Invitrogen Corporation (Carlsbad, CA). Rabbit polyclonal antibodies for Src (#2108) and STAT3 (C-20) were purchased from Cell Signaling Technology, Inc. (Danvers, MA) and Santa Cruz Biotechnology, Inc. (Santa Cruz, CA), respectively. Dithiobis (succinimidyl propionate) (DSP) was purchased from Pierce (Thermo Fisher Scientific Inc., Rockford, IL). Dulbecco's modified Eagle's medium/F12 medium was purchased from Gibco (Invitrogen Corporation, Carlsbad, CA). Polyethyleneimine (PEI, Mw = 10,000) was purchased from Alfa Aesar (Ward Hill, MA). Immunoprecipitation (IP) buffer was prepared by 20 mM Hepes-KOH, 0.1 mM KCl, 2 mM MgCl2, 15 mM NaCl, 0,2 mM ethylenediaminetetraacetic acid (EDTA), 1 mM dithiothreitol, and 10% glycerol. RIPA lysis buffer was prepared by 50 mM Tris-HCl, 1% NP-40, 150 mM NaCl, and 1 mM EDTA plus protease inhibitors.
Setup of MAPS
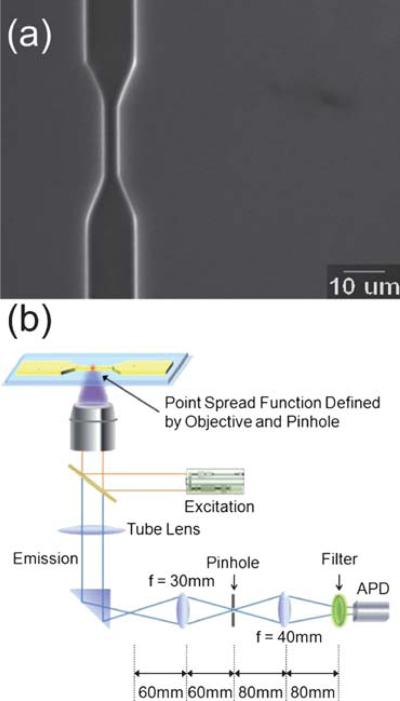
The microfluidic device was fabricated on a 500 and a 170 μm-thick UV grade fused silica wafers (Mark Optics, Santa Ana, CA) using photolithograpy, etching and glass bonding.28 A scanning electron microscope (SEM) image of microfluidic channels is shown in Fig. 1a. The detection channel has a width of 2 μm on a 500 μm thick fused silica wafer and CHF3 plasma was used to dry etch the channel to a depth of 500 nm. A protective surface coating was then spin-coated onto the wafer and injection ports were drilled by a sand-blast tool. After the removal of surface coating and a thorough piranha cleaning, a UV grade fused silica cover wafer of 170 μm thickness is carefully clinched to the substrate wafer using deionized (DI) water as intermediate. Subsequently, these two wafers were permenantly bonded by annealing at 1050 °C in air for 5 h. The schematic diagram of MAPS is shown in Fig. 1b. In brief, 375 nm laser light was focused by a 1.25 NA, 60X objective lens. The laser diameter was 1.7μm and the intensity distribution was Gaussain. Moleculses in cell lysate solutions were electrokinetically flown into the channel. The electroconductivity and PH of sample solution for all experiment were kept constant to create constant electroosmotic flow in channels. Photon bursts from target proteins passing through the detection volume were recorded by the avalanche photodiode (APD) at 100 khz for 50 s and was repeated for ten times. In order to prevent the protein adsorption, high-molecular-mass polyethyleneimine (PEI) was coated on the surface of channel. PEI is a positively charged polymer and was found to coat irreversibly to the fused silica surface. In this experiment, a 0.5 (w/v)% PEI in IP buffer was prepared, and the coating precedure is simply to flush the microchannel with PEI/IP buffer overnight.
Fig. 1.
Experiment setup. (a) SEM image of microchannel used for all experiment. The depth and width of channel is 500 nm and 2 μm respectively. A 375 nm laser was focused on the tapered region of the channel. (b) MAPS detection set up. Excitation laser is focused through the 60X microscope objective lens. Photon bursts were detected by the avalanche photodetector.
Cancer cell lines
HeLa cell line (a human cervical cancer cell line) was kept in Dulbecco's modified Eagle's medium/F12 medium supplemented with 10% fetal bovine serum and antibiotics. During experiments, HeLa cells were cultured without fetal bovine serum at least 12 h and stimulated with 50 ng/ml epidermal growth factor (EGF) for 30 min.
QD525 labeled proteins
HeLa cells were treated with DSP at a final concentration of 1 mg/ml for 5 min to crosslink protein complexes, followed by harvesting of cell lysates. Cell lysate samples were prepared by washing the cells with ice-cold phosphate-buffered saline (PBS) 2 times, and lysing in RIPA lysis buffer. The cell debris was removed by applying 12,000g of centrifugation for 10 min after sonication of cell lysates. Pierce BCA (bicinchoninic acid) protein assays kit was used to measure protein concentrations in the total lysates. Rabbit polyclonal antibodies for Src and STAT3, QD525 conjugated anti-rabbit secondary antibodies (400 ng/ml), and 10 μg of protein lysates (with Src and STAT3) were then incubated at 4 °C for 4h. During the incubation, target proteins interacted with primary antibodies and QD conjugated secondary antibodies and formed protein complexes.
Detection of protein-interaction
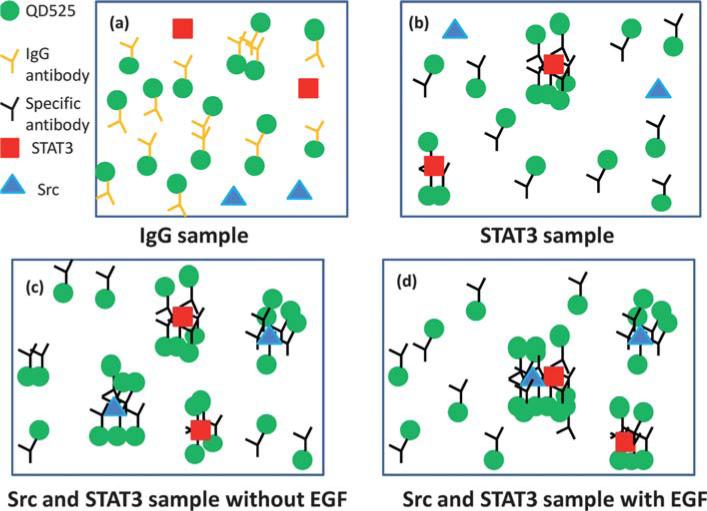
Sample solutions were electrokinetically loaded into micro-channels for protein-complex analysis. As a proof of concept, the interaction between oncogenic proteins in cultured cancer cells, Src and STAT3,29 was characterized by MAPS. First, unbound-QDs were injected and detected by using solution of HeLa cell lysate incubated with a QD525 secondary antibody conjugated control IgG, that does not bind to target proteins. The schematic diagram of this IgG sample is shown in Fig. 2a. There are possibly single, double and triple QD525 complexes in this cell lysate sample. For detecting the interaction of Src and STAT3, since EGF is known to be able to trigger the physical interaction between Src and STAT3, the cancer cell samples were prepared in the presence or absence of EGF stimulation. As a first step, STAT3 in cell lysate without EGF stimulation was labelled with QD525 as shown in Fig. 2b. There are QD525 and STAT3/QD525 complexes in the sample solution. This sample determines the boundary between STAT3 and Src/STAT3 in the photon burst histogram. Then, QD525-labeled Src and/or STAT3 specific antibodies were then incubated with sample cell lysates described previously, followed by the detection. The schematic diagrams of labelled molecules are shown in Fig. 2c and d without and with EGF stimulation, respectively. These samples potentially contained QD525, QD525/STAT3, QD525/Src and STAT3/Src/QD525. For all these experiments, the concentrations of QD525 were constant.
Fig. 2.
Schematic diagram of molecular labelling for (a) IgG (b) STAT3/QD525, (c) QD525/STAT3, QD525/Src and QD525/Src/STAT3 without EGF stimulation and (d) QD525/STAT3, QD525/Src and QD525/Src/STAT3 with EGF stimulation. The concentration of QD525 was constant for all experiments and the change of photon burst histogram was due to molecular interactions. There was one cell lysate sample blended with different antibodies.
When labelled molecules flowed through the detection spot, photon bursts from molecules in cell lysate samples were collected. The raw data of photon bursts were smoothened using fast Fourier transform (FFT) process.30 A noise level was defined after noise filtering for every collected data based on both its signal shape and the shape of blank solution that has no QD added. A photon burst over the noise level line was viewed as a valid photon burst signal. Histograms (frequency as a function of photon counts) were plotted based on those valid photon burst signals.
Results and discussions
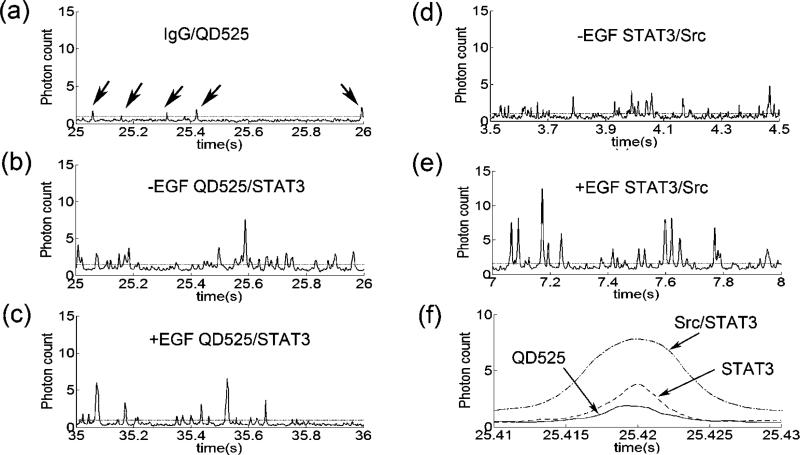
The part of continuous photon burst profile from QD525/control IgG sample is shown in Fig. 3a. The individual photon bursts over the noise level line were defined as photon burst signals from QD525/control IgG. FFT filtered continuous photon burst profiles from protein complexes QD525/STAT3 (−EGF), QD525/STAT3 (+EGF), QD525/Src/STAT3 (−EGF) and QD525/Src/STAT3 (+EGF) samples are shown in Fig. 3b–e, respectively. Because multiple epitopes on the target protein were recognized by the specific antibody, multiple QD525 were bound to the target proteins, which demonstrated higher photon counts than that of single QD 525 (Fig. 3b and c). Once target proteins with QD525 form a two protein complex, the number of photon burst counts in such two protein complex event was obviously higher than that of single protein with QD525 (Fig. 3e). All photon burst peaks higher than the noise level were plotted in a histogram for analysis. The determination of noise level is found elsewhere [10]. Individual photon burst profiles from QD525, QD525/STAT3 and QD525/STAT3/Src shown in Fig. 3a–e are also shown in Fig.3f for a direct comparison. There are differences in photon counts and burst width among them. The integrated area of these photon burst peaks including the noise floor were plotted in the histogram.
Fig. 3.
Photon burst profiles obtained from (a) QD525/control IgG sample, (b) QD525/STAT3 sample without EGF stimulation, (c) QD525/STAT3 sample with EGF stimulation, (d) QD525/Src/STAT3 sample without EGF stimulation, (e) QD525/Src/STAT3 sample with EGF stimulation, (f) the comparison of real photon bursts from Src/STAT3/QD525, STAT3/QD525 and QD525.
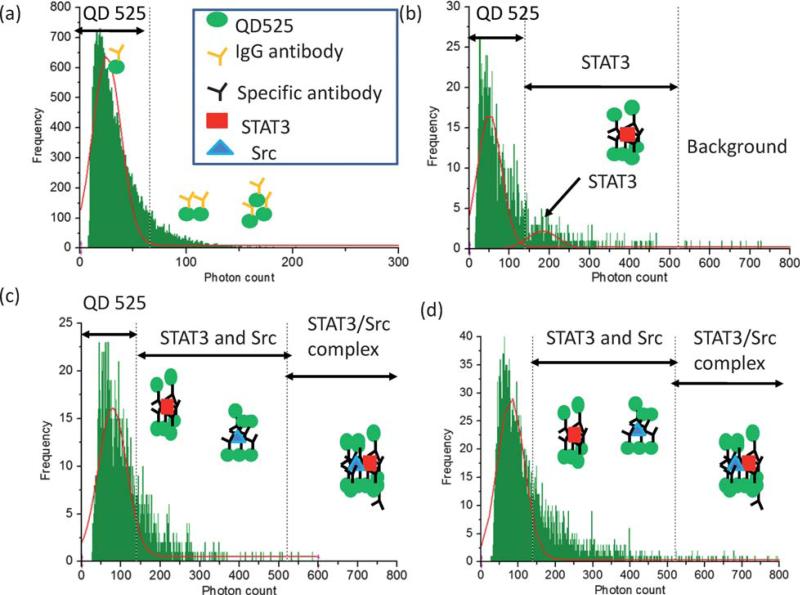
Photon burst histograms obtained from QD525/IgG sample shows a Gaussian distribution (Fig. 4a). The reason why the higher end of this distribution was extended was due to the aggregations of QD525, and other physical and chemical reasons. Although the surfactant was used for all experiments, these multiple QD525 complexes were formed and tend to extend the Gaussian tail. In addition, our protein complex is much smaller than the beam spot size. This may be another reason why Gaussian distribution is broadened. The maximum value of photon counts for QD525/control IgG can be calculated by μ + 3δ, where μ and δ are the average and standard deviation of photon counts, respectively. Based on this stochastic method, the maximum QD525 photon counts which covers 99% of QD525 distribution was determined to be 65 photon counts. Although some events were distributed higher than 65 photon counts, it was due to some minor non-specific interaction, which was a normal effect in natural antibody and QD525 (Fig. 4a). Because the QD525 concentration was overwhelmed than that of target protein, equal amount of QD525 signal was used to normalize in order to compare with different samples.
Fig. 4.
Results of Src/STAT3 interaction detection. Histogram obtained from (a) QD525/control IgG sample, (b) QD525/STAT3 sample without EGF stimulation, (c) QD525/Src/STAT3 sample without EGF stimulation, (d) QD525/Src/STAT3 sample with EGF stimulation. Boundary lines were determined by the stochastic method. The broadening of Gaussian distribution indicates the existence of Src/STAT3/QD525 complexes.
The photon burst histogram from QD525/STAT3 (−EGFR) sample solution is shown in Fig. 4b, and there are two Gaussian distributions from QD525 and QD525/STAT3. The highest point of QD525/STAT3 was 182 photon counts. The distribution of QD525/STAT3 was widely spread because of the nature of quantum dots. QDs tend to bind together, thus the number of QD bound to target proteins were varied. From this distribution, 99% coverage of photon burst distribution for QD525/STAT3 was determined as 525 photon counts. Src/QD525 in cell lysate solution was also analysed and two Gaussian distribution in the photon burst histogram were obtained. However, the peak location of QD525/Src was 120 counts (highest coverage value was 455), which was smaller than that of STAT3/QD525. Based on these analyses, 525 counts were used as the threshold to distinguish single protein and two proteins complex. The events higher than 525 counts were counted as a background and subtracted from the number of Src/STAT3 complex events.
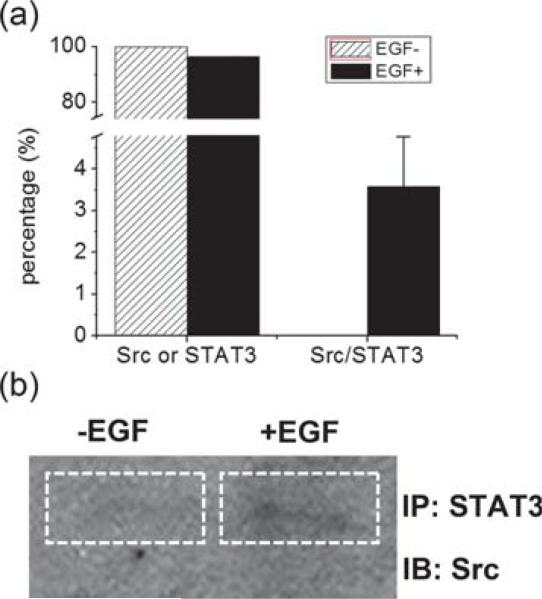
After we obtained the threshold value between single protein and two protein complex, we performed the Src/STAT3 complex detection. The photon burst histograms of Src/STAT3 (−EGF and +EGF) were shown in Fig. 4c and 4d, respectively. Gaussian distributions from Src/QD525 (highest value of 120) and STAT3/QD525 (highest value of 182) were added together and their distribution became the part of the continuous Gaussian distribution of QD525. Because the flow velocities and QD525 concentrations were constant for all experiments, the maximum coverage of QD525/STAT3 and QD525/Src should be 525 photon counts. It is obvious that there were more events of QD525/Src/STAT3 in EGF stimulated sample than that of EGF unstimulated sample shown in Fig. 4c and d. The reason why Src/STAT3 sample did not form a Gaussian distribution was that the number of QD bound to Src/STAT3 complex was not constant. However, it was obvious that Src/STAT3 complex produced large photon counts. Thus, the extended part of Gaussian distribution in Fig. 4d was defined as Src/STAT3 protein complex. After background subtraction and QD525 normalization, no Src/STAT3 complex was identified in the total of 104 QD events in the sample without EGF stimulation. However, 47 Src/STAT3 complexes were detected in the sample of post EGF stimulation, indicating that interaction occurred after ligand stimulation. The binding ratios for these two samples were calculated as the number of Src/STAT3 divided by the sum of Src or STAT3 and Src/STAT3 events.
The results demonstrated that Src and STAT3 had 0% interaction before EGF stimulation and increased to 3.89% after the stimulation (Fig. 5a). This result was well correlated to the IP/Western blot analysis (Fig. 5b), which showed a weak interaction between Src and STAT3 after EGF stimulation. The throughput of MAPS, 1 h to complete is much higher than that of IP/Western blot, which took 3 days to complete whole process. Taken together, these results indicate that the methodology of MAPS approach is appropriate for characterizing two specific proteins interactions from in vivo sample.
Fig. 5.
The comparison of Src/STAT3 interaction detection results. (a) Ratio bar chart for Src or STAT3 and the Src/STAT3 complex before and after EGF stimulation. (b) IP/Western blot analysis of Src and STAT3 interaction before and after EGF stimulation.
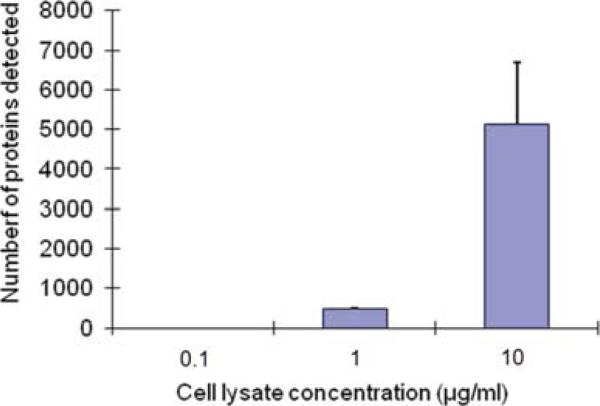
The detection limit of this system was also investigated. The sample solution used for all experiment was 100 μg/ml cell lysate concentrations. This solution was diluted 1/10 (10 μg/ml), 1/100 (1 μg/ml) and 1/1000 (0.1 μg/ml), and the total number of Src, STAT3 and Src/STAT3 from these solution were detected. After the normalization and subtraction of background, the numbers of molecules detected from these sample solutions were shown in Fig. 6. There were no proteins detected from 0.1 μg/ml cell lysate solution. Thus, the detection limit of this sytem was determined as 1 μg/ml cell lysate solution. As a calibration, the numbers of proteins detected in these sample solutions were 10 fold larger.
Fig. 6.
The numbers of Src, STAT3 and Src/STAT3 protein detections from 0.1 to 10 μg/ml cell lysate concentration. The detection limit is 1 μg/ml cell lysate concentration.
Conclusion
We have developed MAPS with one fluorophore detection channel to detect two proteins interactions. Threshold values that can define the target protein unbound QD, single target protein, and target protein complex were determined by the stochastic photon burst counts method. The binding ratio between Src and STAT3 roughly estimated by MAPS was compared to the conventional IP/WB and these results were well matched. However, it took only 1 h to complete all analysis for MAPS, in contrast to 3 days by IP/WB. Thus, MAPS approach is expected to be used for high throughput screening. In addition, because one fluorescent color can detect two proteins interactions, we expect that two-color detection system can dissect a maximum of four proteins interactions, four protein complex population in formation among individual proteins and other combinations.
Acknowledgements
This work is supported from the CMUH Cancer Research Center of Excellence DOH 99-7D-C-111-005, Taiwan, Institute of Basic Science, China Medical University and Hospital/M. D. Anderson Cancer Center Sister Institution Fund, CCSG CA16672, NIH R01 CA109311, NIH PO1 099031, and US Army Department Breast Cancer Research Program W81XWH-08-1-0649-01 to M.-C.H.; NIH R21 CA135318-01A1 and US Army Department Breast Cancer Research Program W81XWH-08-1-0644 to J.K.; US Army Department Breast Cancer Research Program W81XWH-06-1-0709 to C.-K.C.
References
- 1.Dittrich PS, Manz A. Anal. Bioanal. Chem. 2005;382:1771–1782. doi: 10.1007/s00216-005-3335-9. [DOI] [PubMed] [Google Scholar]
- 2.Weiss S. Science. 1999;283:1676–1683. doi: 10.1126/science.283.5408.1676. [DOI] [PubMed] [Google Scholar]
- 3.Weiss S. Nat. Struct. Biol. 2000;7:724–729. doi: 10.1038/78941. [DOI] [PubMed] [Google Scholar]
- 4.Reyes DR, Iossifidis D, Auroux PA, Manz A. Anal. Chem. 2002;74:2623–2636. doi: 10.1021/ac0202435. [DOI] [PubMed] [Google Scholar]
- 5.Auroux PA, Iossifidis D, Reyes DR, Manz A. Anal. Chem. 2002;74:2637–2652. doi: 10.1021/ac020239t. [DOI] [PubMed] [Google Scholar]
- 6.Vilkner T, Janasek D, Manz A. Anal. Chem. 2004;76:3373–3385. doi: 10.1021/ac040063q. [DOI] [PubMed] [Google Scholar]
- 7.Stone HA, Stroock AD, Ajdari A. Annu. Rev. Fluid Mech. 2004;36:381–411. [Google Scholar]
- 8.Tegenfeldt JO, Prinz C, Cao H, Huang RL, Austin RH, Chou SY, Cox EC, Sturm JC. Anal. Bioanal. Chem. 2004;378:1678–1692. doi: 10.1007/s00216-004-2526-0. [DOI] [PubMed] [Google Scholar]
- 9.Squires TM, Quake SR. Rev. Mod. Phys. 2005;77:977–1026. [Google Scholar]
- 10.de Mello AJ. Lab Chip. 2003;3:29N–34N. doi: 10.1039/b304585b. [DOI] [PubMed] [Google Scholar]
- 11.Craighead H. Nature. 2006;442:387–393. doi: 10.1038/nature05061. [DOI] [PubMed] [Google Scholar]
- 12.Mannion JT, Reccius CH, Cross JD, Craighead HG. Biophys. J. 2006;90:4538–4545. doi: 10.1529/biophysj.105.074732. [DOI] [PMC free article] [PubMed] [Google Scholar]
- 13.Han J, Craighead HG. J. Vac. Sci. Technol., A. 1999;17:2142–2147. [Google Scholar]
- 14.Han J, Craighead HG. Science. 2000;288:1026–1029. doi: 10.1126/science.288.5468.1026. [DOI] [PubMed] [Google Scholar]
- 15.Turner SW, Perez AM, Lopez A, Craighead HG. J. Vac. Sci. Technol., B. 1998;16:3835–3840. [Google Scholar]
- 16.Haab BB, Mathies RA. Anal. Chem. 1999;71:5137–5145. doi: 10.1021/ac990644t. [DOI] [PubMed] [Google Scholar]
- 17.Knemeyer JP, Marme N, Sauer M. Anal. Chem. 2000;72:3717–3724. doi: 10.1021/ac000024o. [DOI] [PubMed] [Google Scholar]
- 18.Chan EY, Goncalves NM, Haeusler RA, Hatch AJ, Larson JW, Maletta AM, Yantz GR, Carstea ED, Fuchs M, Wong GG, Gullans SR, Gilmanshin R. Genome Res. 2004;14:1137–1146. doi: 10.1101/gr.1635204. [DOI] [PMC free article] [PubMed] [Google Scholar]
- 19.Larson JW, Yantz GR, Zhong Q, Charnas R, D'Antoni CM, Gallo MV, Gillis KA, Neely LA, Phillips KM, Wong GG, Gullans SR, Gilmanshin R. Lab Chip. 2006;6:1187–1199. doi: 10.1039/b602845d. [DOI] [PubMed] [Google Scholar]
- 20.Foquet M, Korlach J, Zipfel W, Webb WW, Craighead HG. Anal. Chem. 2002;74:1415–1422. doi: 10.1021/ac011076w. [DOI] [PubMed] [Google Scholar]
- 21.Li H, Ying L, Green JJ, Balasubramanian S, Klenerman D. Anal. Chem. 2003;75:1664–1670. doi: 10.1021/ac026367z. [DOI] [PubMed] [Google Scholar]
- 22.Li H, Zhou D, Browne H, Balasubramanian S, Klenerman D. Anal. Chem. 2004;76:4446–4451. doi: 10.1021/ac049512c. [DOI] [PubMed] [Google Scholar]
- 23.Widengren J, Kudryavtsev V, Antonik M, Berger S, Gerken M, Seidel CA. Anal. Chem. 2006;78:2039–2050. doi: 10.1021/ac0522759. [DOI] [PubMed] [Google Scholar]
- 24.Kim D, Kwak YG, Kang SH. Anal. Chim. Acta. 2006;577:163–170. doi: 10.1016/j.aca.2006.06.047. [DOI] [PubMed] [Google Scholar]
- 25.Elf J, Li GW, Xie XS. Science. 2007;316:1191–1194. doi: 10.1126/science.1141967. [DOI] [PMC free article] [PubMed] [Google Scholar]
- 26.Pramanik A. Curr. Pharm. Biotechnol. 2004;5:205–212. doi: 10.2174/1389201043377002. [DOI] [PubMed] [Google Scholar]
- 27.Li L, Chen S, Oh S, Jiang S. Anal. Chem. 2002;74:6017–6022. doi: 10.1021/ac0258148. [DOI] [PubMed] [Google Scholar]
- 28.Jing N, Kameoka J, Su CB, Chou CK, Hung MC. J. Photopolym. Sci. Technol. 2008;21:531–536. [Google Scholar]
- 29.Silva CM. Oncogene. 2004;23:8017–8023. doi: 10.1038/sj.onc.1208159. [DOI] [PubMed] [Google Scholar]
- 30.Moriya N. Nucl. Instrum. Methods Phys. Res., Sect. B. 1991;53:208–211. [Google Scholar]


