Abstract
We applied compressed sensing (CS) to spectral domain optical coherence tomography (SD OCT) and studied its effectiveness. We tested the CS reconstruction by randomly undersampling the k-space SD OCT signal. We achieved this by applying pseudo-random masks to sample 62.5%, 50%, and 37.5% of the CCD camera pixels. OCT images are reconstructed by solving an optimization problem that minimizes the l 1 norm of a transformed image to enforce sparsity, subject to data consistency constraints. CS could allow an array detector with fewer pixels to reconstruct high resolution OCT images while reducing the total amount of data required to process the images.
OCIS codes: (170.4500) Optical coherence tomography, (100.3010) Image reconstruction techniques, (110.3055) Information theoretical analysis
1. Introduction
Optical coherence tomography (OCT) has been used widely in medical diagnosis and research [1–5]. Spectral domain OCT (SD OCT) uses an array detector such as a CCD or CMOS camera to discretize and digitize the spectral interferograms. Due to the Fourier domain detection configuration, SD OCT has superior sensitivity and imaging speed compared to time domain OCT (TD OCT) and, therefore, has supplanted conventional TD OCT in many applications [6–8]. However, the advantages come at a cost: an expensive, large array, and high-speed camera. Moreover, when large imaging depth as well as high axial resolution is required, the camera has to capture spectra at a large sampling rate, because conventional image reconstruction algorithm for SD OCT requires spectral domain sampling beyond Nyquist rate to achieve a certain imaging depth [7]. In other words, the camera has to have enough pixels to guarantee that at least two data points are sampled within one period of the spectral interferogram. Such CCD or CMOS cameras and associated electronics are usually expensive and limit the imaging speed. Besides, it is challenging to transfer and process the large amounts of data acquired [4,9]. In particular, for applications in assisted surgical guidance and intervention, surgeons require reliable, accurate tracking and imaging of the sample surface in real-time, thus high-speed, large imaging depth and high axial resolution are all essential [10,11]. In this study, we explore the potential of using compressed sensing for SD OCT (CS SD OCT), which could reduce the burden of using a large pixel array camera and reduce the amount of data required and subsequent processing for high-resolution image reconstruction.
David L. Donoho first proposed CS as a rigorous mathematical theory [12,13]. Subsequently, CS has become an increasingly popular research topic in medical imaging, with applications in MRI, photoacoustic tomography as well as OCT [14–16]. If the signal has a sparse representation, the theory of CS stipulates that the signal can be reconstructed with good fidelity from highly undersampled random measurements. This implies that for SD OCT, if the OCT images have a sparse representation, highly undersampled random measurements in k-space can yield accurate image recovery through the use of CS reconstruction.
In this paper, we evaluate the CS method by randomly undersampling a k-space SD OCT signal that was experimentally obtained. Images were reconstructed with high fidelity by solving an optimization problem that minimizes the l 1 norm of a transformed image to enforce sparsity, subject to data consistency constraints. To the best of our knowledge, this is the first time that CS has been applied to process an experimentally obtained OCT signal.
2. Common path SD OCT and conventional SD OCT signal processing
In this study, we use a common path SD OCT (CP SD OCT), as illustrated in Fig. 1 [5,8]. The common path configuration enables the system to be compact, rugged, cost-effective, and free of system chromatic dispersion mismatch [3]. The broadband light source illuminates the common path interferometer which consists of a 50/50 fiber optic coupler and a single mode fiber probe serving as both sample and reference arm. The probe is scanned laterally to obtain B-mode image. The reference signal is derived from the partial reflection at the distal end of the probe arm. The reference and the sample signal couple back to the probe arm, interfere, and are detected by the spectrometer, which uses a CCD camera with more than 2000 pixels to discretize and digitize the spectral interferograms. In this study, we combine three superluminescent emission diodes (SLED) to be our broadband source. The broadband source has a ~100nm full width half maximum bandwidth and an 800nm central wavelength. The axial resolution is measured to be 3.2μm.
Fig. 1.
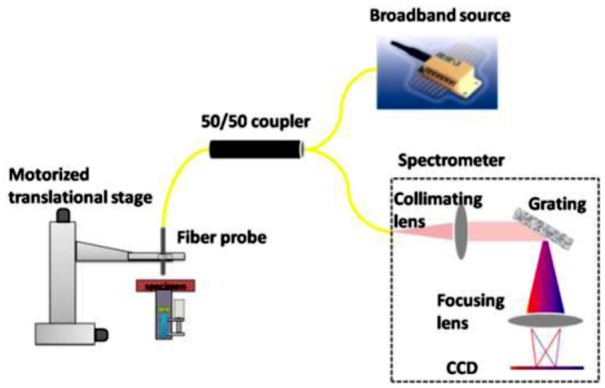
Schematic of CP SD OCT.
The SD OCT system effectively scans the depth profile of a sample in Fourier domain (Ψ) where the measurements are taken. Denoting the sample as a vector x = [x1,x2,, x3, ..., xN] and denoting k-space measurements as a vector y = [y1,y2,, y3,…, yK], we have [7]:
| (1) |
In obtaining the Eq. (1), we consider only the interference term of the detected signal, which also contains auto-correlation term. a 0 is a constant; i is the imaginary unit; xn stands for reflectivity of the sample within the small interval from n δx to n δx + δx; Re() indicates taking the real part of a complex number. According to Nyquist theorem, the total number of samples in Fourier domain, K, has to equal
| (2) |
In Eq. (2), xmax is the maximum imaging depth and Δk is the spectral bandwidth covered by the spectrometer. To achieve high resolution, the spectrometer has to be broadband, i.e., have a large Δk. As a result, increasing both the resolution and the imaging depth require having a larger K. On the other hand, for a given K value, which is the total number of pixels in the CCD camera, Eq. (2) demonstrates an intrinsic tradeoff between the large imaging depth and the high resolution in SD OCT.Rewriting Eq. (1) in a matrix format gives:
| (3) |
In Eq. (3), F is the matrix operator for Fourier transformation (FT). Equation (3) not only shows how the pixel-space and k-space are related, but also suggests that A-scan can be retrieved by inverse Fourier transforming (IFT) the k-space spectral interferogram as shown in Eq. (4). Higher dimensional OCT images (2D or 3D) are obtained by stacking multiple A-scans according to the lateral scanning pattern.
| (4) |
Conventional SD OCT signal processing also involves re-sampling the data to be equispaced in k-space through an interpolation procedure. This is because a linear array camera does not sample the spectral interferogram uniformly in k-space and an equidistance k-space sampling is required for a fast Fourier transformation algorithm (FFT). The interpolation is based on the known functional dependency of wavenumber on the pixel index, k(n), which can be obtained by a spectral calibration procedure [17].
3. Compressed sensing for SD OCT: theory and image reconstruction algorithm
The CS theory stipulates that measuring a small number of random linear combinations of an object x can lead to accurate object reconstruction [12]. For OCT, the linear combinations are simply Fourier coefficients detected by the spectrometer (or k-space samples). Therefore, CS takes a small random subset of k-space data:
| (5) |
In Eq. (5), Fu indicates the matrix operator for incomplete Fourier measurement.
For the CS approach to work, x has to have a sparse representation in a known transform domain, Φ, where the image has only a few non-zero coefficients. Moreover, the k-space undersampling has to lead to incoherent interference in Φ, i.e., the aliasing artifacts due to undersampling have to be noise-like instead of structural. Finally, CS uses a non-linear algorithm to reconstruct the image instead of a linear reconstruction.
Image sparsity in OCT has been studied and deployed in speckle reduction [18]. Given a sparse vector x which has N elements and T non-zero coefficients in the representation domain Φ, x can be reconstructed exactly with probability of at least 1−O( N -δ) with K measurements in Fourier domain, and K has to satisfy the following inequality [12,13,16].
| (6) |
In Eq. (6), Gδ is a small quantity. According to experimental results, a K value that is 2–5 times T can offer satisfying signal through CS reconstruction, i.e., K can be much smaller than required by Eq. (6) in practice [14,16].
To obtain incoherence aliasing artifact, which is another essential requirement for CS, a random undersampling scheme is applied instead of a uniform density undersampling. Under the random sampling scheme, the incoherence between the Fourier domain Ψ and representation domain Φ has been elaboratively studied and is mathematically evaluated by the transform point-spread function (TPSF), defined as Eq. (7) [14].
| (7) |
In Eq. (7), ei denotes the ith vector in Φ (i.e., having ‘1’ at the ith location and zeroes elsewhere), and ej the jth vector. W is the sparsifying operator that transforms x to the representation domain Φ, such as a wavelet transformation operator. W can also be an identity matrix I if the image is sparse in pixel representation; in that case, TPSF becomes PSF. Please note that this PSF is fundamentally different from the PSF used to characterize the resolution of an imaging system.
To recover x from undersampled measurements, as shown in Eq. (5), we cannot simply apply the inverse of Fu to both sides of Eq. (5), because, due to undersampling, Fu is usually ill-conditioned and the inverse of Fu does not exist. Instead, CS recovers x by solving the following constrained optimization problem:
| (8) |
In Eq. (8), ε controls the data consistency; the objective function of this optimization problem is the l 1 norm of the image in Φ and the l 1 norm is defined as ||α||1 = Σi |αi|. Minimizing the l 1 norm of the image essentially promotes sparsity. Various methods that solve Eq. (8) have been developed; in this study we solve Eq. (8) iteratively, using non-linear conjugate gradients (CG) and backtracking line-search [19]. We re-write Eq. (8) as an unconstrained Lagrangian form in Eq. (9):
| (9) |
To find out the solution of this optimization problem, we searched the space where x is defined. In each iteration, the searching direction is calculated based on the gradient of the cost function f(x), and is further adjusted using the Fletcher-Reeves (FR) formula. The searching step size is obtained by backtracking line search. More detailed description of this algorithm can be found in [14] and [19]. In this study, all algorithms are implemented in Matlab 2007a (The MathWorks, Inc., Natick, MA, USA) on a personal computer with a quad-core 2.6-GHz CPU and 8-GB memory. It takes approximately 75 seconds to reconstruct a 2048 × 1000 OCT image using CS by pursuing sparsity in pixel representation. With an optimized algorithm, the reconstruction time can be reduced significantly.
4. Result
4.1 Sampling scheme and simulated PSF
The random undersampling of CS SD OCT spectral data can be realized by using a CCD camera with randomly addressable pixels, which has been developed for high speed imaging [20,21]. Here we use a standard CCD array with 2048 pixels to take spectral measurements. The CCD array covers a the spectral range of 240nm at the sampling rate of 0.117nm/pixel. After taking the spectral measurement, we subsequently undersampled the CCD pixels with a known pseudo-random mask to test and validate our CS reconstruction method.The undersampling scheme is shown in Fig. 2 :
Fig. 2.

Illustration of random undersampling.
After randomly undersampling CCD pixels, we fill the k-space grid with the obtained spectral data according to the known functional dependency of wavenumber on pixel index, k(n). The process is equivalent to sample the k-space signal with another random mask, which is related to the original random mask applied to CCD pixels according to the theorem of random variable transformation. From then on, the randomly undersampled k-space data will be used and we simulate the PSF for the above-described random sampling scheme by letting W in Eq. (7) be an identity matrix. Figure 3 shows PSF (1,j), which equals ejFuFu†e1, when we randomly undersampled 20% of the CCD pixels. The apparent noise in Fig. 3 is effectively the incoherent interference due to the undersampling, and the “noise” standard derivation is about 0.02 (when the peak is normalized to be 1). This suggests a good incoherence between the measurement domain and the OCT image domain.
Fig. 3.
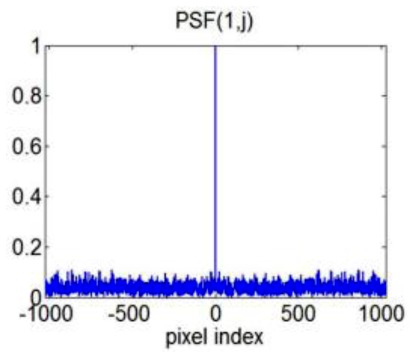
Simulated PSF (1,j) when randomly undersampling 20% of CCD pixels.
4.2 Evaluation of CS SD OCT by imaging a mirror
To analyze the basic properties of CS SD OCT, we imaged a mirror at different imaging depths and the resultant OCT image is explicitly sparse even in pixel presentation. A spectral interferogram detected by our SD OCT system using a standard CCD camera (e2v AVIIVA SM2 CL 2014) is shown in Fig. 4(a) . Figure 4(b) illustrates two different ways to undersample the spectrum: one is equidistant sampling, shown as green squares; the other is the incoherent random undersampling, shown as red circles. Both undersampling schemes sample 20% of the original spectral data, equivalent to about 410 pixels. To show the different artifacts induced by the two undersampling schemes, we applied the standard SD OCT image reconstruction algorithm presented in Part 3 to the fully sampled and undersampled spectral data and show the results as M-mode images in Fig. 5 . Each A-scan in Fig. 5(a) has a single peak corresponding to the mirror surface. However, Figs. 5(b) and 5(c) exhibit strong undersampling artifacts. Figure 5(b) shows structural, coherent aliasing due to uniform density undersampling, while the random sampling results in noise-like interference in Fig. 5(c), consistent with the simulated result in Fig. 3. It is worth mentioning that Fig. 5(b) does not show undersampling aliasing as superposition of shifted replicas of the signal, which should be the case when k-space is undersampled uniformly, zero-filled, and processed by inverse Fourier transformation. The reason is that we do not directly sample the k-space uniformly, but sample the pixels of CCD uniformly.
Fig. 4.
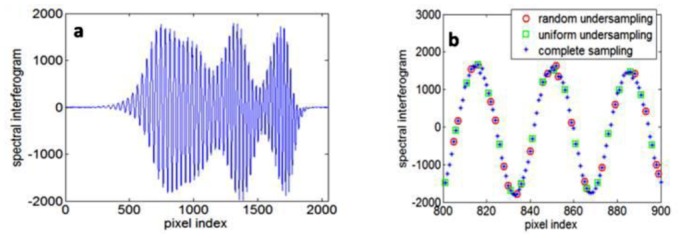
(a) Spectral interferogram obtained by using a mirror as sample; (b) illustration of different sampling schemes (red circles = random undersampling; green squares = uniform undersampling; blue stars = complete sampling).
Fig. 5.
M-scans obtained by standard SD OCT image reconstruction algorithms using different sampling schemes: (a) complete sampling, (b) uniform density undersampling, (c) random undersampling.
We apply the CS reconstruction using the randomly undersampled spectral data, the same data which led to Fig. 5(c) through standard SD OCT reconstruction. We use the iterative non-linear CG method to solve the optimization problem in Eq. (8). After 1 CG iteration, we obtain the A-scan shown in Fig. 6(a) , which shows noise-like incoherence interference induced by the random undersampling. After 11 CG iterations, the “noise level” decreased significantly, as in Fig. 6(b). The CG iteration ends when the optimization problem has been solved. The resulting CS A-scan is shown in Fig. 6(c) as the blue curve. Figure 6(c) also shows A-scan obtained from complete spectral data as the red curve. We processed all the undersampled spectra using the CS reconstruction and show the obtained M-scan image in Fig. 6(d), which is free of the undersampling aliasing artifact. Moreover, Fig. 6(d) shows an improved signal-to-noise ratio (SNR = 10log10[max(x)2/var], var is the noise variance) compared to Fig. 5(a). We calculated the SNR of the first A-scan in Fig. 5(a) and Fig. 6(d) to be 42dB and 54dB, respectively. The improved SNR is due to the non-linear image recovery process which is inherently a denoising procedure [22].
Fig. 6.
(a) A-scan obtained from random undersampled spectrum after the 1st CG iteration, (b) A-scan obtained from random undersampled spectrum after the 11th CG iteration, (c) blue curve: A-scan which is the solution of Eq. (2), red curve: A-scan obtained with complete spectral data; (d) M-scan obtained by CS.
4.3 Evaluation of CS SD OCT by imaging onion cells
To demonstrate that CS can recover more realistic OCT images, we tested the CS recovery on onion cell OCT imaging. Using fully sampled spectral data from CCD and applying the standard SD OCT image processing algorithm, we obtained the image in Fig. 7(a) , which will be used as a ground truth image. We applied pseudo-random masks to sample 62.5%, 50%, and 37.5% of the pixels in the CCD. Using the CS reconstruction, we obtained images shown in Fig. 7(b) to 7(g).
Fig. 7.
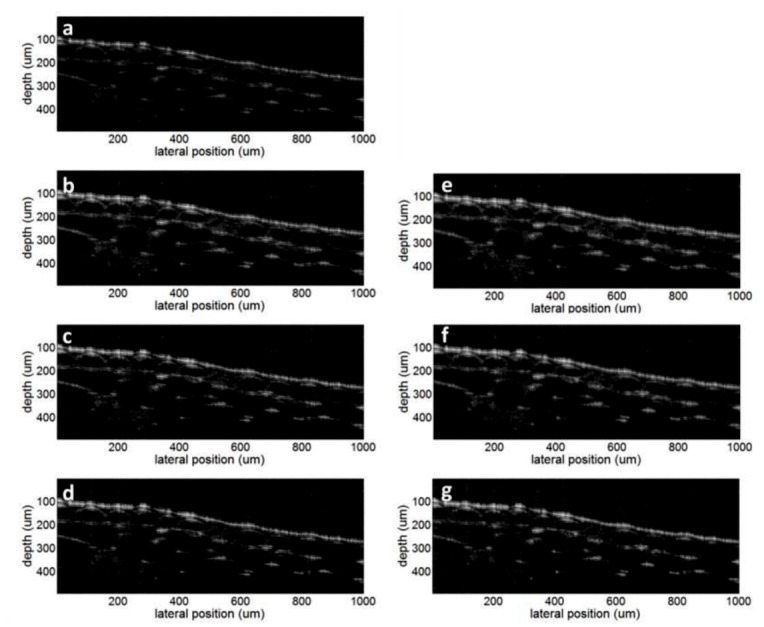
OCT image of onion cells: (a) obtained using complete spectral data; (b), (c), and (d) obtained by sampling 62.5%, 50%, 37.5% of the pixels and pursuing sparsity in pixel domain; (e), (f), and (g) obtained by sampling 62.5%, 50%, 37.5% of the pixels and pursuing sparsity in wavelet domain.
Figure 7(b) to 7(d) were obtained by pursuing sparsity in the pixel representation, i.e., W = I, using 62.5%, 50%, and 37.5% of the spectral data. In addition, we sparsified the images by Symlets4 wavelet transformation and pursued sparsity in the wavelet domain. Figures 7(e) to 7(g) are the resultant images corresponding to 62.5%, 50%, and 37.5% sampling, respectively. All the figures reconstructed by CS show good consistency with the ground truth image Fig. 7(a), because both pixel representation and wavelet representation of the image is sparse.
The images in Fig. 7 show clear and continuous boundary between the onion and the above medium, even when only 37.5% of the pixels are sampled as in Figs. 7(d) and 7(g). This is because the refractive index discontinuity at the sample surface leads to a large signal, which is less subject to information loss due to the undersampling in CS. Moreover, the sharpness of the boundary is preserved, because CS usually does not cause a decrease in resolution; however, it loses some features in the image with low intensity [14]. The clear and continuous boundaries in Fig. 7 suggest that CS can be applied in studying the surface topology of the specimen with high resolution and large imaging depth, which is extremely useful in OCT-assisted surgical guidance and intervention. Such applications of OCT require a reliable and accurate tracking of the sample surface while revealing details of the deeper structure becomes less important [10,11]. To quantitatively evaluate the surface extraction using CS, we obtain the sample’s surface profile from Figs. 7(a) to 7(d) through searching the axial positions of the sample’s surface A-scan by A-scan. The reason we use Figs. 7(b) to 7(d) for this analysis is that CS reconstruction based on sparsity in pixel domain is much simpler, less time consuming than reconstruction based on sparsity in transform domain and offers only slightly reduced performance. To decrease the speckle noise, we apply 2D Gaussian filter with standard derivation of 3 pixels to the OCT images before boundary detection. The pixel indices corresponding to sample surface are denoted as P CS and P GT, for CS images and ground truth image, respectively. We show P GT versus lateral position in Fig. 8(a) . We also calculated ΔP, the difference between P CS and P GT, and show the histograms of ΔP corresponding to different sampling rates in Fig. 8(b). Seen from Fig. 8(b), most of the A-scans in CS OCT image allow us to extract the sample surface exactly the same as using ground truth OCT image and none of the A-scans lead to a ΔP with an absolute value larger than 2. Results in Fig. 8(b) show that CS SD OCT can lead to reliable profiling of the sample surface.
Fig. 8.
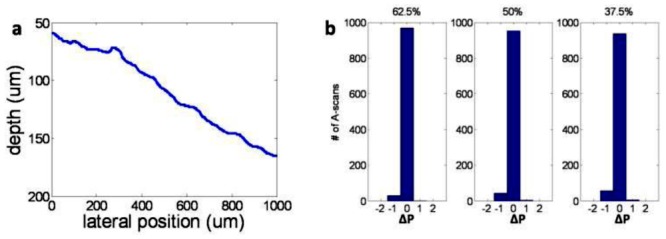
(a) Profile of sample surface obtained from Fig. 7(a); (b) histogram of Δ(P) when sampling 62.5%, 50% and 37.5% of the pixels.
5. Discussion
Speckle, which is inherent in OCT imaging, contributes as a noise. The prevalent existence of speckle noise in an OCT image makes it difficult to sparsify OCT images. However, various algorithms have been developed to reduce speckle noise and simultaneously compress the image [18]. Incorporation of such algorithms in CS may improve the outcome of the reconstruction.
CS involves random sampling of the k-space and therefore the obtained Fourier coefficients are essentially randomly distributed. As a result, fast algorithms developed for nonuniform Fourier transform can be more appropriate for CS than conventional FFT and IFFT, which were originally designed for equally-spaced signal samples [23].
When we used CS to reconstruct B-mode images from undersampled spectra, the spectral data were processed A-mode by A-mode; in other words, we used the sparsity within each A-scan. However, there is information redundancy between adjacent A-scans. Such redundancy is due to the fact that the spatial sampling rate is usually larger than the maximum spatial frequency determined by the lateral resolution of OCT system. In future studies, we plan to take full advantage of signal compressibility in both axial and lateral directions, which would allow high fidelity reconstruction with fewer sampling points.
It is noteworthy to mention that CS OCT inherently preserves phase coherence. The phase stability or accuracy of compressed SD OCT is an important issue especially when an accurate phase image needs to be recovered to detect sub-resolution motions and other functional features. It has been shown mathematically that both magnitude and phase of the image can be recovered accurately using compressed sensing. In order to verify that this is indeed a case for compressed OCT, we compared the phase images obtained from conventional OCT reconstruction using complete spectral data and CS OCT reconstruction using undersampled spectral data. Results show that the phase can be accurately recovered, essentially because CS OCT image is the solution of the optimization problem shown as Eq. (9), which promotes sparsity in image domain and preserve data consistency in measurement domain. During the optimization, complex valued CS OCT signal is iteratively transformed back to the measurement domain, sampled with the random mask (the result is denoted as Yu, which equals Fux), and compared with the originally undersampled spectrum, yu. The difference between Yu and yu, Δy = ||Fux- yu||2, has to be small enough for us to stop the iterations. A large Δα may not induce a significant change in the signal amplitude and thus the appearance of the image; however it will result in Yu to be a shifted version of yu, which leads to a large Δy and therefore violates the requirement of data consistency. Based on the above discussion, we come to a conclusion that CS OCT inherently preserve phase coherence.
In this paper, we randomly undersampled the spectra by applying a known random mask to the full pixel array to demonstrate the concept of compressed sensing in OCT. The results show great potential of this technique. However, one can achieve higher data acquisition speed through a more appropriate hardware implementation, which is a high-speed camera that undersamples the spectra randomly. Currently, it is true that an array detector with fewer pixels arranged randomly is not a cost-effective and a practical way to implement the compressed SD-OCT, but random undersampling can be achieved by selectively digitizing pixels of interest through low-level camera control, such as in Refs. [20] and [21]. Although the cost of such random accessible camera is more than a standard high speed CCD, it does improve the imaging speed.
6. Conclusion
In this work we introduced and studied the application of compressed sensing techniques in SD OCT. The sampling schemes and image reconstruction algorithms for CS SD OCT is compared with conventional SD OCT. We studied in detail the implementation of CS in SD OCT. We demonstrated and verified the effectiveness of CS in SD OCT by imaging a mirror as well as onion cells. Results showed that high fidelity OCT image reconstruction can be achieved through CS. By incoherent undersampling, it is possible to use fewer pixels in the spectral domain to achieve high axial resolution and large imaging depth simultaneously. This would increase data acquisition speed, and increase the image signal-to-noise ratio.
Acknowledgement
This work was supported in part by the NIH grants BRP 1R01 EB 007969-01, R21 1R21NS063131-01A1.
References and links
- 1.M. Brezinski, Optical Coherence Tomography: Principles and Applications, (Academic Press, London, 2006). [Google Scholar]
- 2.B. E. Bouma, and G. J. Tearney, Handbook of Optical Coherence Tomography, (Informa Healthcare, New York, 2001). [Google Scholar]
- 3.Sharma U., Fried N. M., Kang J. U., “All-fiber Fizeau optical coherence tomography: sensitivity optimization and system analysis,” IEEE J. Sel. Top. Quantum Electron. 11(4), 799–805 (2005). [Google Scholar]
- 4.Zhang K., Kang J. U., “Real-time 4D signal processing and visualization using graphics processing unit on a regular nonlinear-k Fourier-domain OCT system,” Opt. Express 18(11), 11772–11784 (2010), http://www.opticsinfobase.org/abstract.cfm?URI=oe-18-11-11772 [DOI] [PMC free article] [PubMed] [Google Scholar]
- 5.Kang J. U., Han J., Liu X., Zhang K., Song C., Gehlbach P., “Endoscopic Functional Fourier Domain Common Path Optical Coherence Tomography for Microsurgery,” IEEE J. Sel. Top. Quantum Electron. 16(4), 781–792 (2010). [DOI] [PMC free article] [PubMed] [Google Scholar]
- 6.Leitgeb R., Hitzenberger C., Fercher A., “Performance of fourier domain vs. time domain optical coherence tomography,” Opt. Express 11(8), 889–894 (2003), http://www.opticsinfobase.org/oe/abstract.cfm?URI=oe-11-8-889 [DOI] [PubMed] [Google Scholar]
- 7.Choma M., Sarunic M., Yang C., Izatt J., “Sensitivity advantage of swept source and Fourier domain optical coherence tomography,” Opt. Express 11(18), 2183–2189 (2003), http://www.opticsinfobase.org/abstract.cfm?URI=oe-11-18-2183 [DOI] [PubMed] [Google Scholar]
- 8.Liu X., Li X., Kim D., Ilev I., Kang J. U., “Fiber Optic Fourier-domain Common-path OCT,” Chin. Opt. Lett. 6(12), 899–903 (2008). [Google Scholar]
- 9.Grulkowski I., Gora M., Szkulmowski M., Gorczynska I., Szlag D., Marcos S., Kowalczyk A., Wojtkowski M., “Anterior segment imaging with Spectral OCT system using a high-speed CMOS camera,” Opt. Express 17(6), 4842–4858 (2009), http://www.opticsinfobase.org/abstract.cfm?URI=oe-17-6-4842 [DOI] [PubMed] [Google Scholar]
- 10.M. Balicki, J. Han, I. Iordachita, P. Gehlbach, J. Handa, J. U. Kang, and R. Taylor, “Single Fiber Optical Coherence Tomography Microsurgical Instruments for Computer and Robot-Assisted Retinal Surgery,” Proceedings of the MICCAI Conference (2009) [DOI] [PubMed] [Google Scholar]
- 11.Zhang K., Wang W., Han J., Kang J. U., “A surface topology and motion compensation system for microsurgery guidance and intervention based on common-path optical coherence tomography,” IEEE Trans. Biomed. Eng. 56(9), 2318–2321 (2009). [DOI] [PMC free article] [PubMed] [Google Scholar]
- 12.Donoho D. L., “Compressed Sensing,” IEEE Trans. Inf. Theory 52(4), 1289–1306 (2006). [Google Scholar]
- 13.Candes E., Romberg J., Tao T., “Robust uncertainty principles: Exact signal reconstruction from highly incomplete frequency information,” IEEE Trans. Inf. Theory 52(2), 489–509 (2006). [Google Scholar]
- 14.Lustig M., Donoho D., Pauly J. M., “Sparse MRI: The application of compressed sensing for rapid MR imaging,” Magn. Reson. Med. 58(6), 1182–1195 (2007). [DOI] [PubMed] [Google Scholar]
- 15.Guo Z., Li C., Song L., Wang L. V., “Compressed sensing in photoacoustic tomography in vivo,” J. Biomed. Opt. 15(2), 021311 (2010). [DOI] [PMC free article] [PubMed] [Google Scholar]
- 16.Mohan N., Stojanovic I., Karl W. C., Saleh B. E. A., Teich M. C., “Compressed sensing in optical coherence tomography,” Proc. SPIE 7570, 75700L (2010). [Google Scholar]
- 17.Mujat M., Park B. H., Cense B., Chen T. C., de Boer J. F., “Autocalibration of spectral-domain optical coherence tomography spectrometers for in vivo quantitative retinal nerve fiber layer birefringence determination,” J. Biomed. Opt. 12(4), 041205 (2007). [DOI] [PubMed] [Google Scholar]
- 18.Jian Z., Yu Z., Yu L., Rao B., Chen Z., Tromberg B. J., “Speckle attenuation in optical coherence tomography by curvelet shrinkage,” Opt. Lett. 34(10), 1516–1518 (2009). [DOI] [PMC free article] [PubMed] [Google Scholar]
- 19.J. Shewchuk, “An introduction to the conjugate gradient method without the agonizing pain,” Technical Report CMUCS-TR-94–125, Carnegie Mellon University, (1994).
- 20.Potter S. M., Mart A., Pine J., “High-speed CCD movie camera with random pixel selection for neurobiology research,” Proc. SPIE 2869, 243–253 (1997). [Google Scholar]
- 21.Monacos S. P., Lam R. K., Portillo A. A., Ortiz G. G., “Design of an event-driven random-access-windowing CCD-based camera,” Proc. SPIE 4975, 115 (2003). [Google Scholar]
- 22.Donoho D., Johnstone I., “Ideal spatial adaptation via wavelet shrinkage,” Biometrika 81(3), 425–455 (1994). [Google Scholar]
- 23.Fessler J. A., Sutton B. P., “Nonuniform fast Fourier transforms using min–max interpolation,” IEEE Trans. Signal Process. 51(2), 560–574 (2003). [Google Scholar]


