

Abstract
PEP-19 (Purkinje cell protein 4) is an intrinsically disordered protein with an IQ calmodulin (CaM) binding motif. Expression of PEP-19 was recently shown to protect cells from apoptosis and cell death due to Ca2+ overload. Our initial studies showed that PEP-19 causes novel and dramatic increases in the rates of Ca2+ association and dissociation from the C-domain of CaM. The goal of this work was to study interactions between C-domain of CaM (C-CaM) and PEP-19 by solution NMR to identify mechanisms by which PEP-19 regulates Ca2+ binding to CaM. Our results show that PEP-19 causes a greater structural change in apo C-CaM relative to Ca2+-C-CaM, and that the 1st Ca2+ binds preferentially to site IV in the presence of PEP-19 with exchange characteristics that are consistent with a decrease in Ca2+ binding cooperativity. Relatively weak binding of PEP-19 has distinct effects on chemical/conformational exchange on the μs-ms timescale. In apo C-CaM, PEP-19 binding causes a redistribution of residues that experience conformational exchange, leading to an increase in residues around Ca2+ binding site IV that undergo conformational exchange on μs-ms timescale. This appears to be due to an allosteric effect since these residues are not localized to the PEP-19 binding site. In contrast, PEP-19 increases the number of residues that exhibit conformational exchange in Ca2+-C-CaM. These residues are primarily localized to the PEP-19 binding site, but also include Asp93 in site III. These results provide working models for the role of protein dynamics in regulation of Ca2+ binding to CaM by PEP-19.
PEP-19 (Purkinje cell protein 4) is a small 6.7 kDa polypeptide that was initially identified in the central nervous system (CNS), but is now known to be present in a variety of other tissues (for review see (1–5)). PEP-19 has no known intrinsic activity other than binding to calmodulin (CaM) in the presence or absence of Ca2+ via an IQ CaM binding motif. This gives PEP-19 the potential to exert broad cellular effects as a regulator of CaM signaling. This idea is consistent with a general cytoprotective role for PEP-19 put forth based on the fact that Purkinje cells of the cerebellum and granule-cell neurons in the dentate gyrus, which have high levels of PEP-19, are largely spared from the effects of Alzheimer’s Disease, while PEP-19 negative cells are severely affected (6). Conversely, cell types that are most affected by Huntington’s disease exhibit a significant loss of expression of PEP-19 (7). Experimental studies also support a cytoprotective role for PEP-19 since expression of PEP-19 greatly inhibits cell death due to apoptosis (8, 9), or glutamate-induced Ca2+ cytotoxicity (9). Interestingly, PEP-19 is greatly increased in human leiomyoma versus matched myometrium (10), and high levels of PEP-19 are found in 58 of 60 NCI-60 tumor cell lines (11), even cells derived from tissues that express low or no PEP-19. This may be related to increased survival potential of transformed cells due to antiapoptotic effects of PEP-19. These observations support the idea that PEP-19 protects cells against apoptosis and Ca2+ cytotoxicity due to normal or pathogenic conditions, and would explain the need for high levels of PEP-19 in cells with highly active Ca2+ signaling systems.
The potential for PEP-19 to function as a regulator of CaM signaling led us to a series of studies to characterize its structural and biochemical properties, and its effects on CaM. We showed that PEP-19 binds relatively weakly, but selectively to the C-domain of CaM and has novel effects on the Ca2+ binding properties of CaM (12). Specifically, PEP-19 causes a 40-fold increase in the rates of association (kon) and dissociation (koff) of Ca2+ at C-domain of CaM, with little effect on Ca2+ binding affinity. Selective effects on the C-domain of CaM are important since the kon and koff for Ca2+ binding to the C-domain are up to 150-fold slower than for the N-domain, and represent a rate-limiting step for activation of Ca2+-dependent target proteins. We also showed that PEP-19 is intrinsically disordered, but with residual structure localized to an acidic/IQ motif that includes the IQ sequence and an adjacent acidic sequence (13). The core IQ motif is required for binding to CaM, but the acidic region is necessary to restrict binding to the C-domain, and for modulating Ca2+ binding to CaM (14).
The C-domain of CaM has intriguing dynamic properties that may act in synergy with the intrinsic disorder of PEP-19. Protein dynamics from NMR showed that the C-domain of CaM presents an ensemble of conformational states. The “open” conformation is dominant in the presence of Ca2+, and the “closed” conformation dominates in the apo state, but other minor populations of intermediate states exist (15–17). Akke and colleagues showed that the rate of Ca2+ exchange in the C-domain CaM is correlated with rates of chemical/conformational exchange (18). Thus, binding targets to CaM provides a mechanism for altering its Ca2+ binding properties by changing its dynamic properties and the populations of CaM conformers. For example, binding high-affinity targets to Ca2+-CaM, shifts the conformational equilibrium by stabilizing an “open-like” Ca2+-bound conformation, which greatly decreases koff (19). Based on these observations, we propose an inverse mechanism in which low affinity binding of intrinsically disordered PEP-19 modulates the slow dynamics of apo CaM and Ca2+-bound CaM to increase Ca2+ binding rate constants.
The present study provides experimental evidence to validate the above hypothesis by investigating the effects of PEP-19 on backbone dynamics of the isolated C-domain of CaM (C-CaM). In contrast to high-affinity CaM binding peptides, PEP-19 binding increases slow motions in the C-domain of CaM. In particular, residues located in Ca2+ binding sites in both apo- and Ca2+-bound forms undergo conformational exchange on us-ms timescale. This provides working models for the structural and dynamic basis for the effect of PEP-19 on the kinetics of Ca2+ binding to CaM.
MATERIALS AND METHODS
Protein purification
Recombinant CaM and PEP-19 were cloned, expressed in bacteria and purified as described previously (12, 13, 20, 21). A bacterial expression vector for C-CaM (residues 76–148) was kindly provided by Dr. Madeline Shea (U. Iowa). Proteins were decalcified by addition of 5 mM EGTA and 0.1 mM BAPTA followed by desalting on a Biorad P6DG or P2DG size exclusion column into a buffer that was decalcified by passage over a calcium-sponge column (Molecular Probes). Protein concentrations were estimated using an extinction coefficient of ε276nm = 0.18 ml−1/mg for CaM, and ε215nm= 0.59 ml−1/mg for PEP-19, or by using the BCA protein assay (Pierce). More precise concentrations of CaM and C-CaM were determined by measuring the amount of Ca2+ released from the C-domain of Ca2+-saturated proteins. Briefly, a solution of approximately 2 μM CaM or C-CaM and 30 μM Ca2+ was rapidly mixed with a solution of 300 μM of the Ca2+ sensitive dye, Quin-2, using a stopped flow fluorimeter to monitor the slow release of Ca2+ from the C-domain as described previously (12). The amount of Ca2+ released from the sample was determined by calibrating the fluorescence response with EGTA standards. This was then used to calculate the concentration of CaM or C-CaM.
Equilibrium Ca2+ titrations monitored by tyrosine fluorescence
Equilibrium Ca2+ binding constants for CaM and C-CaM in the presecnce or absence of PEP-19 were determined using tryosine fluoresence as described previously (22). Solutions containing 20 mM MOPS, pH 7.5, 100 mM KCl, 1 mM EGTA, 1 mM HEDTA, 1 mM NTA, 5 μM CaM or C-CaM with or without 30 μM PEP-19 were titrated with a Ca2+ stock to achieve a wide range of free Ca2+. The concentration of total Ca2+ needed to achieve a desired free Ca2+ concentration was determined using the online calculator MaxChelator (http://www.stanford.edu/~cpatton/maxc.html). The Ca2+ stock was prepared in the same buffer, including proteins, such that only the concentration of Ca2+ was changed during the titration. Tyrosine fluorescence intensity was plotted against the free Ca2+ concentration and fit to the following form of the Hill equation:
| (1) |
where [Ca2+] is the free Ca2+ concentration, F is the fluorescence intensity at a given free Ca2+ concentration, Fmin is the initial fluorescence intensity in the absence of added Ca2+, Fmax is the fluorescence at maximal Ca2+, kCa is the concentration of Ca2+ at which the change in fluorescence is half maximal and n is the Hill coefficient.
NMR methodology
All NMR experiments were performed on a Bruker DRX 600 MHz spectrometer equipped with a 5 mm triple-resonance cryoprobe at 298 K. NMR samples were prepared using decalcified proteins in a buffer containing 10 mM imidazole, 100 mM KCl and 5% D2O at pH 6.3. Samples used for relaxation measurements and backbone assignments contained 0.5 mM C-CaM uniformly labeled with 15N or 13C/15N, with or without 0.7 mM PEP-19. Excess EDTA or CaCl2 was added to maintain apo or Ca2+-bound states, respectively.
Backbone assignments for C-CaM/PEP-19 for apo and Ca2+-bound states were obtained using the following 3D experiments: HNCO, HNCA, HN(CO)CA, HNCACB, CBCA(CO)NH, 15N HSQC-TOCSY and 15N-edited NOESY-HSQC experiments. The 15N longitudinal (R1), transverse (R2) relaxation rate constants and heteronuclear [1H]-15N NOE were acquired using published pulse sequences (23). Experiments were recorded at delays of 20, 100, 200, 400, 600, 800, 1000, 1200, and 1400 ms for R1 measurements, and delays of 16.96, 33.92, 50.88, 67.84, 84.8, 118.72, 135.68, 152.64, and 169.6 ms for R2 measurements. [1H]-15N NOE values were measured from spectra with and without proton saturation recorded in an interleaved manner. Proton saturation was acquired using a 120° 1H pulse applied every 5.0 s. In the case of the NONOE spectra, a net relaxation delay of 5.0 s was employed, while a relaxation delay of 2.0 s prior to a 3.0 s proton presaturation period was employed for the NOE spectra.
All NMR spectra were processed and analyzed using Topspin 2.0 (Bruker) and FELIX 2004 (MSI, San Diego, CA). 1H chemical shifts were referenced to DSS (2,2-dimethyl-2-silapentane-5-sulphonate), and 15N/13C chemical shifts were referenced indirectly using their respective gyromagnetic ratios (24). The average amide chemical shift change (Δδavg) was calculated using the following equation:
| (2) |
Where Δδ H and Δδ N are the changes in 1H and 15N chemical shifts, respectively.
Analysis of relaxation data
Values for R1, R2 and their uncertainties were derived by plotting peak intensity versus delay time and fitting the data to a single exponential decay equation using non-linear least squares analysis. [1H]-15N NOE values were calculated from the ratios of peak intensities with and without presaturation. The standard deviation of the NOE was calculated from the root mean square value of the background noise in the spectra (23).
Reduced spectral density mapping was used to analyze the relaxation data (25, 26). Values for J(0), J(ωN), and
| (3) |
| (4) |
| (5) |
| (6) |
| (7) |
Where μ0 is the permeability of free space, h is Plank’s constant, γH and γN are the gyromagnetic ratios of 1H and 15N, respectively, rNH is the average N-H bond length (1.02 Å). Uncertainties in the spectral density parameters were estimated using 500 Monte Carlo simulations based on the uncertainties in the measured relaxation parameters.
Residue-specific rotational correlation times (τm) were estimated from the ratio of R2/R1 (27) (software r2r1_tm, A. G. Palmer III, Columbia University). Residues with R2/R1 ratios falling outside one standard deviation (SD) of the mean, as well as residues with NOE < 0.65, were excluded from the analysis (28).
RESULTS
C-CaM is a valid structural model for studying interactions between CaM and PEP-19
We showed previously that application of NMR to study the interactions between PEP-19 and apo CaM was severely limited since resonances for most backbone amides were broadened beyond detection in the apo CaM/PEP-19 complex (13). This was not due to the interaction of PEP-19 with the N-domain of CaM since amide chemical shifts in the N-domain are unaffected by PEP-19 binding (see Supplemental Figure 1). We felt that use of the isolated C-domain of CaM (C-CaM) may overcome this limitation due to different rotational correlation times (time)or other factors relative to intact CaM. This strategy was justified based on previous studies showing that the isolated C-domain of CaM (C-CaM) retains the biochemical properties of the intact protein (29–32). In addition, we showed that PEP-19 binds preferentially to the C-domain of CaM in the absence or presence of Ca2+, and that PEP-19 has the same effects on the Ca2+ koff rate of both C-CaM and intact CaM (13, 14). Thus, the initial goal of the current study was to determine if amide resonances in apo C-CaM can be observed upon binding PEP-19. Indeed, addition of PEP-19 to apo C-CaM allowed observation of slow, two-state exchange for most amides. Backbone assignments for apo C-CaM bound to PEP-19 were obtained by HNCA, HN(CO)CA, HNCACB, CBCA(CO)NH, 15N HSQC-TOCSY and 15N-edited NOESY-HSQC experiments. All backbone amides were assigned except for Asp131 and Gly134, which are undetectable due to line broadening.
We next determined if C-CaM provided a good structural mimic of the C-domain from intact CaM in the absence of PEP-19. Supplemental Figure 2 compares the 1H-15N HSQC spectra of C-CaM versus intact CaM in the presence and absence of Ca2+. The spectra of C-CaM are greatly simplified due to the absence of amide cross peaks from residues in the N-domain of CaM. As expected, amide chemical shifts for residues at the N-terminus of C-CaM, including the N-terminal portion of helix E, exhibit greater average amide chemical shift differences (Δδavg) relative to CaM due to lack of influence from the tethered N-domain (see Supplemental Figure 3). However, average Δδavg for residues 88–148 of C-CaM and intact CaM are 0.014 and 0.012 in the absence and presence of Ca2+, respectively, which are within the error of these measurements and calculations. In addition, the secondary structures of C-CaM and the C-domain of intact CaM are in excellent agreement in the presence and absence of Ca2+ as determined by 13Cα secondary chemical shifts, 1H-15N NOESY-HSQC, 3JHAHA, and the Chemical Shift Index (see Supplemental Table 1).
We next compared 1H-15N HSQC spectra for Ca2+-bound C-CaM versus intact CaM at increasing concentrations of PEP-19 at 298 K. Residues in the N-domain of CaM are not affected by PEP-19 binding and most resonances in Ca2+-bound C-CaM exhibit characteristics of fast to intermediate exchange when titrated with PEP-19. This allowed assignments of backbone amides by following the movement of cross peaks. Assignments were then verified by 1H, 15N NOESY-HSQC. All residues were assigned except for Thr110, Asn111, Gly113, Glu114, and Lys115, due to severe resonance line broadening. Supplemental Figure 4 shows that all amide cross peaks for Ca2+-C-CaM bound to PEP-19 superimpose on resonances associated with the C-domain of intact CaM bound to PEP-19 except residues 78 to 82 at the N-terminus of C-CaM. Thus, binding PEP-19 induces similar conformations in the Ca2+-bound forms of both C-CaM and the C-domain of intact CaM. Together, supplemental Figures 1 to 4 demonstrate that C-CaM is a valid structural model for the study of interactions between CaM and PEP-19 in the presence or absence of Ca2+.
Characteristics of slow and fast exchange on the NMR time scale for C-CaM amide resonances during titration with PEP-19 in the absence and presence of Ca2+, respectively, are consistent with the kinetics of binding PEP-19. Observed exchange characteristics are dependent on the relationship between chemical exchange (kex) and the difference in frequency for amide resonances between the bound and free states (Δω). Fast exchange is observed if kex > Δω, while slow exchange is seen if kex < Δω Based on this, we can conclude that kex > 150 s−1 in the presence of Ca2+, and kex < 20 s−1 in the absence of Ca2+. The kex will be largely determined by koff during titration of C-CaM with PEP-19 since kex = [PEP-19]free*kon + koff, and [PEP-19]free will be very low until its total level exceeds that of C-CaM in the NMR sample. Thus, the above partial limits of kex based on Δω are reasonable since we know that koff values are 400 s−1 and 5 s−1 for binding PEP-19 to CaM in the presence and absence of Ca2+, respectively (13, 14).
PEP-19 has a greater effect on the structure of apo versus Ca2+-bound C-CaM
Black bars in Figure 1A show that binding PEP-19 causes relatively small Δδavg in Ca2+-C-CaM at 298 K (see Supplemental Figure 5A for complete spectra). The largest values of Δδavg are seen for residues Met144 to Lys148 at the C-terminus, while amide resonances for residues Thr110 to Lys115 in the linker between sites III and IV are broadened beyond detection upon binding PEP-19. Experiments performed previously at 320 K with intact Ca2+-CaM (14) showed very similar patterns of Δδavg (see grey bars in Figure 1A), except that resonances for residues Thr110 to Lys115 were observed. This temperature dependence indicates that significant conformational exchange occurs on the μs-ms timescale for residues at the end of helix F and the linker between helices F and G of Ca2+-CaM when bound to PEP-19.
Figure 1. Effect of PEP-19 on C-CaM amides in the absence and presence of Ca2+.

(A) Amide chemical shift perturbations (Δδavg) for Ca2+-bound C-CaM at 298 K are shown by black bars. Grey bars show Δδavg that result from binding PEP-19 to the C-domain of intact Ca2+-CaM at 320 K (14). Asterisks denote resonances with significant line-broadening in the presence of PEP-19. (B) Δδavg for apo C-CaM at 298 K. Panels (C) and (D) map residues with Δδavg >0.2 ppm on the solvent accessible surfaces of Ca2+-CaM (pdb:1J7P) and apo-C-CaM (pdb:1F71), respectively. The structures are presented in the same relative orientation. The diagram below panel B shows the relative positions of the helices E to H in the primary sequence of CaM. The 12 amino acids Ca2+ binding sites III and IV are also shown in grey. Coil, β-strand and α-helical portions of these structures are indicated by loops, arrows, and boxes, respectively.
Figure 1B shows that binding PEP-19 causes much greater Δδavg in apo C-CaM compared to Ca2+-bound C-CaM. Similar to Ca2+-C-CaM, residues with the largest Δδavg in apo C-CaM are localized to helix F and the linker between helices F and G, but changes are also seen for residues 101–103 at the transition between β-strand and helical structures in Ca2+ binding site III. Figure 1C and D illustrate the binding interface between C-CaM and PEP-19 in the absence and presence of Ca2+ based on residues with Δδavg>0.2 ppm.
Experiments were performed to determine if apo and Ca2+-bound C-CaM have different secondary structures when bound to PEP-19 that could account for different magnitudes and patterns of chemical shift changes in Figures 1A and 1B. Supplemental Figure 6 and Supplemental Table 1 show that secondary structures in the C-domain of CaM are essentially identical in the presence and absence of Ca2+ or PEP-19. Moreover, the antiparallel β-sheet between loops III and IV in apo and Ca2+-bound C-CaM remain intact when bound to PEP-19 based on the presence of long-range NOEs (dNN) between Ile100 and Val136 (data not shown). The largest difference in secondary structure is observed for helix F, which terminates at Val108 in apo C-CaM when bound to PEP-19, but extends to Asn111 under all other conditions. These data, together with Figure 1, suggest that Ca2+-bound C-CaM remains predominantly in an “open-like” conformation in the presence of PEP-19, but that binding PEP-19 may alter interhelical angles in apo C-CaM.
Effect of PEP-19 on Ca2+ binding cooperativity of C-CaM
We showed previously that PEP-19 increased Ca2+ koff and kon rates, and decreased the cooperativity of Ca2+ binding to the C-domain of intact CaM with out greatly affecting the Kd (14). Specifically, the macroscopic Ca2+ dissociation constants for the C-domain of CaM are Kd1 = 17 μM and Kd2 = 0.4 μM. This indicates positive cooperativity since Kd1 > 4Kd2, with a change in free energy due to cooperativity (ΔΔ Gc) of −3.4 kcal/mole. In the presence of PEP-19, Kd1 = 4.7 μM and Kd2 =2.0 μM, respectively, which demonstrates a significant loss of cooperativity, with ΔΔ Gc = −1.3 kcal/mole. Despite these changes in macroscopic binding constants and cooperativity, the overall Kds for binding Ca2+ to the C-domain are very similar in the presence or absence of PEP-19. We also showed that PEP-19 increased, the Ca2+ koff rate of isolated C-CaM (14). Figure 2 uses fluorescence from Tyr99 and Tyr138 to show that PEP-19 also decreases the cooperativity of Ca2+ binding to C-CaM as indicated by a decreased Hill coefficient in the presence of PEP-19, but does not greatly affect the Kd for Ca2+ binding. Thus, the effects of PEP-19 on the C-domain of intact CaM are also seen for C-CaM.
Figure 2. Effect of PEP-19 on the Ca2+ binding constant (Kca) and Hill coefficient (n).

Intrinsic tyrosine fluorescence was monitored during titration of CaM (○), CaM+PEP-19 (□), C-CaM (●), and C-CaM/PEP-19 (■) with Ca2+. The lines show fits of the data to the Hill equation (Eq.1).
To identify potential structural manifestations of decreased cooperativity, amide chemical shifts were monitored by a series of 1H-15N HSQC spectra collected during titration of C-CaM with Ca2+ in the absence or presence of PEP-19 at 298 K. Figure 3 uses Thr117 to demonstrate slow two-state exchange observed for amides resonances in the absence of PEP-19. At intermediate levels of Ca2+ (Figure 3B and Figure 3C), resonances for both 0-Ca2+ and 2-Ca2+ forms are observed with relative intensities that are proportional to their populations. No evidence for the 1-Ca2+ form is observed at intermediate Ca2+ levels in the absence of PEP-19, indicating highly cooperative Ca2+ binding.
Figure 3. Ca2+ -dependent changes in amide chemical shifts of C-CaM show strong cooperativity.

Resonance of Thr117 in the linker region of C-CaM exhibited two-state slow exchange at various molar ratio of Ca2+ added into C-CaM, indicating highly cooperative Ca2+ binding to sites III and IV. (A) [Ca2+]/[C-CaM]=0; (B) [Ca2+]/[C-CaM]=0.3; (C) [Ca2+]/[C-CaM]=0.6; (D) [Ca2+]/[C-CaM]=2.0.
Figure 4 shows that fast to intermediate exchange on the NMR chemical timescale is observed upon titration of C-CaM with Ca2+ in the presence of PEP-19. Peaks corresponding to residues in Ca2+ binding sites III and IV, and helices E and F have large Ca2+-dependent changes in amide chemical shifts that could not be detected at intermediate Ca2+ titration points due to line broadening. However, residues such as Thr117 that experience smaller overall Ca2+-dependent amide chemical shift changes, could be observed at all Ca2+ levels. The NMR spectral characteristics for Thr117 in Figure 4A show resonance line broadening and splitting into multiple peaks at low Ca2+ levels, indicating rapid exchange between multiple conformations. Moreover, during titration with Ca2+, Thr117 exhibits a biphasic change with an upfield shift in the 1H dimension between Ca2+/C-CaM ratios of 0 and 1.0, and then a downfield shift in the 15N dimension at Ca2+/C-CaM ratios between 1.0 and 2.0. These data are consistent with decreased cooperativity of Ca2+ binding in the presence of PEP-19 that results in significant populations of the 1-Ca2+ form of C-CaM at substoichiometric levels of Ca2+.
Figure 4. Ca2+ -dependent changes in amide chemical shifts of C-CaM in the presence of PEP-19 show decreased cooperativity.

Various ratios of [Ca2+]/[C-CaM] between 0 and 2.0 are indicated. Exchange characteristics for Thr117 shown in Panel (A) indicate lower degree of cooperativity of Ca2+ binding in the presence of PEP-19. Exchange characteristics for Gly98 in Ca2+ binding site III and Gly134 in the Ca2+ binding site IV shown in Panel (B) indicates preferential binding of the 1st Ca2+ to site IV.
Gly98 and Gly134 at the sixth position of loops III and IV, respectively, were selected to provide information on the sequential nature of Ca2+ binding to C-CaM in the presence of PEP-19. These glycines provide markers for Ca2+ binding since they facilitate the unusual main chain conformation that allows the Ca2+ ligands to take up coordinating positions (33). The large differences in amide chemical shifts of Gly98 and Gly134 between apo and Ca2+-bound forms lead to severe resonance broadening at intermediate Ca2+ levels. However, Figure 4B shows that the change in chemical shift for Gly134 is maximal at a Ca2+/C-CaM ratio of around 1.0, while the change in chemical shift for Gly98 is not maximal until a Ca2+/C-CaM ratio of 2.0. These data indicate that PEP-19 promotes preferential binding of the first Ca2+ to site IV. However, Figure 4B shows that Gly98 in site III experiences minor conformational change upon binding the first Ca2+ to site IV, and binding the second Ca2+ to site III sharpens the line width of Gly134 in site IV. The simplest interpretation of these data is that PEP-19 decreases, but does not eliminate cooperativity between sites III and IV.
Effects of PEP-19 on the backbone dynamics of C-CaM
To better understand the effects of PEP-19 on backbone dynamics in C-CaM, 15N relaxation experiments for apo and Ca2+-bound C-CaM were collected in the absence or presence of PEP-19. The [1H]-15N NOE is typically most sensitive to motions on the ps –ns timescale, with values near 1.0 indicating a lack of such motions, and lower values indicating increasing local flexibility of the polypeptide. Similar to previous reports (15, 17, 34), Figure 5A and 5F show significant reductions in NOE values for residues at the N- and C- terminus of C-CaM in the presence or absence of Ca2+. The two Ca2+ binding loops and the linker between helix F and helix G also show lower NOE values. Binding PEP-19 had no significant effect on NOE values for apo- or Ca2+-bound C-CaM (see Table 1). This confirms the results in Supplemental Table 1 showing that C-CaM/PEP-19 complexes have well-defined backbone structures.
Figure 5. Backbone 15N relaxation parameters for apo C-CaM, apo C-CaM/PEP-19, Ca2+-bound C-CaM and Ca2+-bound C-CaM/PEP-19.

R1, R2, [1H]-15N NOE, R2R1 products and R2/R1 ratios are shown for apo- and Ca2+-C-CaM in the absence (open circles) and presence (closed circles) of PEP-19. The dashed (with out PEP-19) and solid lines (with PEP-19) in Panels C, D, G and H indicate the mean +1.0 SD. Asterisks denote resonances with significant line-broadening in the presence of PEP-19.
Table 1.
Summary of R1, R2, NOE, R1R2, R2/R1, τm, J(0), J(ωN), and J(ωH)
| Protein |
15N relaxation parameters |
R1R2 | R2/R1 | τm | reduced spectral density mapping |
||||
|---|---|---|---|---|---|---|---|---|---|
| R1 | R2 | NOE | J(0) | J(ωN) | J(ωH) | ||||
| s−1 | s−1 | ns | ns/rad | ns/rad | ns/rad | ||||
| Apo C-CaM | 2.14±0.13 | 7.6±2.2 | 0.67±0.16 | 16.3±5.2 | 3.51±0.96 | 4.83±0.46 | 1.88±0.64 | 0.40±0.03 | 0.011±0.004 |
| Apo C-CaM +PEP-19 | 1.58±0.085 | 12.5±3.2 | 0.70±0.17 | 19.7±5.2 | 7.93±2.00 | 8.33±0.66 | 3.40±0.92 | 0.29±0.017 | 0.008±0.004 |
| Ca2+ C-CaM | 2.09±0.17 | 7.1±1.0 | 0.68±0.19 | 14.8±2.7 | 3.36±0.33 | 4.81±0.19 | 1.74±0.26 | 0.39±0.04 | 0.010±0.005 |
| Ca2+ C-CaM +PEP-19 | 1.56±0.091 | 12.2±2.5 | 0.70±0.18 | 18.9±4.1 | 7.82±1.60 | 8.38±0.37 | 3.08±0.79 | 0.29±0.014 | 0.009±0.007 |
Figure 5 and Table 1 show that binding PEP-19 to C-CaM causes an overall decrease in R1, and an increase in R2 in the presence or absence of Ca2+. A molecular rotational correlation time (τm) of 4.8 ns is estimated from R2/R1 ratios for free apo and Ca2+-bound C-CaM (see Table 1). This is consistent with the τm of 4.9 ns determined by Malmendal et al. (15) for apo C-CaM using the mean ηxy/ηz ratio and Model-Free analysis. The estimated τm for C-CaM is increased to 8.3 ns when bound to PEP-19 in the presence or absence of Ca2+. The τm ratio of 1.73 for PEP-19/C-CaM versus free C-CaM is comparable their molecular weight ratio of 1.77, which suggests that the complexes are close to globular in shape. Residues with unusually high R2/R1 ratios relative to the average indicate regions that undergo conformational exchange processes on the μs-ms timescale (35). The R1R2 product is an effective discriminator of motional anisotropy and chemical/conformational exchange (36). Figure 5D and 5I show the R2R1 product, and Figures 5E and 5J show R2/R1 ratios for residues in apo and Ca2+-bound C-CaM in the presence or absence of PEP-19. Table 2 lists residues with R2/R1 and R1R2 values that are both greater than 1SD relative to the average.
Table 2.
Summary of Residues that Undergo Conformational Exchange on the μs-ms Timescale
| Protein | R2/R1 | R2R1 | Reduced Spectral Density Mapping | Exchange Broadening | ||||
|---|---|---|---|---|---|---|---|---|
| Apo C-CaM |
Glu87 Arg90 Phe92 Ile100 |
Met109 Thr110 Asp131 Glu139 |
Glu87 Arg90 Phe92 Ile100 |
Met109 Thr110 Asp131 Glu139 |
Glu87 Arg90 Phe92 Ile100 |
Met109 Thr110 Asp131 Glu139 |
||
| Apo C-CaM +PEP-19 |
Ala102 Thr110 Glu114 Ile125 Glu127 |
Ala128 Gly132 Val136 Glu139 |
Ala102 Thr110 Glu114 Asp122 Ile125 Arg126 |
Glu127 Ala128 Gly132 Val136 Glu139 |
Ala102 Thr110 Glu114 Ile125 Glu127 |
Ala128 Gly132 Val136 Glu139 |
Asp131 Gly134 |
|
| Ca2+-C-CaM | Asp93 Glu104 His107 Met109 |
Leu112 Gly113 Ile130 |
Ser101 Glu104 His107 |
Met109 Leu112 |
Glu104 His107 |
Leu112 Met 109 |
||
| Ca2+-C-CaM +PEP-19 |
Asp93 Met109 Leu116 |
Thr117 Val121 Thr146 |
Asp93 Met109 Leu116 Thr117 |
Val121 Gln143 Thr146 |
Asp93 Met109 Leu116 |
Thr117 Val121 Thr146 |
Thr 110 Asn111 Gly 113 |
Glu114 Lys115 |
Residues exhibiting conformational exchange on the μs-ms timescale by all criteria are shown in bold.
The Model-Free approach to predict residues with Rex was not used since 3D structures of C-CaM/PEP-19 complexes are not available, and isotropic conditions cannot be assumed. Instead, the relaxation data were further analyzed using reduced spectral density mapping. The advantage of this approach lies in the absence of assumptions made a priori regarding internal motions and molecular tumbling (25, 26). Reduced spectral density mapping assumes that the high- frequency spectral density terms are approximately equal in magnitude (i.e. J(ωH±ωN) ≈ J(ωH)) and therefore may be replaced by a single value, J(ωH). Reduced spectral density terms J(ωH), J(ωN) and J(0) were calculated according to Eqs. (3)–(7) (see Materials and Methods) for apo and Ca2+-bound C-CaM in the presence and absence of PEP-19, as summarized in Table 1 and Figure 6. J(ωH) is correlated with fast internal motion of N-H bond vectors on the ps-ns timescale. Since the value of the area under J(ω) curve is constant, highly flexible segments of the backbone are characterized by high J(ωH) values and low values of J(0) and J(ωN). This is observed for the N- and C-termini, and the linker between helices F and G of C-CaM. Figure 6A and D show that PEP-19 has relatively little effect on J(ωH) for residues in C-CaM in the presence or absence of Ca2+. This indicates little effect of PEP-19 on backbone dynamics of C-CaM on ps-ns timescale, and is consistent with a lack of effect of PEP-19 on heteronuclear NOEs.
Figure 6. Reduced spectral density mapping for apo C-CaM, apo C-CaM/PEP-19, Ca2+-bound C-CaM and Ca2+-bound C-CaM/PEP-19.

Reduced spectral density parameters were calculated using Eq. (3) to Eq. (7). J(ωH), J(ωN), and J(0) are shown for apo- and Ca2+-C-CaM in the absence (open circles) and presence (closed circles) of PEP-19. The mean +1.0 SD of J(0) for apo and Ca2+-bound C-CaM in the absence and presence of PEP-19 is indicated by dash and solid line, respectively. Asterisks denote resonances with significant line-broadening in the presence of PEP-19.
An increase in molecular weight due to complex formation will globally increase J(0), however, residues with unusually high J(0) values relative to the average in a given protein or complex indicates significant chemical/conformational exchange on the μs- ms timescale due to contributions from Rex on R2 (25, 26, 37). Figure 7 shows residues in C-CaM with J(0) values that are increased relative to the average J(0) based on the expression (J(0)–J(0)avg)/SD. For example, Figure 7A shows that J(0) values are increased by more than 1 SD relative to J(0)avg for Arg90, Phe92, Tyr99, Ile100, Thr110, Asp131, and Glu139. These same residues were shown by Malmendal et al. (15) to have the greatest Rex based on Model-Free analysis. Interestingly, Figure 7 shows that binding PEP-19 causes large variations in J(0) for residues in C-CaM in the presence or absence of Ca2+. Residues in Table 2 that are highlighted in bold exhibit conformational exchange based on severe line width broadening., or J(0), R2/R1, and R1R2 values that are all greater than one SD from the average.
Figure 7. Identification of residues exhibiting conformational exchange on the μs –ms timescale in PEP-19-bound apo C-CaM and Ca2+-C-CaM based on reduced spectral density mapping.

Values on the Y-axis are calculated by (J(0)i – J(0)avg)/SD. Residues with (J(0)i – J(0)avg)/SD >1.0 are considered to undergo significant chemical/conformational exchange. Asterisks indicate residues with extreme line broadening.
DISCUSSION
Calmodulin is an essential and versatile Ca2+-sensor capable of interacting with numerous target proteins, however, its intrinsic biochemical properties become limiting in cells that have very rapid Ca2+ oscillations, high total Ca2+ levels, numerous CaM binding proteins and limiting levels of CaM. This explains the need for proteins that can act as regulators of CaM signaling, or RCS proteins, to allow CaM to respond to diverse Ca2+ signals and achieve its wide array of known activities. We showed that the small neuronal IQ-motif proteins PEP-19 (62 a.a.) and RC3 (78 a.a.) modulate the Ca2+ binding properties of CaM (12, 38). Another small neuronal protein called ARPP-21 (88 a.a.) was shown to inhibit CaM binding to target proteins (39). These activities could exert broad effects on cell activities. Indeed, ARPP-21 regulates Ca2+-channel activity in mammalian brain, and RC3 plays a role in learning and memory (39–45). PEP-19 is thought to have cytoprotective activity based on its pattern of expression in cells that are affected by Alzheimer’s (6) and Huntington’s diseases (7), and expression of PEP-19 inhibits apoptosis and cell death due to Ca2+ overload (8, 9). PEP-19 is of particular interest since it is expressed in non-neuronal tissues including endocrine, reproductive, and urinary organs that have highly active Ca2+ dynamics (46).
Diverse effects on essential cellular activities highlight the biological significance of PEP-19, ARPP-21 and RC3, and the need to understand their mechanisms of action. We showed previously that PEP-19 greatly increased the kon and koff rates for Ca2+ binding to the C-domain of CaM, with no change of apparent Ca2+ binding affinity (12), and that it decreased the cooperativity of Ca2+ binding (14). Changes in the cooperativity and kinetics of Ca2+ binding could result from static or dynamic properties of the CaM/PEP-19 complex. Dynamic properties are of particular interest since it is well-known that protein motions on the μs-ms timescale are often coupled with protein function (47–50), and the rate of Ca2+ exchange in the C-domain of CaM is correlated with rates of protein conformational exchange (15, 18, 51). The disordered nature of PEP-19 is significant since it could form so-called “Fuzzy” complexes (52), in which bound PEP-19 remains partially disordered to induce conformational exchange in CaM, and since disordered regions in proteins have been shown to enhance allosteric effects (53). These relationships led us to characterize the effect of PEP-19 on backbone dynamics of C-CaM, and to provide the experimental evidence for changes in cooperative Ca2+ binding at the atomic level.
It is well established that the C-domain of CaM binds 2 Ca2+ with a high degree of cooperativity (12, 31, 54–56). Figure 3 shows that this cooperativity results in apparent slow exchange of amide resonances during titration with Ca2+ such that cross peaks for only the 0-Ca2+ and 2-Ca2+ forms are observed at all Ca2+/C-CaM ratios. In contrast, intermediate exchange is observed when C-CaM is titrated with Ca2+ in the presence of PEP-19, resulting in severe broadening of most amide cross peaks at intermediate Ca2+ levels. Amides for residues in the linker region between Ca2+ binding sites III and IV, and near the N- and C-termini are observed at lower contour levels at all Ca2+/C-CaM ratios, and many of these residues, including Thr117 shown in Figure 4, exhibit a shift in the direction of the resonance migration at [Ca2+]/[C-CaM] > 1.0. The simplest explanation for this is that PEP-19 decreases the cooperativity of Ca2+ binding to C-CaM, which allows a significant population of 1-Ca2+ form of PEP-19/C-CaM complex to accumulate at low Ca2+ levels. The effects of Ca2+ on amide cross peaks for Gly98 in Ca2+ binding site III and Gly134 in Ca2+ binding site IV indicate that Ca2+ binds preferentially to site IV in the presence of PEP-19. This Ca2+ binding preference is generally consistent with Malmendal et al. (15) who concluded that Ca2+ binds preferentially to site IV of unmodified free CaM at very low Ca2+ levels. Decreased cooperativity may be intrinsically linked to the effects of PEP-19 on Ca2+ kon and koff rates based on a mathematical model in which binding the first Ca2+ ion to either site III or IV is characterized by fast rate constants, while binding the second Ca2+ occurs with much slower rates due to cooperative effects (14). This implies that attenuation of cooperativity by PEP-19 will increase Ca2+ binding rate constants by allowing greater expression of rapid rates associated with independent binding to site III or IV.
We used several criteria to identify residues in apo and Ca2+-bound C-CaM that experience conformational/chemical exchange (Rex) in the presence or absence of PEP-19. Residues indicated by bold lettering in Table 2 are those that experience severe exchange broadening, or that show significant conformational exchange based on high J(0) values from reduced spectral density mapping, as well as high values for R2/R1 and R1R2. Figure 8A shows that residues with significant Rex in apo C-CaM bound to PEP-19 are localized to Ca2+-binding loop IV and the short β-strands between loops III and IV. In contrast, Figure 8B shows that residues 109 to 117 in helix F and the linker between helices F and G of Ca2+-C-CaM show conformational exchange in the presence of PEP-19. This pattern of residues with Rex differs from the effect of a peptide from transcription factor SEF2-1, which induces Rex primarily in residues 142–147 at the C-terminus of Ca2+-CaM (57). It also differs from the effect of binding a CaMKI peptide to Ca2+-CaM, which causes relatively small Rex in residues 102, 105–107 and 109 (58).
Figure 8. Summary of residues that exhibit significant conformational exchange for apo and Ca2+-bound C-CaM in the presence of PEP-19.
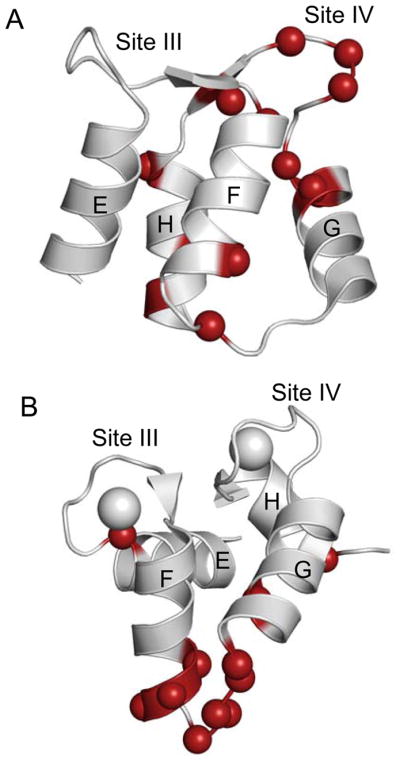
Panels (A) and (B) show the NMR solution structures for apo (pdb: 1F71) and Ca2+-bound C-domain of CaM (pdb: 1J7P), respectively. Colored balls indicate residues that exhibit significant conformational exchange, and are shown by bold lettering in Table 2.
The pattern of residues with Rex, and the kon and koff rates for binding PEP-19 to CaM, suggest that conformational exchange is derived from different mechanisms for apo and Ca2+-bound C-CaM. Residues with Rex in the apo C-CaM/PEP-19 complex are primarily localized to Ca2+ binding site IV, however, this does not correspond to the PEP-19 binding site, which is localized primarily to residues 108–117 based on amide chemical shift mapping shown in Figure 1. This suggests that Rex is not due to intermolecular chemical exchange between apo C-CaM and PEP-19, but to intramolecular conformational exchange within the apo CaM/PEP-19 complex. This is consistent with kon and koff rates of 1 μM−1s−1 and 5.6 s−1, respectively, for binding PEP-19 to apo CaM (13). Under conditions used for relaxation measurements, these rates give an estimated kex for intermolecular chemical exchange of about 200 s−1, which is at the limit of the time frame that would give rise to Rex. On the other hand, kon and koff rates for binding PEP-19 to Ca2+-CaM are least 20 μM−1s−1 and 400 s−1, respectively (13) These rates give a kex of least 4,500 s−1, which is well within the range that would give rise to Rex. In addition, residues with Rex in the Ca2+-C-CaM/PEP-19 complex are localized to the PEP-19 binding site. This suggests that conformational exchange induced by PEP-19 in Ca2+-bound C-CaM is due to intermolecular chemical exchange.
The effects of PEP-19 on the cooperativity and kon and koff rates of Ca2+ binding to CaM may involve residues that experience conformational exchange on the slow timescale. The structural basis for cooperativity Ca2+ binding is primarily associated with two structural features of paired EF hands. The first is the antiparallel β-sheet formed between short β-strands in Ca2+ binding sites III and IV. This structure is also formed in other paired EF-hands, and was proposed as a conduit that transmits structural changes between Ca2+ binding sites in calbindin D9k (59). Residues in the β-sheet region of apo C-CaM, but not Ca2+-C-CaM, show increased Rex when bound to PEP-19, including Ala102 in the strand/helix junction of Ca2+ binding loop III, and a cluster of residues across EF-hand IV. This supports a model in which PEP-19 increases the Ca2+ kon rate by inducing conformational fluctuations in regions that lead to decreased Ca2+ binding cooperativity and preferential binding of Ca2+ to site IV. The second structural feature is the polypeptide linker between helix F of Ca2+-binding site III and helix G in site IV of CaM. This strong covalent coupling would transmit conformational changes when the first Ca2+ binds to either site III or IV (60). PEP-19 induces Rex for residues in this region of Ca2+-bound, but not apo C-CaM, which may reflect coupling between protein dynamics and the Ca2+ koff rate. Another potential mechanism for increasing the Ca2+ koff rate involves Asp93, which has increased Rex in Ca2+-bound C-CaM in the presence of PEP-19. The side chain carboxyl group of Asp93 contributes the +X ligand for coordination of Ca2+ at site III, and also forms a hydrogen bond with Phe89 (Asp93HN→Phe89C′) (61) that stabilizes the otherwise unfavorably close proximity of the negatively charged oxygen atoms in the co-ordination sphere of the bound Ca2+. Conformational exchange at Asp93 in the presence of PEP-19 may increase the Ca2+ koff rate.
In summary, the results presented here fill a gap in our understanding of how binding to proteins affects dynamic processes in CaM, by characterizing the effects of an intact, intrinsically disordered protein that binds with relatively low affinity but selectively to the C-domain of CaM in the presence or absence of Ca2+. Binding PEP-19 has no effect on CaM backbone dynamics on the fast ns-ps timescale, but increases conformational exchange on the slow μs-ms timescale, and patterns of residues that exhibit conformational exchange differ significantly for apo versus Ca2+-CaM. The data provide structural and dynamic evidence to support models in which PEP-19 decreases the degree of Ca2+ binding cooperativity in the C-domain of CaM and accelerates Ca2+ kon and koff rates with no change of apparent Ca2+ binding affinity.
Supplementary Material
Supplemental Table 1: Comparison of secondary structures for the C-domain of free and PEP-19 bound CaM.
Supplemental Figure 1: Binding PEP-19 to apo-CaM causes significant resonance line broadening for residues in the C-domain.
Supplemental Figure 2: Comparison of 1H, 15N HSQC spectra of C-CaM and intact CaM in the absence and presence of Ca2+.
Supplemental Figure 3: Plot of amide chemical shift differences (Δδavg) as a function of residue number for C-CaM and the C-domain of intact CaM in the absence and presence of Ca2+.
Supplemental Figure 4: Comparison of 1H, 15N HSQC spectra of Ca2+-bound C-CaM and intact Ca2+-bound CaM in the presence of excess PEP-19 at 298 K.
Supplemental Figure 5: Structural perturbations of C-CaM induced by PEP-19 binding at 298K.
Supplemental Figure 6: Identification of secondary structures for Ca2+-bound intact CaM/PEP-19.
Acknowledgments
This work was supported in part by training fellowships from the Keck Center Nanobiology Training Program of the Gulf Coast Consortia (NIH Grant No. R90 DK071504), and the American Heart Association, South Central Affiliate (10POST3110010), and by grants from the Welch Foundation (AU-1144), the NIH (R01 GM069611), and the American Heart Association, South Central Affiliate (GRNT2280427).
Abbreviations
- CaM
calmodulin
- C-CaM
isolated C-domain of CaM
- EDTA
2,2′,2″,2‴-(ethane-1,2-diyldinitrilo)tetraacetic acid
- EGTA
ethylene glycol-bis(2-aminoethylether)-N,N,N′,N′-tetraacetic acid
- HEDTA
N′-(2-hydroxyethyl)ethylenediamine-N,N,N′-triacetic acid
- NTA
nitrilotriacetic acid
- DSS
2,2-dimethyl-2-silapentane-5-sulphonate
- 3D
three-dimensional
- HSQC
heteronuclear single-quantum coherence spectroscopy
- R1
longitudinal relaxation rate constant
- R2
transverse relaxation rate constant
- NOE
Nuclear Overhauser effect
- SD
standard deviation
- Δδ avg
average amide chemical shift change
- τm
rotational correlation time
- Rex
chemical/conformational exchange
Footnotes
This material is available free of charge via the Internet at http://pubs.acs.org
References
- 1.Rhoads A, Bahler M. Calmodulin signaling via the IQ motif. FEBS Lett. 2002;513:107–113. doi: 10.1016/s0014-5793(01)03239-2. [DOI] [PubMed] [Google Scholar]
- 2.Gerendasy DD. Homeostatic tuning of the Ca2+ signal transduction by members of the calpacitin protein family. J Neurosci Res. 1999;58:107–119. [PubMed] [Google Scholar]
- 3.Reck-Peterson SL, Provance WDJ, Mooseker MS, Mercer JA. Class V myosins. Biochim Biophys Acta. 2000;1496:36–51. doi: 10.1016/s0167-4889(00)00007-0. [DOI] [PubMed] [Google Scholar]
- 4.Jurado LA, Sethu P, Chockalingam PS, Jarrett HW. Apocalmodulin. Physiol Rev. 1999;79:661–681. doi: 10.1152/physrev.1999.79.3.661. [DOI] [PubMed] [Google Scholar]
- 5.Hartmann J, Konnerth A. Determinants of postsynaptic Ca2+ signaling in Purkinje neurons. Cell Calcium. 2005;37:459–466. doi: 10.1016/j.ceca.2005.01.014. [DOI] [PubMed] [Google Scholar]
- 6.Slemmon JR, Feng B, Erhardt JA. Small proteins that modulate calmodulin-dependent signal transduction: Effects of PEP-19, neuromodulin, and neurogranin on enzyme activation and cellular homeostasis. Molecular Neurobiology. 2000;22:99–113. doi: 10.1385/MN:22:1-3:099. [DOI] [PubMed] [Google Scholar]
- 7.Utal AK, Stopka AL, Roy M, Coleman PD. PEP-19 immunohistochemistry defines the basal ganglia and associated structures in the adult human brain, and is dramatically reduced in Huntington’s disease. Neuroscience. 1998;86:1055–1063. doi: 10.1016/s0306-4522(98)00130-4. [DOI] [PubMed] [Google Scholar]
- 8.Erhardt JA, Legos JJ, Johanson RA, Slemmon JR, Wang X. Expression of PEP-19 inhibits apoptosis in PC12 cells. Neuroreport. 2000;11:3719–3323. doi: 10.1097/00001756-200011270-00026. [DOI] [PubMed] [Google Scholar]
- 9.Kanazawa Y, Makino M, Morishima Y, Yamada K, Nabeshima T, Shirakaki Y. Degradation of PEP-19 calmodulin-binding protein by calpain is implicated in neuronal cell death induced by intracellular Ca2+ overload. Neuroscience. 2008;154:473–481. doi: 10.1016/j.neuroscience.2008.03.044. [DOI] [PubMed] [Google Scholar]
- 10.Kanamori T, Takakura K, Mandai M, Kariya M, Fukuhara K, Kusakari T, Momma C, Shime H, Yagi H, Konishi M, Suzuki A, Matsumura N, Nanbu K, Fujuita N, Fujii S. PEP-19 overexpression in human uterine leiomyoma. Mol Hum Repro. 2003;9:709–717. doi: 10.1093/molehr/gag088. [DOI] [PubMed] [Google Scholar]
- 11.Ross DTea. Systematic variation in gene expression in human cancer cell lines. Nat Genet. 2000;24:208–209. doi: 10.1038/73432. [DOI] [PubMed] [Google Scholar]
- 12.Putkey JA, Kleerekoper Q, Gaertner TR, Waxham MN. A new role for IQ motif proteins in regulating calmodulin function. J Biol Chem. 2003;278:49667–49670. doi: 10.1074/jbc.C300372200. [DOI] [PubMed] [Google Scholar]
- 13.Kleerekoper Q, Putkey JA. PEP-19: An instrinsically disordered regulator of CaM signaling. J Biol Chem. 2009;284:7455–7464. doi: 10.1074/jbc.M808067200. [DOI] [PMC free article] [PubMed] [Google Scholar]
- 14.Putkey JA, Waxham MN, Gaertner TA, Brewer KJ, Goldsmith M, Kubota Y, Kleerekoper QK. Acidic/IQ motif regulators of calmodulin. J Biol Chem. 2008;283:1401–1410. doi: 10.1074/jbc.M703831200. [DOI] [PMC free article] [PubMed] [Google Scholar]
- 15.Malmendal A, Evenas J, Forsen S, Akke M. Structural dynamics in the C-terminal domain of calmodulin at low calcium levels. J Mol Biol. 1999;293:883–899. doi: 10.1006/jmbi.1999.3188. [DOI] [PubMed] [Google Scholar]
- 16.Zhang M, Tanaka T, Ikura M. Calcium-induced conformational transition revealed by the solution structure of apo-calmodulin. Nature Struct Biol. 1995;2:758–767. doi: 10.1038/nsb0995-758. [DOI] [PubMed] [Google Scholar]
- 17.Tjandra N, Kuboniwa H, Ren H, Bax A. Rotational dynamics of calcium-free calmodulin studieed by 15N-NMR relaxation measurements. Eur J Bioch. 1995;230:1014–1024. doi: 10.1111/j.1432-1033.1995.tb20650.x. [DOI] [PubMed] [Google Scholar]
- 18.Evenas J, Malmendal A, Akke M. Dynamics of the transition between open and closed conformations in a calmodulin C-terminal domain mutant. Structure. 2001;9:185–195. doi: 10.1016/s0969-2126(01)00575-5. [DOI] [PubMed] [Google Scholar]
- 19.Peersen OB, Madsen TS, Falke JJ. Intermolecular tuning of calmodulin by target peptides and proteins: Differential effects on Ca2+ binding and implications for kinase activation. Protein Sci. 1997;6:794–807. doi: 10.1002/pro.5560060406. [DOI] [PMC free article] [PubMed] [Google Scholar]
- 20.Putkey JA, Slaughter GR, Means AR. Bacterial expression and characterization of proteins derived from the chicken calmodulin cDNA and a calmodulin processed gene. J Biol Chem. 1985;260:4704–4712. [PubMed] [Google Scholar]
- 21.Putkey JA, Waxham MN. A peptide model for calmodlin trapping by calcium/calmodulin-dependent protein kinase II. J Biol Chem. 1996;271:29619–29623. doi: 10.1074/jbc.271.47.29619. [DOI] [PubMed] [Google Scholar]
- 22.Xiong LW, Kleerekoper QK, Wang X, Putkey JA. Intra- and interdomain effects due to mutation of calcium-binding sites in calmodulin. J Biol Chem. 2010;285:8094–8103. doi: 10.1074/jbc.M109.065243. [DOI] [PMC free article] [PubMed] [Google Scholar]
- 23.Farrow NAR, Muhandiram R, Singer AU, Pascal SM, Kay CM, Gish G, Shoelson SE, Pawson T, Forman-Kay JD, Kay LE. Backbone dynamics of a free and phosphopeptide-complexed Src homology 2 domain studied by 15N NMR relaxation. Biochemistry. 1994;33:5984–6003. doi: 10.1021/bi00185a040. [DOI] [PubMed] [Google Scholar]
- 24.Wishart DS, Bigam CG, Yao J, Abildgaard F, Dyson HJ, Oldfield E, Markley JL, Sykes BD. H-1, C-13 and N-15 Chemical-Shift Referencing in Biomolecular Nmr. J Biomol Nmr. 1995;6:135–140. doi: 10.1007/BF00211777. [DOI] [PubMed] [Google Scholar]
- 25.Farrow NA, Zhang O, Szabo A, Torchia DA, Kay LE. Spectral density function mapping using 15N relaxation data exclusively. J Biomol NMR. 1995;6:153–162. doi: 10.1007/BF00211779. [DOI] [PubMed] [Google Scholar]
- 26.Sahu SC, Bhuyan AK, Majumdar A, Udgaonkar JB. Backbone dynamics of barstar: a (15)N NMR relaxation study. Proteins. 2000;41:460–474. doi: 10.1002/1097-0134(20001201)41:4<460::aid-prot40>3.0.co;2-x. [DOI] [PubMed] [Google Scholar]
- 27.Kay LE, Torchia DA, Bax A. Backbone Dynamics of Proteins As Studied by 15N Inverse Detected Heteronuclear NMR Spectroscopy: Application to Staphylococcal Nuclease. Biochemistry. 1989;28:8972–8979. doi: 10.1021/bi00449a003. [DOI] [PubMed] [Google Scholar]
- 28.Mercier P, Spyracopoulos L, Sykes BD. Structure, dynamics, and thermodynamics of the structural domain of troponin C in complex with the regulatory peptide 1–40 of troponin I. Biochemistry. 2001;40:10063–10077. doi: 10.1021/bi010748+. [DOI] [PubMed] [Google Scholar]
- 29.Evans TI, Shea MA. Energetics of calmodulin domain interactions with the calmodulin binding domain of CaMKII. Proteins. 2009;76:47–61. doi: 10.1002/prot.22317. [DOI] [PMC free article] [PubMed] [Google Scholar]
- 30.VanScyoc WS, Sorensen BR, Rusinova E, Laws WR, Ross JB, Shea MA. Calcium binding to calmodulin mutants monitored by domain-specific intrinsic phenylalanine and tyrosine fluorescence. Biophys J. 2002;83:2767–2780. doi: 10.1016/S0006-3495(02)75286-7. [DOI] [PMC free article] [PubMed] [Google Scholar]
- 31.Linse S, Helmersson A, Forsén S. Calcium binding to calmodulin and its globular domains. J Biol Chem. 1991;266:8050–8054. [PubMed] [Google Scholar]
- 32.Bayley PM, Findlay WA, Martin SR. Target recognition by calmodulin: Dissecting the kinetics and affinity of interaction using short peptide sequences. Protein Sci. 1996;5:1215–1228. doi: 10.1002/pro.5560050701. [DOI] [PMC free article] [PubMed] [Google Scholar]
- 33.Strynadka NC, James MN. Crystal structures of the helix-loop-helix calcium-binding proteins. Annu Rev Biochem. 1989;58:951–998. doi: 10.1146/annurev.bi.58.070189.004511. [DOI] [PubMed] [Google Scholar]
- 34.Barbato G, Ikura M, Kay LE, Pastor RW, Bax A. Backbone dynamics of calmodulin studied by 15N relaxation using inverse detected two-dimensional NMR spectroscopy: The central helix is flexible. Biochemistry. 1992;31:5269–5278. doi: 10.1021/bi00138a005. [DOI] [PubMed] [Google Scholar]
- 35.Clore GM, Driscoll PC, Wingfield PT, Gronenborn AM. Analysis of the backbone dynamics of interleukin-1 beta using two-dimensional inverse detected heteronuclear 15N-1H NMR spectroscopy. Biochemistry. 1990;29:7387–7401. doi: 10.1021/bi00484a006. [DOI] [PubMed] [Google Scholar]
- 36.Baudier J, Deloulme JC, Van Dorsselaer A, Black D, Matthes HW. Purification and characterization of a brain-specific protein kinase C substrate, neurogranin (p17). Identification of a consensus amino acid sequence between neurogranin and neuromodulin (GAP43) that corresponds to the protein kinase C phosphorylation site and the calmodulin-binding domain. J Biol Chem. 1991;266:229–237. [PubMed] [Google Scholar]
- 37.Peng JW, Wagner G. Frequency spectrum of NH bonds in eglin c from spectral density mapping at multiple fields. Biochemistry. 1995;34:16733–16752. doi: 10.1021/bi00051a023. [DOI] [PubMed] [Google Scholar]
- 38.Gaertner TR, Putkey J, Waxham MN. Kinetics of calmodulin binding to RC3/neurogranin. Soc Neurosci Abst. 2002:30. [Google Scholar]
- 39.Rakhilin SV, Olson PA, Nishi A, Starkove NN, Fienberg AA, Nairn AC, Surmeier DJ, Greengard P. A network of control mediated by regulator of calcium/calmodulin-dependent signaling. Science. 2004;306:698–701. doi: 10.1126/science.1099961. [DOI] [PubMed] [Google Scholar]
- 40.Miyakawa T, Yared E, Pak JH, Huang FL, Huang KP, Crawley JN. Neurogranin null mutant mice display performance deficits on spatial learning tasks with anxiety related components. Hippocampus. 2001;11:763–775. doi: 10.1002/hipo.1092. [DOI] [PubMed] [Google Scholar]
- 41.Wu J, Li L, Huang K-P, Huang FL. Attenuation of protein kinase C and cAMP-dependent protein kinase signal transduction in the neurogranin knockout mouse. J Biol Chem. 2002;277:19498–19505. doi: 10.1074/jbc.M109082200. [DOI] [PubMed] [Google Scholar]
- 42.Krucker T, Siggins GR, McNamara RK, Lindsley KA, Dao A, Allison DW, De Lecea L, Lovenberg TW, Sutcliffe JG, Gerendasy DD. Targeted disruption of RC3 reveals a calmodulin-based mechanism for regulating metaplasticity in the hippocampus. Journal of Neuroscience. 2002;22:5525–5535. doi: 10.1523/JNEUROSCI.22-13-05525.2002. [DOI] [PMC free article] [PubMed] [Google Scholar]
- 43.Englander WS. Protein folding intermediates and pathways studied by hydrogen exchange. Annu Rev Biomol Struct. 2000;29:213–238. doi: 10.1146/annurev.biophys.29.1.213. [DOI] [PubMed] [Google Scholar]
- 44.Pak JH, Huang FL, Li J, Balschun D, Reymann KG, Chiang C, Westphal H, Huang K-P. Involvement of neurogranin in the modulation of calcium/calmodulin-dependent protein kinase II, synaptic plasticity, and spatial learning: A study with knockout mice. Proc Natl Acad Sci U S A. 2000;97:11232–11237. doi: 10.1073/pnas.210184697. [DOI] [PMC free article] [PubMed] [Google Scholar]
- 45.Huang FL, Huang KP, Wu J, Boucheron C. Environmental enrichment enhances neurogranin expression and hippocampal learning and memory but fails to rescue the impairments of neurogranin null mutant mice. J Neurosci. 2006;26:6230–6237. doi: 10.1523/JNEUROSCI.1182-06.2006. [DOI] [PMC free article] [PubMed] [Google Scholar]
- 46.Ge X, Yamamoto S, Tsutsumi S, Midorikawa Y, Ihara S, Wang SM, Aburatani H. Interpreting expression profiles of cancers by genome-wide survey of breadth of expression in normal tissues. Genomics. 2005;86:127–141. doi: 10.1016/j.ygeno.2005.04.008. [DOI] [PubMed] [Google Scholar]
- 47.Palmer AG, CDK, Loria JP. Nuclear magnetic resonance methods for quantifying microsecond-to-millisecond motions in biological macromolecules. Meth Enz. 2001:339. doi: 10.1016/s0076-6879(01)39315-1. [DOI] [PubMed] [Google Scholar]
- 48.Mittermaier A, Kay LE. New tools provide new insights in NMR studies of protein dynamics. Science. 2006;312:224–228. doi: 10.1126/science.1124964. [DOI] [PubMed] [Google Scholar]
- 49.Boehr DD, Dyson HJ, Wright PE. An NMR perspective on enzyme dynamics. Chem Rev. 2006;106:3055–3079. doi: 10.1021/cr050312q. [DOI] [PubMed] [Google Scholar]
- 50.Kern D, Eisenmesser EZ, Wolf-Watz M. Enzyme dynamics during catalysis measured by NMR spectroscopy. Methods Enzymol. 2005;394:507–524. doi: 10.1016/S0076-6879(05)94021-4. [DOI] [PubMed] [Google Scholar]
- 51.Evenas J, Forsen S, Malmendal A, Akke M. Backbone dynamics and energetics of a calmodulin domain mutant exchanging between closed and open conformations. J Mol Biol. 1999;289:603–617. doi: 10.1006/jmbi.1999.2770. [DOI] [PubMed] [Google Scholar]
- 52.Tompa P, Fuxreiter M. Fuzzy complexes: polymorphism and structural disorder in protein-protein interactions. Trends Biochem Sci. 2008;33:2–8. doi: 10.1016/j.tibs.2007.10.003. [DOI] [PubMed] [Google Scholar]
- 53.Hilser VJ, Thompson EB. Intrinsic disorder as a mechanism to optimize allosteric coupling in proteins. Proc Natl Acad Sci U S A. 2007;104:8311–8315. doi: 10.1073/pnas.0700329104. [DOI] [PMC free article] [PubMed] [Google Scholar]
- 54.Biekofsky RR, Martin SR, Browne JP, Bayley PM, Feeney J. Ca2+ coodination to backbone carbonyl oxygen atoms in calmodulin and other EF-hand proteins: 15N chemical shifts as probes for monitoring individual-site Ca2+ coordination. Biochemistry. 1998;37:7617–7629. doi: 10.1021/bi9800449. [DOI] [PubMed] [Google Scholar]
- 55.Pedigo S, Shea MA. Discontinuous equilibrium titrations of cooperative calcium binding to calmodulin monitored by 1-D 1H-nuclear magnetic resonance spectroscopy. Biochemistry. 1995;34:10676–10689. doi: 10.1021/bi00033a044. [DOI] [PubMed] [Google Scholar]
- 56.Crouch TH, Klee CB. Positive cooperative binding of calcium to bovine brain calmodulin. Biochemistry. 1980;19:3692–3698. doi: 10.1021/bi00557a009. [DOI] [PubMed] [Google Scholar]
- 57.Larsson G, Schleucher J, Onions J, Hermann S, Grundstrom T, Wijmenga SS. Backbone dynamics of a symmetric calmodulin dimer in complex with the calmodulin-binding domain of the basic-helix-loop-helix transcription factor SEF2-1/E2-2: a highly dynamic complex. Biophys J. 2005;89:1214–1226. doi: 10.1529/biophysj.104.055780. [DOI] [PMC free article] [PubMed] [Google Scholar]
- 58.Frederick KK, Kranz JK, Wand AJ. Characterization of the backbone and side chain dynamics of the CaM-CaMKIp complex reveals microscopic contributions to protein conformational entropy. Biochemistry. 2006;45:9841–9848. doi: 10.1021/bi060865a. [DOI] [PubMed] [Google Scholar]
- 59.Nelson MR, Thulin E, Fagan PA, Forsen S, Chazin WJ. The EF-hand domain: a globally cooperative structural unit. Protein Sci. 2002;11:198–205. doi: 10.1110/ps.33302. [DOI] [PMC free article] [PubMed] [Google Scholar]
- 60.Gifford JL, Walsh MP, Vogel HJ. Structures and metal-ion-binding properties of the Ca2+-binding helix-loop-helix EF-hand motifs. Biochem J. 2007;405:199–221. doi: 10.1042/BJ20070255. [DOI] [PubMed] [Google Scholar]
- 61.Juranic N, Atanasova E, Streiff JH, Macura S, Prendergast FG. Solvent-induced differentiation of protein backbone hydrogen bonds in calmodulin. Protein Sci. 2007;16:1329–1337. doi: 10.1110/ps.062689807. [DOI] [PMC free article] [PubMed] [Google Scholar]
Associated Data
This section collects any data citations, data availability statements, or supplementary materials included in this article.
Supplementary Materials
Supplemental Table 1: Comparison of secondary structures for the C-domain of free and PEP-19 bound CaM.
Supplemental Figure 1: Binding PEP-19 to apo-CaM causes significant resonance line broadening for residues in the C-domain.
Supplemental Figure 2: Comparison of 1H, 15N HSQC spectra of C-CaM and intact CaM in the absence and presence of Ca2+.
Supplemental Figure 3: Plot of amide chemical shift differences (Δδavg) as a function of residue number for C-CaM and the C-domain of intact CaM in the absence and presence of Ca2+.
Supplemental Figure 4: Comparison of 1H, 15N HSQC spectra of Ca2+-bound C-CaM and intact Ca2+-bound CaM in the presence of excess PEP-19 at 298 K.
Supplemental Figure 5: Structural perturbations of C-CaM induced by PEP-19 binding at 298K.
Supplemental Figure 6: Identification of secondary structures for Ca2+-bound intact CaM/PEP-19.