Abstract
Study Objective:
To determine if low-level intermittent auditory stimuli have the potential to disrupt sleep during 24-h recordings, we assessed arousal occurrence to varying stimulus intensities. Additionally, if stimulus-generated evoked response potential (ERP) components provide a metric of underlying cortical state, then a particular ERP structure may precede an arousal.
Design:
Physiological electrodes measuring EEG, EKG, and EMG were implanted into 5 adult female Sprague-Dawley rats. We delivered auditory stimuli of varying intensities (50-75 dBa sound pressure level SPL) at random intervals of 6-12 s over a 24-hour period. Recordings were divided into 2-s epochs and scored for sleep/wake state. Following each stimulus, we identified whether the animal stayed asleep or woke. We then sorted the stimuli depending on prior and post-stimulus state, and measured ERP components.
Results:
Auditory stimuli did not produce a significant increase in the number of arousals compared to silent control periods. Overall, arousal from REM sleep occurred more often compared to quiet sleep. ERPs preceding an arousal had decreased mean area and shorter N1 latency.
Conclusion:
Low level auditory stimuli did not fragment animal sleep since we observed no significant change in arousal occurrence. Arousals that occurred within 4 s of a stimulus exhibited an ERP mean area and latency had features similar to ERPs generated during wake, indicating that the underlying cortical tissue state may contribute to physiological conditions required for arousal.
Citation:
Phillips DJ; Schei JL; Meighan PC; Rector DM. Cortical evoked responses associated with arousal from sleep. SLEEP 2011;34(1):65–72.
Keywords: Evoked response potential (ERP), auditory intensity, EEG, rat
ONE DEFINING CHARACTERISTIC OF SLEEP IS A STIMULUS-INDUCED REVERSAL FROM UNCONSCIOUSNESS, DISTINGUISHING IT FROM ANESTHESIA AND coma. Arousal from sleep can be spontaneous or elicited by external stimulation, depending on the stimulus intensity and relevance.1–3 While strong and relevant external stimuli can trigger reticular activating systems, amygdala, and prefrontal cortex, leading to wakefulness,3,4 the mechanisms that induce spontaneous arousal are still largely unknown. A detailed study of evoked response potentials (ERPs) from low-level auditory stimuli and that precede spontaneous arousal, may shed light on conditions and systems that cause wake without external stimuli. First, it is important to establish that low-level auditory stimuli do not disrupt sleep. Second, recent theories about sleep regulation posit that mechanisms are distributed across the brain rather than centralized within the brainstem.5 Thus, if sleep regulation ultimately depends on regional cortical tissue state and prior activity levels, then the underlying cortical tissue state may also affect arousal probability. Consequently, the structure of cortical ERPs generated in specific cortical regions during sleep may define the conditions needed for spontaneous arousal and provide insight to mechanisms that underlie wakening.6
ERPs are generated by external sensory stimulation and often provide indications of neural processing during waking.7–9 However, since sensory input also elicits cortical ERPs during sleep, some processing may still occur, yet with attenuated high level cognitive information processing.10,11 Specifically, ERPs show high-amplitude, long-latency responses during quiet sleep (sleep-like state), and low-amplitude, short-latency responses during wake and REM (wake-like state).12,13 A detailed analysis of single trial ERPs shows good correspondence with hyperpolarized (sleep-like) and depolarized (wake-like) states of cells within a cortical column,14–16 suggesting that the size and structure of the ERP can be used as a marker to determine the membrane state during the response. Thus, as long as external stimuli do not alter whole animal sleep behavior, the ERP may be a useful probe to assess cortical state.
The purpose of this study was to measure potential sleep disturbance patterns to external stimuli, and correlate the ERP structure to the underlying cortical tissue state following stimulation. We hypothesized that arousal may be dependent on sleep depth (characterized by EEG delta power), as shown in previous studies,17,18 and stimulus intensity. Since tissue membrane properties during the depolarized phase of the delta wave resembles those during the waking state,19 we also expected that arousals would occur more often when stimuli produced low-amplitude, short-latency, wake-like ERPs, characteristic of ERPs generated during the depolarized state.
MATERIALS AND METHODS
Surgical Procedures
Adult female Sprague-Dawley rats weighing 240-280 grams (N = 5, Simonsen Laboratories, Gilroy, CA) were anesthetized with 2.5% isoflurane and chronically instrumented with electrodes measuring EEG, neck EMG, and EKG. We exposed the dorsal skull surface and placed stainless steel screw electrodes (J.I. Morris, Southbridge, MA, F00CE188) over the frontal (1 mm rostral to bregma and 2 mm lateral to the midline), and parietal (1 mm lateral to the temporal ridge and 6 mm caudal to bregma) lobes, with 2 ground references in the occipital lobes (1 mm caudal to lambda and 2 mm lateral to the midline). Screws were also placed over the parietal/temporal lobes, 4 mm rostral to lambda, and on the lateral side of the temporal ridge to assist in anchoring the head-stage to the skull. To record neck EMG, a multistranded Teflon-insulated stainless steel wire (New England Wire, Lisbon, NH, 212-50F-357-0) with 2 mm of the wire end exposed was inserted into the neck muscles. Similarly, a Teflon-insulated wire with 4 mm of the end exposed was inserted subcutaneously on the right side of the rib cage to record EKG and intercostal muscle activity. All electrode wires were directed to the top of the skull, soldered to a miniature connector, and covered in dental acrylic for protection. The skin around the opening was covered with a broad-spectrum antibiotic ointment. An analgesic (flunixin meglumine, 1.1 mg/kg) and an antibiotic (gentamicin, 5 mg/kg) were administered up to 3 days following the surgery. Animals were given one week to recover prior to recording. All procedures were reviewed and approved by the Washington State University Animal Care and Use Committee.
Experimental Procedures
Animals were connected through a cable/commutator system (ProMed-Tec, Bellingham, MA, Pro-ES24), allowing tethered movement in a 30 × 30 × 50 cm enclosure. Animals were adapted to the recording apparatus through ≥ 8 sessions of 30-min exposure in the enclosure before beginning the 24-h recordings. Food and water were available ad libitum. We used a custom data acquisition and storage system20 to amplify (1000 gain), filter (0.1 Hz and 3.2 kHz), and digitize all signals at a 10 kHz sample rate. Data were continuously displayed and archived for post hoc analysis.
Wide-band speaker clicks were generated by a 0.2-ms square wave pulse and delivered infrequently with 6- to 12-s random interstimulus intervals to prevent habituation. The speaker was placed above the animal enclosure. Recordings were 24-h in duration and consisted of single intensity stimuli or randomly presented intensities for each session. Whether animals received randomly presented stimulus intensities or consistent stimulus intensity in a given session, all animals received approximately the same number of total stimuli for each intensity. Initially we used randomly presented intensities, but we did not obtain enough arousals from a given intensity and sleep state to obtain an average evoked response with a high enough signal-to-noise ratio by which we could measure ERP parameters. Thus, none of the random intensity sessions were used in the analysis, and we switched our stimulus presentation, such that any in 24-h period, animals were presented with the same intensity. Over multiple recordings, the intensities were selected in a random order to reduce the potential for recording day effects. Different intensities were produced by varying the drive voltage to the speaker, and ranged from 50 to 75 decibels A-weighted sound pressure level (dBa SPL) (Model 732A, BK Precision, Yorba Linda, CA). Additionally, we recorded a silent control period when triggers were still produced but the speaker was disconnected.
Data Analysis
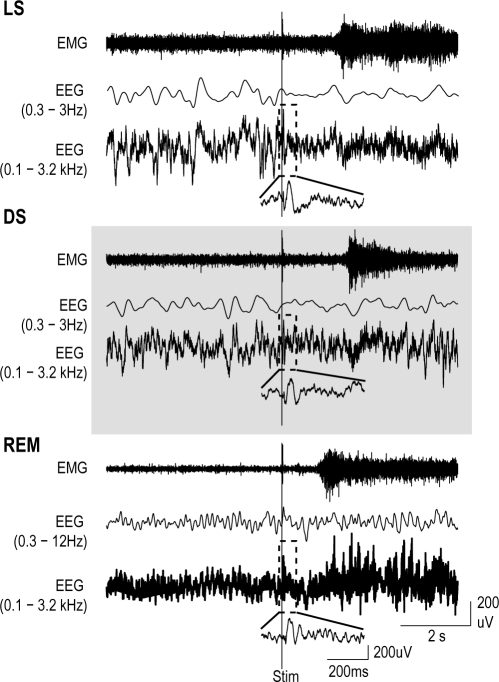
Data were divided into 2-s epochs and converted using fast Fourier transform into their frequency domain. State identification was initially done using a cluster cutting method,16 and then visually confirmed and adjusted. During the visual scoring procedure, careful attention was taken to identify arousal after a stimulus. For this condition, animals must have spent ≥ 20 s in a sleep state, transition to the wake state (decreased delta power, increased EMG) within 4-s following stimulation, and have sustained wakefulness for at least 4-s (Figure 1). These epochs were marked for subsequent analysis. We used a 4-s window for arousal identification because it was difficult to assess whole animal sleep state with finer resolution, and because the up-down phases of delta rhythm fluctuate between 0.3-3 Hz, decreasing the probability that any given arousal would correspond to a particular delta wave with latencies longer than 4-s. While several physiological states have been identified,16,21 we focused on light quiet sleep (LS, low EMG, medium delta power), deep quiet sleep (DS, very low EMG, high delta power), REM sleep (flat EMG and low delta power), and wake (high EMG and low delta power). The number of arousals from each sleep state were expressed as a percentage of total stimuli delivered within that state. To compare arousals across time and intensity, we used the statistical program NCSS (NCSS, Kaysville, UT). In order to analyze our percent awakening data across state and intensity and state distribution data, we first tested for normality using an Omnibus Normality of Residuals and Modified-Levene Equal Variance. This indicated that our percent awakening data was not normally distributed, thus requiring a nonparametric test. We performed a linear regression on each state (intensities 50-75), then a 2-line regression test was used to compare between each state. A Bonferroni correction was done to account for multiple comparisons. To test if the relationship was indeed linear, a nonlinear analysis of the data was done. The state distribution data was normally distributed, so we used a one-way analysis of variance (ANOVA) to test for significance.
Figure 1.
Three example data sets from one animal illustrate arousal from light sleep (LS), deep sleep (DS), and REM sleep (REM). Careful attention was taken during visual stage analysis to identify arousal following a stimulus. EMG, low-frequency filtered EEG (0.3-3 Hz or 0.3-12 Hz), and high-frequency filtered EEG (0.1 Hz-3.2 kHz) are shown for arousals from each sleep state. The smaller inset is a magnified view of the single trial ERP (dashed box). Increased EMG activity and wake-like EEG activity were used to define arousals.
Averages of ERPs across stimuli from each state were plotted, using a freely available computer-based analysis package (Octave, www.octave.org). For each state average, we measured the P1/N1 amplitude, P1 and N1 latency, and calculated the mean area from stimulus onset to 120 ms post stimulus. Mann-Whitney U tests were used to test the significance of normalized ERP components (amplitude, mean area, P1 and N1 latency) when the animals stayed asleep versus when they aroused following a stimulus. The P1/N1 components were chosen because they may best represent evoked cortical activity.
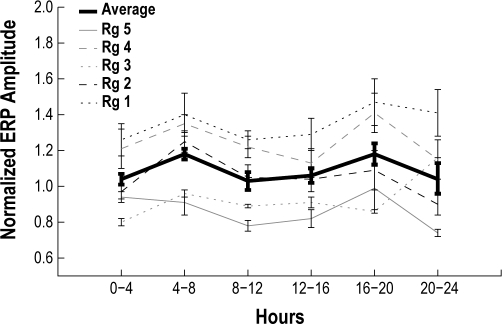
In order to assess the potential for habituation, the average ERP amplitude in response to 70-75 dBa stimulation during wake was calculated for each hour of the recording, normalized to the first hour ERP average, and presented in 4-h bins. The resulting sequence of 4-h bin epochs were plotted across the 24-h recording time, and a Pearson regression was used to assess potential systematic changes over time.
In order to assess potential correlations between EEG power frequency composition and arousal, we calculated the EEG power frequency bands for the 2-s epoch prior to a stimulus for both arousal and non-arousal from sleep conditions. To control for EEG amplitude differences across animals, sleep and arousal data were normalized to the wake state, then the difference in power for each frequency range 2 s prior to a stimulus was calculated between conditions when the animal remained asleep vs when the animal woke. Since the data passed the Omnibus Normality of Residuals and Modified-Levene Equal Variance tests, single sample t-tests were used to determine if values were significantly different from zero. Differences were deemed statistically significant if the null hypothesis was rejected at values of P < 0.05.
RESULTS
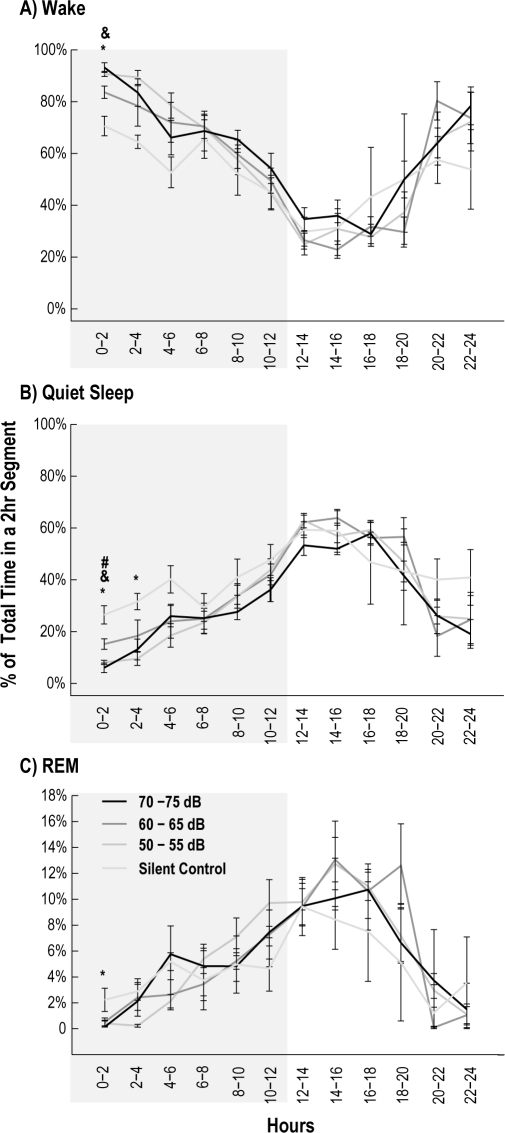
None of the stimulation paradigms disturbed sleep time over the total 24-h period compared to silent controls (ANOVA: Wake: P = 0.73; LS: P = 0.69; DS: P = 0.32; REM: P = 0.50). However, we noted small changes in sleep time during the first 4 h, when the recording was broken into 2-h segments. During the first 4 h of the silent control dark cycle, animals spent more time in quiet sleep (QS, both LS and DS) compared to recordings in which stimuli were present (U test: 0-2 h: P < 0.01; 2-4 h: P < 0.05) (Figure 2B). Wake and REM sleep showed statistical differences only during the first 2 h of the dark cycle (Figure 2A, C) (U test: Wake: P = 0.0002; REM: P = 0.02). Other than the first 4 h of the dark cycle, there were no significant differences in the time spent awake, in QS, or in REM sleep.
Figure 2.
Recordings were binned into 2-h segments, and the percent time spent for each state was plotted for each stimulus condition. The darkened area refers to the dark cycle. During the silent control, time spent in the wake state (panel A) decreased during the first 2 h of the dark cycle (*P < 0.05). Wake was also reduced in the first 2-h bins during the 60-65 dBa intensity compared to 50-55 dBa intensity (&P < 0.05), but not 70-75 dBa intensity. Time spent in quiet sleep (panel B) during the first 4 h of the dark cycle, and REM sleep (panel C) during the first 2 h of the dark cycle, increased for the silent control (*P < 0.05). During the first 2 h, time spent in quiet sleep was also increased during the 60-65 dBa intensity compared to 50-55 dBa intensity (&P < 0.05) and 70-75 dBa intensity (#P < 0.05) Vertical error bars represent SEM across all recordings from all animals.
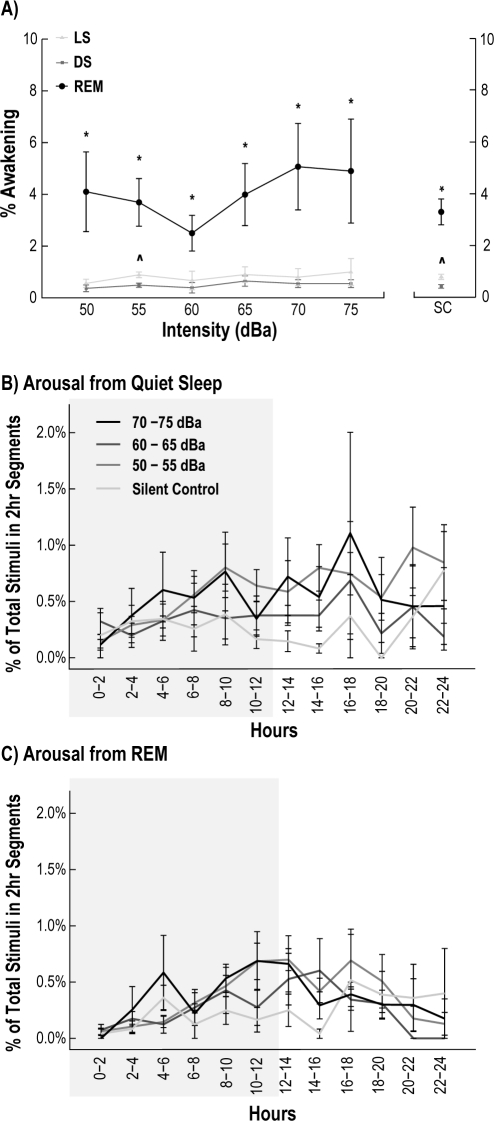
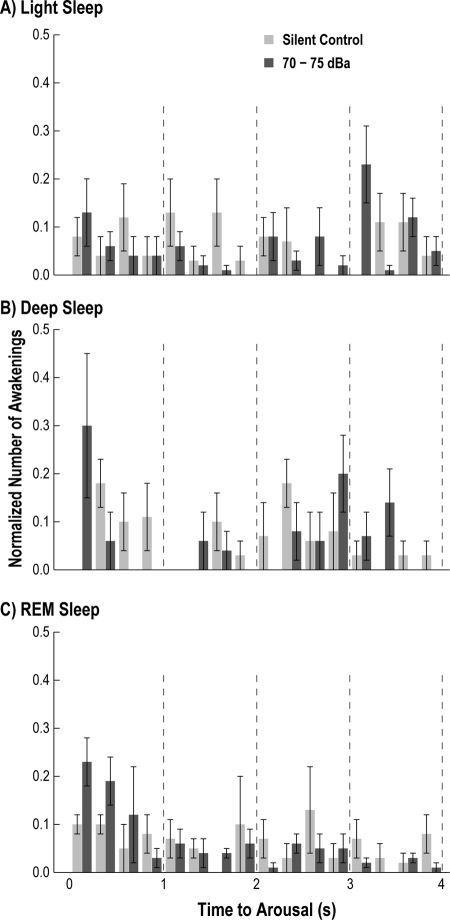
Stimuli did not result in increased arousal occurrence within a state over the 24-h recording period (Figure 3A), or when the recordings were broken into 2-h bins (Figure 3B, C). We observed a significantly larger number of awakenings from REM sleep compared to both LS and DS across all stimulus intensities (2-line regression: P < 0.01) (Figure 3A). A nonlinear analysis of the data did not improve the fit, suggesting that the data had a linear relationship. A small increase in the total number of awakenings was also observed between LS and DS, but was only significant between the silent control (U test: P < 0.05) and the 55 dBa (U test: P < 0.05) sessions. Additionally, we observed that the time to arousal was evenly distributed during the 4-s window for all sleep states (Figure 4), and there were no significant differences in the time to arousal histogram when comparing 70-75 dBa to silent control. While our data were not always parametric, a power analysis of the present data indicated that 47 animals, each with 7 recordings (one from each intensity) would be required to obtain significance of P < 0.05.
Figure 3.
Arousals from sleep that were preceded by a stimulus were identified during the 24-h recording period for each intensity studied. There was no significant increase in the number of arousals comparing silent control sessions (SC) to any auditory intensity for light quiet sleep (LS) (light gray + square), deep quiet sleep (DS) (dark gray + circle), or REM (thick black + circle) (panel A). REM showed an increase in arousal for all stimulus conditions compared to LS and DS (*REM compared to LS and DS: P < 0.05). Significant differences between LS and DS were only found during the silent control and 55 dBa recordings (^P < 0.05). There was no difference in number of arousals from quiet sleep (LS and DS) (panel B) and REM sleep (panel C) between any intensity at any time point. The darkened areas refer to the dark cycle. Vertical error bars represent SEM across all recordings from all animals.
Figure 4.
Time to arousal following a stimulus was binned in 0.25-s intervals and plotted. There were no statistical differences between the silent control (black bars) and 70-75 dBa pooled data (grey bars) for any sleep state, indicating that the stimuli per se did not initiate the arousal. Vertical error bars represent SEM across all recordings from all animals.
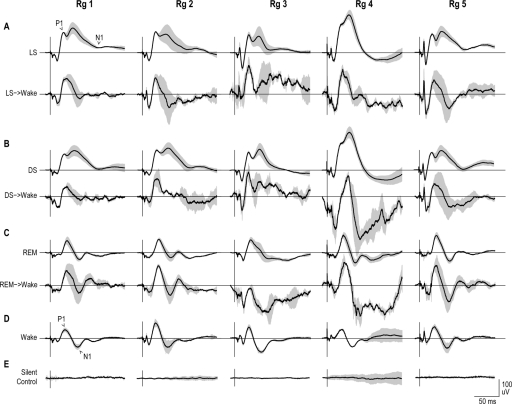
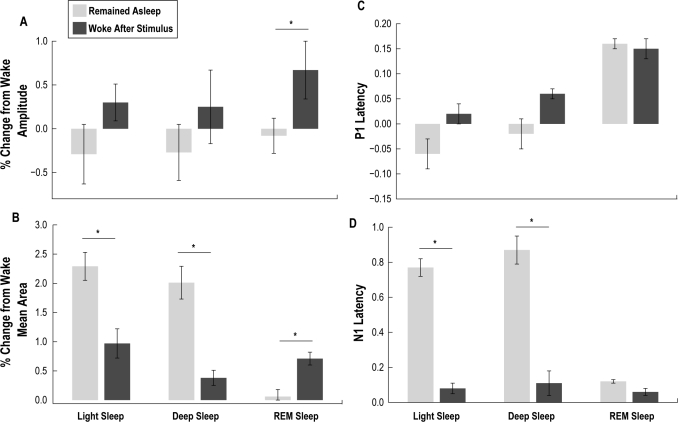
All auditory stimuli produced ERPs during wake, sleep, and arousal states (Figure 5). There was no significant change in ERP amplitude between the 4-h bins across the recordings (Figure 6) (P = 0.33). Contrary to our initial hypothesis, the P1/N1 amplitude was not significantly different between the QS states, both with and without a subsequent awakening (Figure 7A). However, the ERP amplitude was significantly larger when the animals woke from REM sleep (U test: P < 0.01). During the QS epochs, when the animals remained asleep, we observed a unique secondary peak. This second peak was not present when an awakening followed a stimulus.
Figure 5.
Averaged (solid black line) and standard deviation (grey background) ERPs were plotted for each sleep state from all 5 animals (Rg # refers to the animal number). Panel A and B shows ERPs plotted for light quiet sleep (LS) and deep quiet sleep (DS) when the animal remained asleep (upper trace) and when the animal aroused from sleep (lower trace). Note the second prominent peak when the animal remained asleep, which contributed to the overall increase in ERP area and N1 latency during this condition. Panels C, D, and E show the ERPs plotted from REM states, wake, and silent control sessions correspondingly.
Figure 6.
Average ERP amplitudes from wake during calculated in 4-h bins across each recording. Data from each animal is plotted with thin lines (Rg # refers to the animal number) and the grand average across all animals is plotted using a thick black line. Data was then normalized to the average of the first hour. A Pearson correlation showed no significant change in ERP amplitude over time. Error bars shown for each animal represent SEM of the 4-h binned data for all recordings from each animal Error bars shown on the averaged trace indicate SEM across all recordings from all animals.
Figure 7.
ERP components were separated by amplitude (panel A), mean ERP area (panel B), P1 latency (panel C) and N1 latency (panel D). Light gray bars indicate ERP components when the animal remained asleep following a stimulus, presented as a percent change from the wake state. Dark gray bars represent ERP components when the animal aroused from a sleep state following a stimulus, presented as a percent change from wake. In panel A, P1-N1 amplitude showed no difference for both light quiet sleep (LS) and deep quiet sleep (DS), while REM showed an increase prior to arousal (REM: P = 0.01). In panel B, the mean area was greater during LS and DS when the animal stayed asleep following a stimulus (LS: P = 0.03; DS: P = 0.02), while REM showed an increase when the animal aroused (REM: P = 0.001). In panel C, we found no difference in P1 latency for any group tested (LS: P = 0.7; DS: P = 0.7; REM: P = 0.9), while N1 latency (panel D) was significantly increased for LS and DS when the animal remained asleep (LS: P < 0.001; DS: P < 0.001). Error bars shown indicate SEM across all recordings from all animals.
Figure 8.
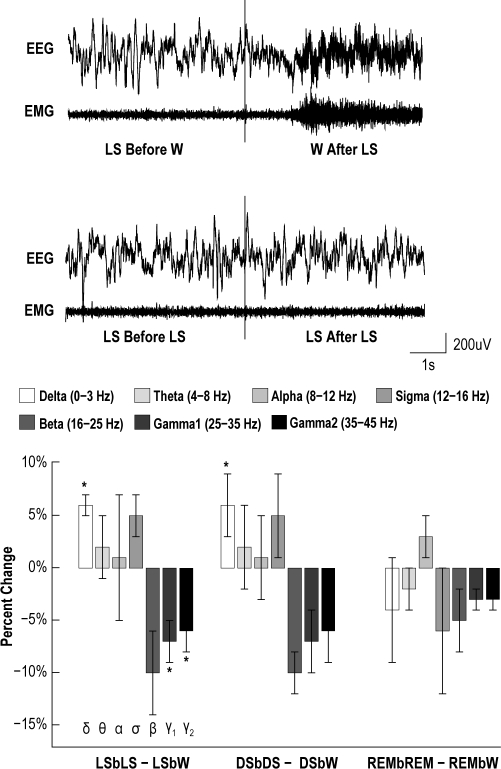
EEG power frequency bands were calculated using FFT procedures for the 2-s epoch preceding a stimulus for wake, LS, DS, and REM. Figure notation: light sleep before light sleep (LSbLS), light sleep before wake (LSbW), deep sleep before deep sleep (DSbDS), deep sleep before wake (DSbW), REM before REM (REMbREM), and REM before wake (REMbW). To adjust for different EEG amplitudes across animals, sleep and arousal data were normalized to the power during the wake state, then the difference was taken between the condition when the animal remained asleep vs when the animal woke for each 2-s epoch prior to a stimulus. The delta power was significantly higher for LS and DS when an animal remained asleep following a stimulus (P < 0.05). The higher frequency bands, Gamma1, and Gamma2, were significantly lower when the animal remained in LS (P < 0.05). Error bars shown indicate SEM across all recordings from all animals.
A more detailed analysis was performed, calculating the mean ERP area for each condition to quantify changes in ERP shape due to the presence or absence of the secondary peak found during quiet sleep. This analysis revealed that the mean ERP area was significantly larger when animals remained in LS and DS after the stimulus, compared to those periods when the animals woke (U test: LS: P < 0.05; DS: P < 0.05) (Figure 7B). REM sleep showed a decrease in mean area when the animals remained in REM sleep compared to those periods when the animals woke (U test: REM: P < 0.01). There was no change in P1 latency for any group (Figure 7C). Due to the second peak, a significant increase was observed in the N1 latency when animals remained in both QS states, but no N1 latency change was observed across REM (U test: LS: P < 0.001; DS: P < 0.001) (Figure 7D). Mean values for the ERP component analysis ± SEM, and the average number of stimuli presented each condition are shown in Table 1.
Table 1.
The average number of total stimuli ± SEM presented during wake, light sleep (LS), deep sleep (DS), and REM, and arousal from LS, DS, and REM.
| Number of Stimuli | Amplitude | Mean Area | P1 Latency | N1 Latency | |
|---|---|---|---|---|---|
| Total from Wake | 1672.5 ± 151.88 | ||||
| Total from LS | 1600 ± 49.05 | −0.29 ± 0.34 | 2.29 ± 0.24 | −0.03 ± 0.02 | 0.77 ± 0.05 |
| Total from DS | 1957.75 ± 167 | −0.27 ± 0.32 | 2.01 ± 0.28 | 0.01 ± 0.02 | 0.87 ± 0.08 |
| Total from REM | 621.75 ± 61.71 | −0.08 ± 0.2 | 0.06 ± 0.12 | 0.16 ± 0.01 | 0.12 ± 0.01 |
| Woke from LS | 27 ± 10.52 | 0.3 ± 0.21 | 0.97 ± 0.25 | 0.01 ± 0.01 | 0.08 ± 0.03 |
| Woke from DS | 16.25 ± 3.35 | 0.25 ± 0.42 | 0.38 ± 0.13 | 0.05 ± 0.02 | 0.11 ± 0.07 |
| Woke from REM | 36.25 ± 7.67 | 0.67 ± 0.31 | 0.71 ± 0.11 | 0.14 ± 0.02 | 0.06 ± 0.02 |
ERP components (Amplitude, Mean Area, P1 Latency, N1 Latency) are listed as the normalized mean difference from wake ± SEM.
EEG power frequency analysis between the arousal and non-arousal conditions in the 2-s epoch prior to the stimulus showed a significantly higher delta power for LS and DS when the animal remained asleep following a stimulus (t-test: P < 0.05). The higher frequency bands—Gamma1, and Gamma2—were significantly lower when the animal remained in LS (P < 0.05). REM sleep did not show any significant change in EEG power frequency composition between the arousal and non-arousal REM conditions.
DISCUSSION
The wide band auditory clicks used in our stimulus paradigm were not sufficiently intense or relevant to increase the number of arousals from sleep state, compared to silent control baseline recordings. We did not observe an increase in the total number of arousals, or a decrease in the time to arousal for any stimulus condition. Perhaps louder intensity stimuli would increase the chance of arousal; however, our loudest intensity (75 dBa) did not show a significant increase in arousal compared to the silent control. When stimuli were present, there was an increase in wakefulness during the first 4 hours of the silent control dark cycle. The environment which the recordings occurred was relatively void of sensory stimuli, other than the auditory stimuli provided in the experiment (ambient sound level approximately 40-45 dBa). The introduction of auditory stimuli increased the frequency of exploration during the first hour of exposure in mice,22 which could explain the increase in wake time for the first 2 hours when stimuli were present in our recordings. Similarly, during the silent control conditions, sensory deprived animals may spend more time asleep. For example, guinea pigs under total auditory deprivation through cochlear destruction also exhibited increased sleep time.23 While our animals were not deaf, the lack of auditory stimulation during the silent control may have promoted a similar result. However, regardless of the small differences in the initial sleep time, arousal from sleep due to the stimuli was not different.
Since our loudest intensity stimulation (75 dBa) did not increase arousals compared to silent controls, we conclude that auditory stimulation does not fragment sleep. Louder intensity stimuli may increase the chance of arousal1; however, evoked responses from low intensity stimuli are robust and provide adequate cortical state assessment, thus, louder stimulation is not required. The likelihood of arousal from LS or DS was approximately 1% or less, while arousal occurrence in REM increased to 3% to 5%. For every state, the percent of arousals were similar for the silent control condition, indicating that the stimulus itself does not necessarily cause the arousal. This result supports the use of low-level external stimuli as a probe for cortical state without disturbing whole animal sleep.
Our results also show that when an animal woke from QS (Figure 5A, B), the preceding ERP exhibited similar features to those ERPs recorded during the wake state (Figure 5D). While the ERP P1/N1 amplitude was not significantly different between continued sleep state and arousal, the mean ERP area was significantly larger when the animal remained in QS due to additional later ERP components. When the animal woke, the preceding ERP lacked the second long lasting peak unique to QS, resulting in a lower mean ERP area (Figure 5A, B). Additionally, the N1 latency was more wake-like when the animal woke. The EEG power frequency composition during the 2-s epoch before a stimulus revealed a decrease in delta power prior to arousal from LS and DS. From these results, it appears that the EEG also reflects more “wake-like” characteristics before arousal. Since the wake-like state may correspond to the depolarized or “up” state of cortical cells,19 the present study suggests that a wake-like ERP during whole animal sleep could provide conditions needed for arousal. In accordance with the data from Rector et al.,16 we would expect arousals to occur more often when stimuli were presented during the depolarized phase of the delta wave. A single-trial characterized “wake-like” ERP should be observed during the depolarized state, and be associated with an increase in arousal probability. The data from the present study did not achieve sufficient signal-to-noise to determine the characteristics of single trial ERPs. Further studies are required to assess single trial data. Similarly, since cortical tissue is usually depolarized (up state) during REM sleep, much like wake, we would expect more arousals during REM. Since arousal occurrence was relatively low, even from REM, other mechanisms must be in place to assure sleep is maintained during REM, otherwise any sensory stimuli might cause too many arousals.
CONCLUSIONS
The stimuli presented in our paradigm did not produce an increase in arousals. The silent control period showed increased sleep time during the first 4 hours of the active period, perhaps due to the animal attending to the stimuli; however, this did not result in an overall increase in sleep across the 24-hour period. This observation supports the use of simple wide-band auditory stimuli as a probe for cortical state. We also showed that arousals may be associated with the wake-like state of cortical tissue. Thus, ERPs may be a useful metric to identify underlying cortical activity, and may provide predictive measures for arousal. Since our electrodes did not probe local cortical states during sleep and our stimuli did not activate a particular hemisphere, we could not determine if localized changes in cortical state specific to the stimulus lead to arousal. Further experiments are needed to explore arousals that might occur with localized cortical state and cortical column-specific stimuli.
DISCLOSURE STATEMENT
This was not an industry supported study. The authors have indicated no financial conflicts of interest.
ACKNOWLEDGMENTS
The authors would like to thank Dr. Jim Krueger for the helpful advice during manuscript preparation along with Manuel Rojas and Jennifer Walker for carrying out the surgical procedures.
This work was funded by NIH MH60263, NSF DGE-0900781, the WM Keck Foundation, and the Poncin Foundation.
REFERENCES
- 1.Kato T, Montplaisir JY, Lavigne GJ. Experimentally induced arousals during sleep: a cross-modality matching paradigm. J Sleep Res. 2004;13:229–38. doi: 10.1111/j.1365-2869.2004.00409.x. [DOI] [PubMed] [Google Scholar]
- 2.Langford GW, Meddis R, Pearson AJ. Awakening latency from sleep for meaningful and non-meaningful stimuli. Psychophysiology . 1974;11:1–5. doi: 10.1111/j.1469-8986.1974.tb00815.x. [DOI] [PubMed] [Google Scholar]
- 3.Portas CM, Krakow K, Allen P, Josephs O, Armony JL, Frith CD. Auditory processing across the sleep-wake cycle: simultaneous EEG and fMRI monitoring in humans. Neuron. 2000;28:991–9. doi: 10.1016/s0896-6273(00)00169-0. [DOI] [PubMed] [Google Scholar]
- 4.Siegel J. Brain mechanisms that control sleep and waking. Naturwissenschaften. 2004;91:355–65. doi: 10.1007/s00114-004-0541-9. [DOI] [PubMed] [Google Scholar]
- 5.Krueger JM, Rector DM, Roy S, Van Dongen HP, Belenky G, Panksepp J. Sleep as a fundamental property of neuronal assemblies. Nat Rev Neurosci. 2008;9:910–9. doi: 10.1038/nrn2521. [DOI] [PMC free article] [PubMed] [Google Scholar]
- 6.Rector DM, Schei JL, Van Dongen HP, Belenky G, Krueger JM. Physiological markers of local sleep. Eur J Neurosci. 2009;29:1771–8. doi: 10.1111/j.1460-9568.2009.06717.x. [DOI] [PMC free article] [PubMed] [Google Scholar]
- 7.Woolsey TA, Van der Loos H. The structural organization of layer IV in the somatosensory region (SI) of mouse cerebral cortex. The description of a cortical field composed of discrete cytoarchitectonic units. Brain Res. 1970;17:205–42. doi: 10.1016/0006-8993(70)90079-x. [DOI] [PubMed] [Google Scholar]
- 8.Simpson GV, Knight RT. Multiple brain systems generating the rat auditory evoked potential I. Characterization of the auditory cortex response. Brain Res. 1993;602:240–50. doi: 10.1016/0006-8993(93)90689-k. [DOI] [PubMed] [Google Scholar]
- 9.Shaw NA. The temporal relationship between the brainstem and primary cortical auditory evoked potentials. Prog Neurobiol. 1995;47:95–103. doi: 10.1016/0301-0082(95)00021-m. [DOI] [PubMed] [Google Scholar]
- 10.Colrain IM, Campbell KB. The use of evoked potentials in sleep research. Sleep Med Rev. 2007;11:277–93. doi: 10.1016/j.smrv.2007.05.001. [DOI] [PMC free article] [PubMed] [Google Scholar]
- 11.Coenen AM, Drinkenburg WH. Animal models for information processing during sleep. Int J Psychophysiol. 2002;46:163–75. doi: 10.1016/s0167-8760(02)00110-1. [DOI] [PubMed] [Google Scholar]
- 12.Hall RD, Borbely AA. Acoustically evoked potentials in the rat during sleep and waking. Exp Brain Res. 1970;11:93–110. doi: 10.1007/BF00234203. [DOI] [PubMed] [Google Scholar]
- 13.Rector DM, Topchiy IA, Carter KM, Rojas MJ. Local functional state differences between rat cortical columns. Brain Res. 2005;1047:45–55. doi: 10.1016/j.brainres.2005.04.002. [DOI] [PubMed] [Google Scholar]
- 14.Massimini M, Rosanova M, Mariotti M. EEG slow (approximately 1 Hz) waves are associated with nonstationarity of thalamo-cortical sensory processing in the sleeping human. J Neurophysiol. 2003;89:1205–13. doi: 10.1152/jn.00373.2002. [DOI] [PubMed] [Google Scholar]
- 15.Timofeev I, Grenier F, Steriade M. Disfacilitation and active inhibition in the neocortex during the natural sleep-wake cycle: an intracellular study. Proc Natl Acad Sci U S A. 2001;98:1924–9. doi: 10.1073/pnas.041430398. [DOI] [PMC free article] [PubMed] [Google Scholar]
- 16.Rector DM, Schei JL, Rojas MJ. Mechanisms underlying state dependent surface-evoked response patterns. Neuroscience. 2009;159:115–26. doi: 10.1016/j.neuroscience.2008.11.031. [DOI] [PMC free article] [PubMed] [Google Scholar]
- 17.Barbato G, Barker C, Bender C, Giesen HA, Wehr TA. Extended sleep in humans in 14 hour nights (LD 10:14): relationship between REM density and spontaneous awakening. Electroencephalogr Clin Neurophysiol. 1994;90:291–7. doi: 10.1016/0013-4694(94)90147-3. [DOI] [PubMed] [Google Scholar]
- 18.Murphy PJ, Rogers NL, Campbell SS. Age differences in the spontaneous termination of sleep. J Sleep Res. 2000;9:27–34. doi: 10.1046/j.1365-2869.2000.00185.x. [DOI] [PubMed] [Google Scholar]
- 19.Steriade M, Timofeev I, Grenier F. Natural waking and sleep states: a view from inside neocortical neurons. J Neurophysiol. 2001;85:1969–85. doi: 10.1152/jn.2001.85.5.1969. [DOI] [PubMed] [Google Scholar]
- 20.Rector DM, George JS. Continuous image and electrophysiological recording with real-time processing and control. Methods. 2001;25:151–63. doi: 10.1006/meth.2001.1232. [DOI] [PubMed] [Google Scholar]
- 21.Arnaud C, Gandolfo G, Gottesmann C. The reactivity of the somesthetic S1 cortex during sleep and waking in the rat. Brain Res Bull. 1979;4:735–40. doi: 10.1016/0361-9230(79)90006-6. [DOI] [PubMed] [Google Scholar]
- 22.Scourse NJ, Hinde RA. Habituation to auditory stimuli in mice. Behaviour. 1973;47:1–13. doi: 10.1163/156853973x00247. [DOI] [PubMed] [Google Scholar]
- 23.Pedemonte M, Peña JL, Torterolo P, Velluti RA. Auditory deprivation modifies sleep in the guinea-pig. Neurosci Lett. 1997;223:1–4. doi: 10.1016/s0304-3940(97)13392-4. [DOI] [PubMed] [Google Scholar]


