SYNOPSIS
Objectives
Men who have sex with men (MSM) bear the greatest burden of human immunodeficiency virus (HIV)/acquired immunodeficiency syndrome (AIDS) in every state in the U.S., but their populations are poorly defined. We estimated and compared populations of MSM in 2007 by region, state, and race/ethnicity.
Methods
We averaged findings from two statistical models we had previously developed to estimate the total state-specific percentage and number of males who were MSM. The models were based, respectively, on state-specific rural/suburban/urban characteristics and an index using state-specific household census data on same-sex male unmarried partners. A third model, based on racial/ethnic ratios from a nationally representative behavioral survey, partitioned these statewide numbers by race/ethnicity.
Results
Of an estimated 7.1 million MSM residing in the U.S. in 2007, 71.4% (5.1 million) were white, 15.9% (1.1 million) were Hispanic, 8.9% (635,000) were black, 2.7% (191,000) were Asian, 0.4% (26,000) were American Indian/Alaska Native, 0.1% (6,000) were Native Hawaiian/other Pacific Islander, and 0.6% (41,000) were of multiple/unknown race/ethnicity. The overall U.S. percentage of males who were MSM (6.4%) varied from 3.3% in South Dakota to 13.2% in the District of Columbia, which we treated as a state. Estimated numbers of MSM ranged from 9,612 in Wyoming to 1,104,805 in California.
Conclusions.
Plausible estimates of MSM populations by state and race/ethnicity can inform and guide HIV/AIDS surveillance, allocation of resources, and advocacy. They can help in the planning, implementation, and evaluation of HIV prevention programs and other services. Using MSM numbers as denominators, estimates of population-based MSM HIV incidence, prevalence, and mortality rates could help clarify national and state-level epidemic dynamics. Until corroborated by other modeling and/or empirical research, these estimates should be used with caution.
Men who have sex with men (MSM) experience the greatest burden of human immunodeficiency virus (HIV)/acquired immunodeficiency syndrome (AIDS) of any behaviorally defined group in the U.S.1,2 A major HIV incidence study has shown a resurgence in the annual number of newly infected HIV cases among MSM in the country since the early 1990s,1 while incidence trends among injection drug users and high-risk heterosexuals have remained level or declined since 2000.3 There is a pressing need to estimate and characterize the sometimes marginalized and hidden populations of MSM, which give rise to the greatest number of incident and prevalent HIV infections. Assessments of community vulnerability, service coverage, and HIV prevention needs are informed by estimates of the numbers of MSM. Importantly, establishing plausible estimates of the numbers of MSM by state and race/ethnicity lays the groundwork for converting raw numbers of HIV infections and deaths among MSM to population-based HIV incidence, prevalence, and mortality rates. Racial/ethnic trends and disparities in the impact of HIV on MSM would, thus, be directly comparable within and across states.
Researchers have developed various study designs to conduct behavioral surveys estimating the size of MSM populations.4–9 Others have developed modeling methodologies based on HIV testing data,10 census data,10 statistical components,12 Internet convenience sampling,13 HIV/AIDS surveillance data,14–16 and a meta-analysis of key studies.17 However, until our recent study,18 which addressed the southern region of the U.S., no tool had been developed to create state-level MSM population estimates and stratify them by race/ethnicity.
In this article, we apply our recent MSM estimation methodology to the states in the other three regions of the country—the West, Midwest, and Northeast—also incorporating the findings for the South from our previous work for comparison. HIV/AIDS researchers, grant writers, health departments, policy makers, program managers, and advocates nationwide could gain substantial public health benefit from estimates of state- and racial/ethnic-specific MSM populations.
METHODS
Definition of MSM
We defined MSM as adult males aged ≥18 years with a lifetime history of any male-male sexual contact. We selected this broad, inclusive definition because we used data from a key national behavioral research study that similarly defined MSM.5 The definition was also similar to the broad Centers for Disease Control and Prevention (CDC) national HIV/AIDS surveillance definition of MSM (i.e., males with a history of male-male sexual contact after 1977, but preceding their first positive HIV antibody test or AIDS diagnosis).19 MSM who used injection drugs also were defined as MSM.
The methods for developing MSM population estimates by state and race/ethnicity have also been described previously.18 We had created two algebraic spreadsheet models (Models A and B) to estimate the state-specific numbers of MSM in the South in 2007, and a third Model C to partition these estimates by race/ethnicity.
Model A and Model B: statewide MSM estimates
In summary, Model A differentiated the southern states by the proportion of each state's total population residing in rural, suburban, and urban areas in the 2000 U.S. Census.20 The proportions residing in each geographic area were multiplied by estimates of the percentage of men who are MSM (referred to as the percentage MSM) in each geographic area (respectively, 1% rural, 4% suburban, and 9% urban), based on a nationally representative sample.7 These products were then summed to obtain the state-level percentage MSM estimates.
Model B differentiated the states by an “MSM Index,” which equaled the ratio of each state's proportion of same-sex male unmarried partner households in the U.S. to the state's proportion of households in the U.S., based on the U.S. Census Bureau's American Community Survey.21 (By definition, the MSM Index for the U.S. is 1.00.) Each state's MSM Index was multiplied by 6.0%, which was an estimated overall national percentage MSM found in the nationally representative National Survey of Family Growth (NSFG)5 to produce state-level percentage MSM estimates.
We combined (averaged) the percentage MSM estimates from the two state-level estimation models to obtain the final statewide percentage MSM estimates. We then multiplied the final statewide percentage MSM by the mid-year 2007 adult male population estimates for each state22 to obtain the estimated statewide numbers of MSM.
Model C: MSM estimates by state and race/ethnicity
We had devised Model C to partition the statewide MSM population estimates by race/ethnicity.18 Briefly, the model relied on nationally representative racial/ethnic percentage MSM estimates from the NSFG: 6.5% for white people, 5.0% for black people, 6.2% for Hispanic people, and 3.3% for those of all other races/ethnicities (i.e., American Indian/Alaska Native, Asian, Native Hawaiian/other Pacific Islander, and people of unknown or multiple race/ethnicity). The survey did not distinguish groups of all other races/ethnicities by individual racial/ethnic subcategory.5 Consequently, this model presumed that a history of male-male sexual contact in each state was most common among white people, followed by Hispanic, black, and all other people. Specifically, the state-specific black percentage MSM estimate was set as equal to 77% (5.0/6.5) of the white percentage MSM estimate, the Hispanic percentage MSM estimate was set as equal to 95% (6.2/6.5) of the white percentage MSM estimate, and the “all other” percentage MSM estimate was set as equal to 51% (3.3/6.5) of the white percentage MSM estimate. For example, among the 17 southern states the white and black percentage MSM estimates will vary, but the black percentage MSM is assumed to be 77% of the white percentage MSM in each state.
In Model C, the statewide total numbers of MSM were, thus, allocated algebraically in such a way that the black, Hispanic, and all other percentage MSM estimates were always equal, respectively, to 77%, 95%, and 51% of the state-specific white percentage MSM estimate. For example, from our previous article,18 the overall estimated percentage of adult MSM in Florida was 7.5%, according to the combined mean of Model A and Model B estimates. When 7.5% was multiplied by the total adult male population, the total number of MSM was 517,299. To preserve the three proportions in our allocation equation (77%, 95%, and 51%), we determined the numbers of MSM by race/ethnicity to be 348,043 for white people, 54,717 for black people, 105,688 for Hispanic people, and 8,851 for all other populations. Dividing these numbers by the respective adult male populations thus resulted in aligning the percentage MSM estimates with the three required proportional relationships: the white percentage MSM in Florida was 7.9%, and the percentage MSM was 6.1% for black people (0.77 × 7.9%), 7.6% for Hispanic people (0.95 × 7.9%), and 4.0% for all others (0.51 × 7.9%). In our previous article, we thoroughly examined the assumptions and limitations of the MSM population estimates derived from the three models.18
Sensitivity analysis
We identified states where the difference between the Model A and Model B statewide percentage MSM estimates was substantial and in the opposite direction of the general trend. In the sensitivity analysis, we disregarded the estimate considered to be less plausible and set the percentage MSM equal to the other model's value in each of these states. We then evaluated the impact on the estimated numbers of MSM at the state, regional, and national levels. We did this for white, black, and Hispanic people only, as the number of MSM in each of the three states whose data were reanalyzed was <100 for all those of other races/ethnicities.
Data analysis
We obtained state-specific, mid-year population estimates for 2007 from the U.S. Census Bureau for males aged ≥18 years, by race/ethnicity.22 We computed Pearson correlation coefficients using Microsoft® Excel and conducted tests for statistical significance using R software version 2.5.1.23
RESULTS
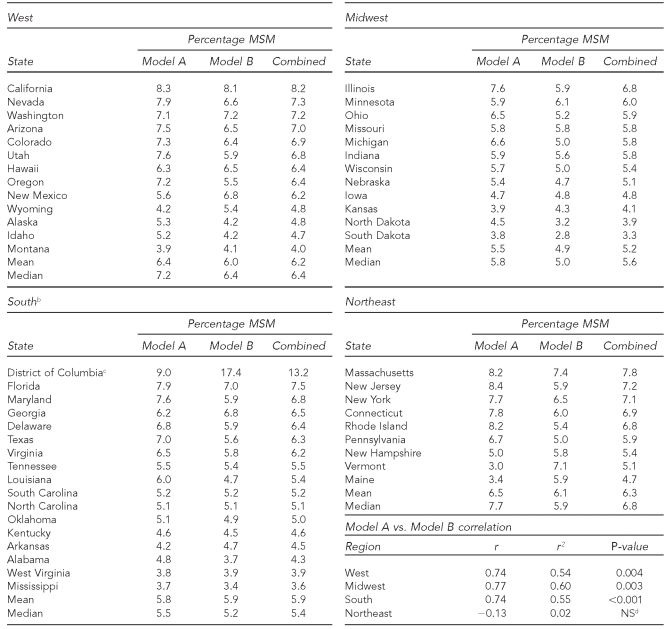
The combined statewide estimated percentage MSM varied considerably within each region (Table 1). The percentage MSM estimates ranged from 4.0% (Montana) to 8.2% (California) in the West; 3.3% (South Dakota) to 6.8% (Illinois) in the Midwest; 3.6% (Mississippi) to 13.2% (District of Columbia [DC], which is treated as a state) in the South; and 4.7% (Maine) to 7.8% (Massachusetts) in the Northeast. The percentage MSM estimates according to Model A and Model B were strongly correlated in the West (r=0.74, r2=0.54, p=0.004), the Midwest (r=0.77, r2=0.60, p=0.003), and the South (r=0.74, r2=0.55, p<0.001). The Northeast was unique, with a near-zero correlation (r=−0.13, r2=0.02, p≥0.05). Mean and median percentage MSM estimates for the two statewide estimation models were comparable in the West, Midwest, and South, but the median percentage MSM in the Northeast was much higher per Model A (7.7%) than Model B (5.9%). The Midwest had the lowest combined mean percentage MSM estimate (5.2%) while the South had the lowest combined median percentage MSM estimate (5.4%). The Northeast had the highest combined mean and median percentages MSM (6.3% and 6.8%, respectively), followed closely by the West (6.2% and 6.4%, respectively).
Table 1.
Estimated percentage of adult males (≥18 years of age) who are MSM, by region and state, U.S., 2007a
aWithin each region, the states are ranked from highest to lowest combined (averaged) percentage MSM.
bMSM estimates for the South are from Lieb S, Thompson DR, Misra S, Gates GJ, Duffus WA, Fallon SJ, et al. Estimating populations of men who have sex with men in the southern United States. J Urban Health 2009;86:887-901.
cDistrict of Columbia is treated as a state.
dp≥0.05
MSM = men who have sex with men
NS = not significant
Note: Model A differentiated the states according to the proportion of the overall MSM population residing in rural (1%), suburban (4%), and urban (9%) areas, multiplied by the percentage MSM estimate in each respective geographic area, based on a nationally representative sample. (See: Laumann EO, Gagnon JH, Michael RT, Michaels S. The social organization of sexuality: sexual practices in the United States. Chicago: University of Chicago Press; 1994.) Model B differentiated the states according to an MSM Index. The Index equaled the ratio of each state's proportion of same-sex male unmarried partners' households in the U.S. to the state's proportion of households in the U.S. (See: Census Bureau [US]. American Community Survey, 2005–2007cited 2009 Jan 3. Available from: URL: http://factfinder.census.gov/servlet/DatasetMainPageServlet?_program=ACS&_submenuId=&_lang=en&_ts=.) Each state's MSM Index was multiplied by 6.0%, which was an estimated overall national percentage MSM found in another nationally representative sample. (See: Mosher WD, Chandra A, Jones J. Sexual behavior and selected health measures: men and women 15–44 years of age, United States, 2002. Adv Data 2005;362:1-56.)
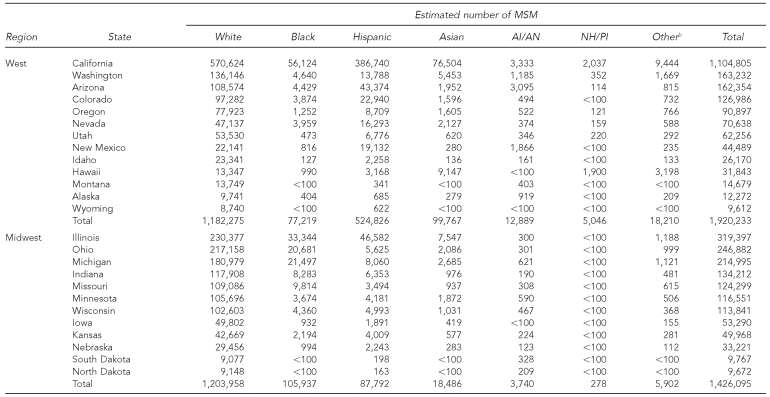
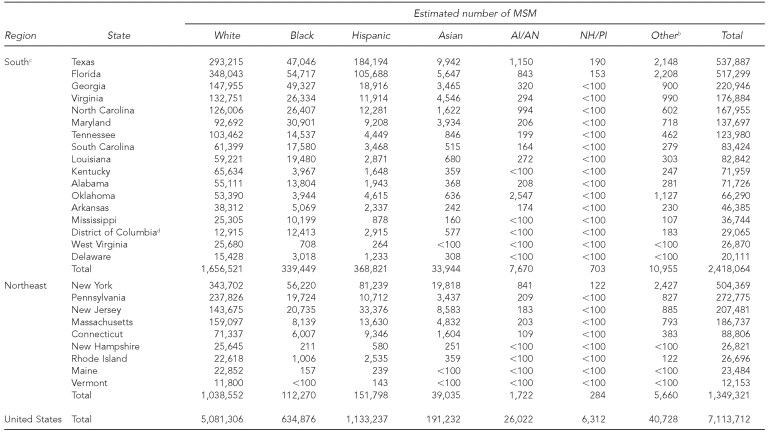
Nationally, the estimates indicated that a total of 7,113,712 MSM resided in the U.S. in 2007 (Table 2). Regionally, 34.0% of the MSM resided in the South, 27.0% in the West, 20.0% in the Midwest, and 19.0% in the Northeast. California, ranked first in total population,22 had the greatest estimated total number of MSM (1,104,805) and the greatest estimated number of MSM in each racial/ethnic group. Texas (second in total population) and Florida (fourth in total population) had the next highest total estimated numbers of MSM (537,887 and 517,299, respectively). New York, ranked third in total population, was ranked fourth in estimated number of MSM (504,369), followed by Illinois (319,397). Three states had fewer than 10,000 estimated total MSM (North Dakota, South Dakota, and Wyoming). In the West, white and Hispanic MSM each greatly outnumbered black MSM in every state, largely a reflection of the relatively small total population of adult black males throughout the region.22
Table 2.
Estimated number of MSM (≥18 years of age), by region, state, and race/ethnicity, U.S., 2007a
aWithin each region, the states are ranked from highest to lowest total number of MSM.
bOther includes those of unknown or multiple race/ethnicity.
cMSM estimates for the South are from Lieb S, Thompson DR, Misra S, Gates GJ, Duffus WA, Fallon SJ, et al. Estimating populations of men who have sex with men in the southern United States. J Urban Health 2009;86:887-901.
dDistrict of Columbia is treated as a state.
MSM = men who have sex with men
AI/AN = American Indian/Alaska Native
NH/PI = Native Hawaiian/other Pacific Islander
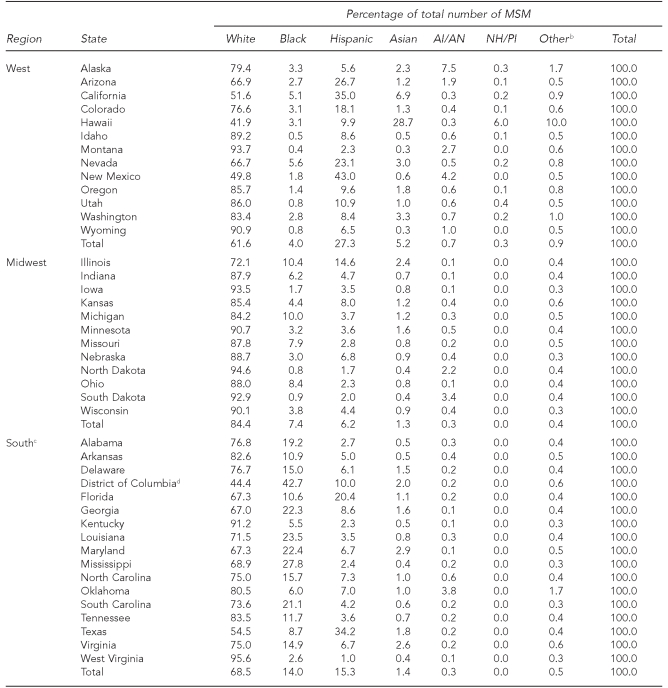
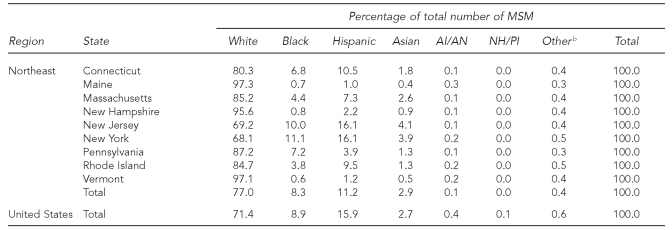
Of the estimated 7.1 million MSM in the U.S., 71.4% were white, 15.9% were Hispanic, 8.9% were black, 2.7% were Asian, 0.1% were Native Hawaiian/other Pacific Islander, 0.4% were American Indian/Alaska Native, and 0.6% were of unknown or multiple race/ethnicity (Table 3). The Midwest had the highest proportion of white MSM (84.4%). By contrast, white MSM comprised 77.0% of the total estimated MSM in the Northeast, 68.5% in the South, and 61.6% in the West (U.S. total = 71.4%). Black MSM accounted for 14.0% of all MSM in the South, followed by those in the Northeast (8.3%), Midwest (7.4%), and West (4.0%) (U.S. total = 8.9%). The estimated proportion of all MSM among Hispanic people was particularly high in the West (27.3%) compared with the South (15.3%), Northeast (11.2%), and Midwest (6.2%) (U.S. total = 15.9%). Asian MSM accounted for 5.2% of all MSM in the West, 2.9% in the Northeast, 1.4% in the South, and 1.3% in the Midwest (U.S. total = 2.7%). Nationwide, American Indian/Alaska Native MSM, Native Hawaiian/other Pacific Islander MSM, and MSM of unknown or multiple races each comprised <1.0% of all MSM.
Table 3.
Racial/ethnic percentage distribution of estimated number of MSM (≥18 years of age), by region and state, U.S., 2007a
aThe states are shown in alphabetical order, by region.
bOther includes those of unknown or multiple race/ethnicity.
cMSM estimates for the South are from Lieb S, Thompson DR, Misra S, Gates GJ, Duffus WA, Fallon SJ, et al. Estimating populations of men who have sex with men in the southern United States. J Urban Health 2009;86:887-901.
dDistrict of Columbia is treated as a state.
MSM = men who have sex with men
AI/AN = American Indian/Alaska Native
NH/PI = Native Hawaiian/other Pacific Islander
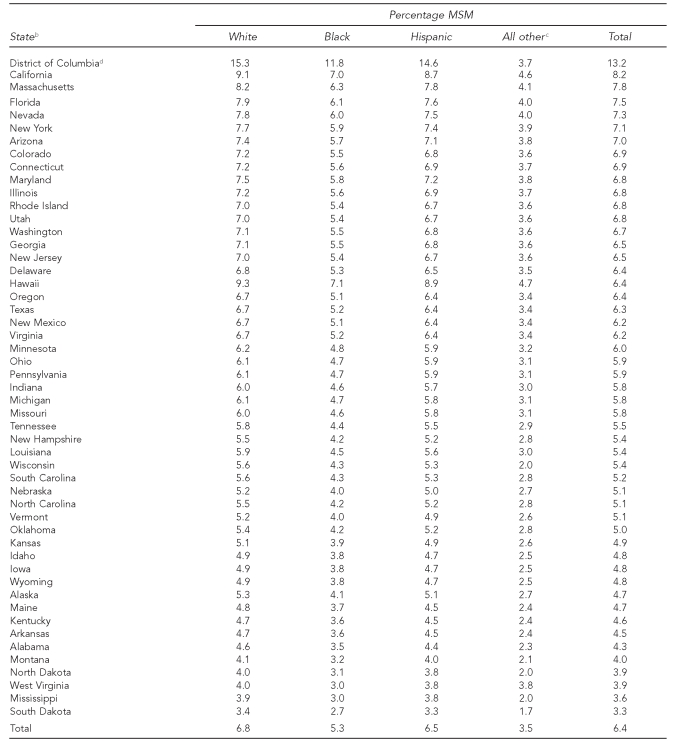
Nationally, an estimated 6.4% of the adult male population was MSM (Table 4). This estimate was 6.8% for white MSM, 5.3% for black MSM, 6.5% for Hispanic MSM, and 3.5% for MSM in all other racial/ethnic categories. Across the 50 U.S. states and DC, there was considerable variability in the racial/ethnic-specific estimated percentage of adult males who were MSM. In accordance with the premise of Model C, in each state the white percentage MSM estimate was slightly greater than the Hispanic one, which was somewhat greater than the black one, which in turn was somewhat greater than the one for those of all other races/ethnicities.
Table 4.
Estimated percentage of adult males (≥18 years of age) who are MSM, by statea and race/ethnicity, U.S., 2007
aThe states are ranked from highest to lowest total percentage MSM.
bMSM estimates for southern states are from Lieb S, Thompson DR, Misra S, Gates GJ, Duffus WA, Fallon SJ, et al. Estimating populations of men who have sex with men in the southern United States. J Urban Health 2009;86:887-901.
cAll other includes MSM of all other races/ethnicities (i.e., Asian, Native Hawaiian/Pacific Islander, American Indian/Alaska Native, and those ofunknown or multiple race/ethnicity).
dDistrict of Columbia is treated as a state.
MSM = men who have sex with men
Sensitivity analysis
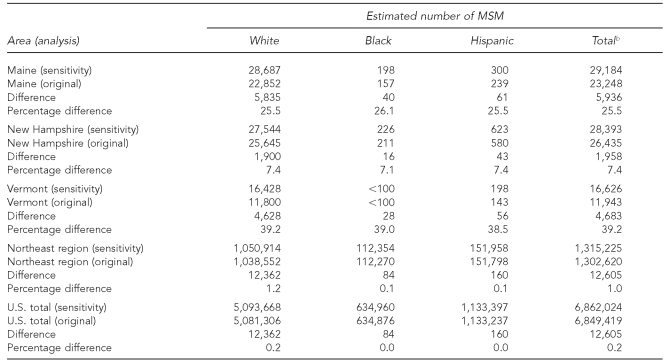
A high proportion of the total population resided in rural areas of three states in the New England section of the Northeast: Vermont (61.8%), Maine (59.8%), and New Hampshire (40.7%).20 These states also distinctly lacked racial/ethnic diversity among the estimated MSM populations: white MSM comprised 97.3% of all MSM in Maine, 97.1% in Vermont, and 95.6% in New Hampshire (Table 3). The Model A percentage MSM estimates in these three states were considerably lower than the Model B estimates, which was the opposite of the trend in virtually all other states (Table 1). The degree of rurality brought down the Model A estimates. In the sensitivity analysis, the statewide percentage estimates for each of these three states were set as equal to the Model B estimates, under the assumption that the Model B findings (derived from data on same-sex male unmarried partners) were more plausible. The recomputed estimated numbers of MSM increased approximately 26% in Maine, 7% in New Hampshire, and 39% in Vermont, overall and by race/ethnicity (Table 5). The effect on the total estimated number of MSM in the Northeast (1.0% increase overall) and the U.S. (0.2% increase overall) was minimal.
Table 5.
Estimated number of white, black, and Hispanic MSM (≥18 years of age): original analysis and sensitivity analysis for Maine, New Hampshire, Vermont, Northeast region, and the U.S.a
aIn the original analysis, the statewide combined percentage MSM equaled the average of Model A and Model B estimates for each state. In the sensitivity analysis, the percentage MSM equaled the Model B estimate for these three states.
bTotals exclude MSM of all other races/ethnicities (i.e., Asian, Native Hawaiian/other Pacific Islander, American Indian/Alaska Native, and unknown or multiple race/ethnicity).
MSM = men who have sex with men
DC was also a possible outlier in that the Model B percentage MSM estimate (17.4%) was considerably higher than the Model A estimate (9.0%) (Table 1). The combined percentage MSM estimate for DC (13.2%) was also far higher than the next highest estimate in the U.S. (8.2% in California). When DC was removed from the data, the correlation of the Model A and Model B estimates for the South increased from r=0.74 (r2=0.55, p<0.001) to r=0.85 (r2=0.72, p<0.001).
DISCUSSION
Estimates of the numbers of MSM by region, state, and race/ethnicity help characterize the populations that give rise to HIV/AIDS cases among the most impacted behavioral risk group in the U.S. The estimates can inform and guide HIV/AIDS surveillance, allocation of resources, and advocacy, as well as help in the planning, implementation, and evaluation of HIV prevention programs and other services. These public health activities would be enhanced when the MSM numbers are used as denominators to compute population-based HIV incidence, prevalence, and mortality rate estimates among MSM, as has been recently done in our study of MSM in Florida.24 That study quantified marked racial/ethnic disparities in the impact of HIV on our previously established statewide MSM populations, according to each of these three measures.
Here, we have estimated that the nation was home to some 7.1 million MSM in 2007, or 6.4% of the U.S. male population aged ≥18 years. The distribution of the MSM estimates by state and race/ethnicity showed considerable variation in the numbers and percentages of adult males who are MSM. While the South had the greatest total estimated number of MSM, the Northeast appeared to have the highest percentage MSM. The racial/ethnic MSM profiles largely reflected the general demographic composition of the male populations of the various states. Regional differences in degree of gay-friendliness and social, political, or religious attitudes toward homosexual people and MSM, as well as underlying stigma and homophobia, could influence the percentage MSM estimates in ways that are difficult to quantify. HIV/AIDS deaths among MSM would be a quantifiable outcome variable influencing the numbers of MSM, though mortality data are not readily available by state, HIV transmission category, and race/ethnicity.
In our study, there were strong, positive correlations between the Model A and Model B estimated percentages of adult males who were MSM in the West (p=0.004), Midwest (p=0.003), and South (p<0.001). For most of the U.S., it is suggested that the two models might be measuring the same thing. Mean and median percentage MSM estimates were also similar in these three regions, further justifying taking their means as final estimates. In the nine states of the Northeast, certain incongruent findings per Models A and B and the absence of a significant correlation warrant special attention.
Several studies have suggested a higher percentage of males who are MSM reside in gay-friendly urban vs. rural settings.7,11,25 Rural MSM can be geographically isolated from gay culture centers and lack venues in which to interact with potential sex partners, although the Internet has recently provided other opportunities for rural MSM to meet other MSM.26,27 Statistically, rural populations exert a downward pressure on the Model A statewide MSM population estimates.
According to statewide HIV/AIDS coordinators in Maine and New Hampshire (Personal communication, Robert Funa, Maine Department of Health and Human Services, October 2009; and Heather Barto, State of New Hampshire Department of Health and Human Services, September 2009) and the Executive Director of Outright Vermont, a statewide gay and lesbian community-based/advocacy organization (Personal communication, Christopher Neff, Outright Vermont, October 2009), the tristate area is home to more MSM than would be expected for states with such high proportions of the total population residing in rural areas. Apparently, these three northeastern states are particularly gay-friendly, with visible gay centers in the larger cities and on many small-town university and college campuses throughout the area. There could be other local sociocultural factors tending to increase MSM populations in the rural areas. For several reasons, these three states could thus be outliers in Model A, resulting in underestimates of the combined (averaged) percentage MSM. Empirical behavioral research could help verify the possibility that the Model A estimates were implausibly low, and that the Model B estimates (based on same-sex male unmarried partner households) were closer to the actual situation in these northeastern states.
In the meantime, in the sensitivity analysis, we disregarded the Model A estimates for Maine, New Hampshire, and Vermont and made the assumption that their percentage MSM estimates could be as high as the Model B findings. We found that the impact on the total numbers of MSM by race/ethnicity for the Northeast and the U.S. was minimal. This suggests a certain robustness to the estimates at the regional and national level if Model A does not apply well to these three states. For DC, which was the other possible outlier in our data, the high combined (averaged) percentage MSM estimate (13.2%) was comparable to an estimate in a New York City behavioral survey (13.7%).8
Despite the lack of a significant correlation between the Model A and Model B estimates in the Northeast overall, we combined the statewide estimates for the other six states in the region (Connecticut, Massachusetts, New Jersey, New York, Pennsylvania, and Rhode Island), where the trend in the Model A and Model B estimates was in the same direction as that in virtually all states in the other three regions of the U.S. Using two estimates reduced standard error and introduced at least some degree of error reduction through compensating errors. Therefore, where we did not know which of the estimates was more accurate, it made sense to combine them.
Limitations
There were several limitations to our findings, many of which were described in our previous article.18 We suggest that caution be used in applying these point estimates of the percentages and numbers of MSM in the nation. Plausible ranges or confidence limits around the point estimates could not be established. Corroboration of the estimates via further modeling and/or empirical research is needed.
There is no gold standard for constructing estimates of the percentage and number of MSM in male populations. The underlying assumptions made in the three models remain to be validated. In particular, they each rely on the prevalence of sexual behavior derived from representative samples at the national level. Representative behavioral surveys of the prevalence of having a history of male-male sexual contact have not been systematically conducted at the state level. Applying the national data to the states' estimates via statistical modeling, as we have done, could have resulted in error.
The time period of the various source behavioral surveys differed, and having a history of male-male sexual contact might have changed over time. Perhaps most of all, ascertainment bias in such surveys results in an underestimation of the percentage and number of MSM, because some men do not disclose a history of male-male sexual contact. In particular, minority MSM tend to be misidentified as heterosexuals to a greater extent than white MSM,28–32 producing what could be underestimates of their MSM population size and corresponding overestimates of HIV prevalence rates, once analyzed.
Model A was based on only a single study, and presumed that for all states the overall percentage MSM varied according to the total populations residing in rural, suburban, and urban geographic areas.7 These percentages likely vary by state and could have changed over time. Model B assumed that the MSM Index was an indicator of the relative concentration of MSM in the states, and was also based on only a single study.21 An underlying assumption of this model, which relies on census data on same-sex male unmarried partners, is that numerous gay-identified individuals or other MSM are included in these partnerships. At present, there is no adequate way to validate this assumption.
Model C, which partitioned the combined statewide percentage MSM estimates by race/ethnicity, was based on data from the NSFG. The ratios we calculated from the survey were assumed to apply uniformly to each state. The accuracy of the racial/ethnic-specific estimates according to Model C depends on them aligning in the same proportions across all states (i.e., the percentage MSM among black, Hispanic, and all other males was assumed to be the same for all states at 77%, 95%, and 51%, respectively, of the white percentage MSM estimate). However, our MSM population estimates may fail to capture variability related to visible gay-friendliness and other characteristics of various localities that could differentially influence the occurrence or disclosure of male-male sexual contact by race/ethnicity. For example, variability in a given city's gay-friendliness might produce differential willingness among white men to disclose same-sex behavior. The states cannot be assumed to be monolithic in their acceptance of gay men or non-gay-identified MSM. Thus, within a given geographic area, racial/ethnic groups of MSM might experience differences in the nature and level of stigmatizing and inhibiting attitudes. As such, a lingering challenge is to find ways to take these underlying factors into account for the various cities and other geographic areas.
Finally, by definition, our MSM estimates captured experimenters and those without ongoing male-male sexual contact, as do CDC national HIV/AIDS surveillance data.20 The time period for such contact is broad, as is that of the CDC data. The type of sexual contact (e.g., oral or anal) is not specified in either our or CDC's definition. Thus, our estimates were higher than those that would be based on recent male-male sexual contact of a specified type, but the numerators and denominators of computed HIV rates essentially would be comparable.
CONCLUSIONS
Our MSM population estimates for the U.S. by state and race/ethnicity are a meaningful beginning. They could help provide a foundation for numerous public health purposes such as (1) gaining a sense of scale of those populations at greatest risk for HIV/AIDS, (2) targeting resources for HIV prevention, (3) assessing service coverage and community vulnerability, and (4) writing grants and conducting other research. Further, MSM HIV incidence, prevalence, and deaths could be divided by the MSM population estimates to produce population-based rate estimates by race/ethnicity, thereby enabling evaluation of disparities. A distinct advantage of constructing the MSM estimates as we did is that it involved little expense and complexity. Our study could stimulate the development of new estimation models and empirical research to help refine the national, regional, and statewide MSM population estimates. In the interim, these MSM estimates could readily help clarify HIV epidemic dynamics within and across the country's states and regions.
Acknowledgments
The authors gratefully acknowledge Mary Beth Zeni, ScD, Dano R. Beck, MSW, and Mary Jo Trepka, MD, MSPH, for their comments on the article.
The contents of this article are solely the responsibility of the authors and do not necessarily represent the official views of NIDA.
Footnotes
Samuel Friedman's contribution was supported by National Institute on Drug Abuse (NIDA) grant #R01 DA13336, Community Vulnerability and Responses to Drug-User-Related HIV/AIDS.
REFERENCES
- 1.Campsmith ML, Rhodes P, Hall HI, Green T. HIV prevalence estimates—United States, 2006. JAMA. 2009;301:27–9. [Google Scholar]
- 2.Centers for Disease Control and Prevention (US). HIV/AIDS surveillance report, 2006. Vol. 18. Rockville (MD): Department of Health and Human Services (US); 2008. [Google Scholar]
- 3.Hall HI, Song R, Rhodes P, Prejean J, An Q, Lee LM, et al. Estimation of HIV incidence—United States. JAMA. 2008;300:520–9. doi: 10.1001/jama.300.5.520. [DOI] [PMC free article] [PubMed] [Google Scholar]
- 4.Binson D, Michaels S, Stall R, Coates TJ, Gagnon JH, Catania JA. Prevalence and social distribution of men who have sex with men: United States and its urban centers. J Sex Res. 1995;32:245–54. [Google Scholar]
- 5.Mosher WD, Chandra A, Jones J. Sexual behavior and selected health measures: men and women 15–44 years of age, United States, 2002. [cited 2009 Jan 3];Adv Data. 2005 362:1–56. Also available from: URL: http://www.cdc.gov/nchs/data/ad/ad362.pdf. [PubMed] [Google Scholar]
- 6.Janus SS, Janus CL. The Janus report on sexual behavior. New York: John Wiley & Sons; 1993. [Google Scholar]
- 7.Laumann EO, Gagnon JH, Michael RT, Michaels S. The social organization of sexuality: sexual practices in the United States. Chicago: University of Chicago Press; 1994. [Google Scholar]
- 8.Manning SE, Thorpe LE, Ramaswamy C, Hajat A, Marx MA, Karpati AM, et al. Estimation of HIV prevalence, risk factors, and testing frequency among sexually active men who have sex with men, aged 18–64 years—New York City, 2002. J Urban Health. 2007;84:212–25. doi: 10.1007/s11524-006-9135-5. [DOI] [PMC free article] [PubMed] [Google Scholar]
- 9.Catania JA, Osmond D, Stall RD, Pollack L, Paul JP, Blower S, et al. The continuing epidemic among men who have sex with men. Am J Public Health. 2001;91:907–14. doi: 10.2105/ajph.91.6.907. [DOI] [PMC free article] [PubMed] [Google Scholar]
- 10.Archibald CP, Jayaraman GC, Major C, Patrick DM, Houston SM, Sutherland D. Estimating the size of hard-to-reach populations: a novel method using HIV testing data compared to other methods. AIDS. 2001;15(Suppl 3):S41–8. doi: 10.1097/00002030-200104003-00006. [DOI] [PubMed] [Google Scholar]
- 11.Black D, Gates GJ, Sanders S, Taylor L. Demographics of the gay and lesbian population in the United States: evidence from available systematic data sources. Demography. 2000;37:139–54. [PubMed] [Google Scholar]
- 12.Holmberg SD. The estimated prevalence and incidence of HIV in 96 large US metropolitan areas. Am J Public Health. 1996;86:642–54. doi: 10.2105/ajph.86.5.642. [DOI] [PMC free article] [PubMed] [Google Scholar]
- 13.Marcus U, Schmidt AJ, Hamouda A, Bochow M. Estimating the regional distribution of men who have sex with men (MSM) based on Internet surveys. BMC Public Health. 2009;9:180–8. doi: 10.1186/1471-2458-9-180. [DOI] [PMC free article] [PubMed] [Google Scholar]
- 14.Lieb S, Friedman SR, Zeni MB, Chitwood DD, Liberti TM, Gates GJ, et al. An HIV prevalence-based model for estimating risk populations of injection drug users and men who have sex with men. J Urban Health. 2004;81:401–15. doi: 10.1093/jurban/jth126. [DOI] [PMC free article] [PubMed] [Google Scholar]
- 15.Lieb S, Trepka MJ, Thompson DR, Arons P, Liberti T, Maddox L, et al. Men who have sex with men: estimated population sizes and mortality rates, by race/ethnicity, Miami-Dade County, Florida. J Acquir Immune Defic Syndr. 2007;46:485–90. doi: 10.1097/qai.0b013e3181594c4d. [DOI] [PubMed] [Google Scholar]
- 16.Lieb S, Arons P, Thompson DR, Santana AM, Liberti TM, Maddox L, et al. Men who have sex with men: racial/ethnic disparities in estimated HIV/AIDS prevalence at the state and county level, Florida. AIDS Behav. 2009;13:716–23. doi: 10.1007/s10461-008-9411-3. [DOI] [PubMed] [Google Scholar]
- 17.Purcell DW, Johnson C, Lansky A, Prejean A, Stein R, Denning P, et al. Calculating HIV and syphilis rates for risk groups: estimating the national population size of men who have sex with men. Presented at the National STD Prevention Conference; 2010 Mar 10; Atlanta. [Google Scholar]
- 18.Lieb S, Thompson DR, Misra S, Gates GJ, Duffus WA, Fallon SJ, et al. Estimating populations of men who have sex with men in the southern United States. J Urban Health. 2009;86:887–901. doi: 10.1007/s11524-009-9401-4. [DOI] [PMC free article] [PubMed] [Google Scholar]
- 19.Centers for Disease Control and Prevention (US). Adult HIV/AIDS confidential case report. Form CDC. 2003;50:42A. [Google Scholar]
- 20.Census Bureau (US). 2000 Census, summary file 1, table: urban and rural. [cited 2009 Jan 3]. Available from: URL: http://factfinder.census.gov.
- 21.Census Bureau (US). American Community Survey, 2005–2007. [cited 2009 Jan 3]. Available from: URL: http://factfinder.census.gov/servlet/DatasetMainPageServlet?_program=ACS&_submenuId=&_lang=en&_ts=
- 22.Census Bureau (US). Midyear 2007 population estimates. [cited 2009 Jan 3]. Available from: URL: http://www.census.gov/popest/datasets.html.
- 23.R Development Core Team. R: Version 2.5.1. Vienna: R Development Core Team; 2009. [Google Scholar]
- 24.Lieb S, White S, Grigg BL, Thompson DR, Liberti TM, Fallon SJ. Estimated HIV incidence, prevalence, and mortality rates among racial/ethnic populations of men who have sex with men, Florida. J Acquir Immune Defic Syndr. 2010;54:398–405. doi: 10.1097/QAI.0b013e3181d0c165. [DOI] [PubMed] [Google Scholar]
- 25.Black D, Gates GJ, Sanders S, Taylor L. Why do gay men live in San Francisco? J Urban Econ. 2002;51:54–76. [Google Scholar]
- 26.Bowen AM, Williams ML, Daniel CM, Clayton S. Internet based HIV prevention research targeting rural MSM: feasibility, acceptability, and preliminary efficacy. J Behav Med. 2008;31:463–77. doi: 10.1007/s10865-008-9171-6. [DOI] [PMC free article] [PubMed] [Google Scholar]
- 27.Horvath KJ, Bowen AM, Williams ML. Virtual and physical venues as contexts for HIV risk among rural men who have sex with men. Health Psychol. 2006;25:237–42. doi: 10.1037/0278-6133.25.2.237. [DOI] [PubMed] [Google Scholar]
- 28.Nyblade LC. Measuring HIV stigma: existing knowledge and gaps. Psychol Health Med. 2006;11:335–45. doi: 10.1080/13548500600595178. [DOI] [PubMed] [Google Scholar]
- 29.Pathela P, Hajat A, Schillinger J, Blank S, Sell R, Mostashari F. Discordance between sexual behavior and self-reported sexual identity: a population-based survey of New York City men. Ann Intern Med. 2006;145:416–25. doi: 10.7326/0003-4819-145-6-200609190-00005. [DOI] [PubMed] [Google Scholar]
- 30.Mays VM, Cochran SD, Zamudio A. HIV prevention research: are we meeting the needs of African American men who have sex with men? J Black Psychol. 2004;30:78–105. doi: 10.1177/0095798403260265. [DOI] [PMC free article] [PubMed] [Google Scholar]
- 31.Kennamer JD, Honnold J, Bradford J, Hendricks M. Differences in disclosure of sexuality among African American and white gay/bisexual men: implications for HIV/AIDS prevention. AIDS Educ Prev. 2000;12:519–31. [PubMed] [Google Scholar]
- 32.HIV/STD risks in young men who have sex with men who do not disclose their sexual orientation—six U.S. cities, 1994–2000. MMWR Morb Mortal Wkly Rep. 2003;52(5):81–5. [PubMed] [Google Scholar]


