Abstract
Outbred mice traditionally are considered to display high variability, thereby limiting their use in some studies. Researchers frequently are encouraged to use inbred strains of mice because of the greater homogeneity of these experimental animals. We compared the pulmonary inflammatory response of inbred BALB/cJ mice to that of outbred HSD-ICR mice by measuring multiple variables, including cytokines, chemokines, number of pulmonary inflammatory cells, and respiratory parameters. Cockroach allergens induced significant pulmonary inflammation in both BALB and ICR mice. Our comparisons of the coefficients of variance for 148 discrete data sets for each strain or stock indicated that BALB and ICR mice have roughly equivalent intrastrain or -stock variability in our model of asthma-like pulmonary inflammation. The average coefficient of variance, calculated as the ratio of the SD to the mean of a data set, was 0.35 ± 0.34 for BALB mice compared with 0.31 ± 0.32 for ICR mice. In conclusion, inbred BALB and outbred ICR mice have roughly equivalent intrastrain or -stock variability in a murine model of asthma-like pulmonary inflammation.
Abbreviations: BAL, bronchoalveolar lavage; CRA, cockroach allergen; MV, minute ventilation
Mouse models of human disease have been invaluable for the advancement of medical science. These experimental animals have been characterized extensively and are relatively similar to humans in their inflammatory reactions. Hundreds of inbred strains and outbred stocks have been developed from the largely wildtype stocks that were originally available to scientists.2,6,34 Since the introduction of inbred strains, researchers have faced the question of which mice to use to optimally conduct their research. Inbred strains offer a defined genetic background, whereas outbred stocks offer a diverse gene pool, which is closer to the situation in most human studies, and a lower cost per animal.
Originally, inbred strains were considered to be more variable than their outbred counterparts because their homogeneous genetic background was thought to provide them with a limited repertoire of responses.5,22 A 1976 study5 questioned these early results and became widely cited by researchers favoring inbred strains. Now, most investigators believe that inbred mice are superior models because phenotypic variability might be lessened by a consistent genetic background. This characteristic was believed to increase the power of any given study so that it would be less time-intensive and consume fewer experimental animals.7,8 Because of the wide variety of inbred animals that are available, mice with well-defined response characteristics can be selected to meet a researcher's specific needs. In addition, this uniform genetic background allows for tissue transplantation, adoptive transfer, and genetic and transgenic manipulations.27-29,34
Conversely, outbred mice have unpredictable genotypes and therefore are expected to have a diverse population of phenotypes.5,8 The use of outbred stocks has been advocated by those seeking to uncover universal effects in a genetically diverse cohort of mice, because this situation is expected to produce results more applicable to the human population.20,23 Critics hold that the wide variability present in outbred mice is detrimental to statistical power and that a genetically diverse background could be obtained by using multiple, well-characterized inbred strains.5,8,34 Therefore, current opinion holds that outbred stocks are suitable for designing new models, toxicology research, and identifying quantitative trace loci and that they are unsuitable for more targeted studies.
Interestingly, despite this common assertion that outbred mice are ‘too variable’ for use in most research, few publications actually have investigated the degree of variability in a common outbred stock compared with a common inbred strain.5,22,23 In fact, the presumption that outbred mice are highly heterogeneous is largely based on studies of phenotypes that are highly dependent on genetic background, such as mandible shape.5,14
To evaluate the suitability of using outbred mice for targeted studies using modern investigative techniques, we decided to compare a commonly used inbred mouse strain (BALB/cJ) with a commonly used outbred mouse stock (HSD-ICR[CD1]) in our mouse model of cockroach allergen (CRA)-induced inflammatory airways disease. To accomplish this aim, we collected data relating to numerous facets of the inflammatory response. We used these data to compare the coefficient of variance for each of the data parameters between the BALB and ICR mice to determine whether the outbred stock was indeed more variable than the inbred strain in our model.
Materials and Methods
Animals.
All experiments were performed with prior approval from our IACUC and the Boston University Laboratory Animal Science Center. Mice were housed 4 to a cage in a positive-pressure environment to minimize exposure to untreated air. Humidity and temperature were controlled rigorously, and the mice experienced a 12:12-h light:dark cycle. Mice received daily wellbeing checks (observed activity levels, weights), biweekly cage changes, and weekly animal checks. All handlers wore gloves, smock, shoe covers, face mask, and eye shields. Experimental animals were fed irradiated mouse diet (Harlan Laboratories, Indianapolis, IN).
Allergen sensitization.
CRA was purchased (Greer Laboratories, Lenoir, NC) as a lyophilized whole body extract of the German cockroach, Blattella germanica. CRA was reconstituted in sterile PBS, and the concentrations of the components Blag1 and Blag2 were assayed by ELISA. The concentration of the solution was adjusted so that 50 μL contained 8 μg combined Blag1 and Blag2. The immunization dose (day 0) and 2 challenge doses (days 14 and 21) were delivered intratracheally by direct pharyngeal delivery; the dose subsequently was inhaled.9 Briefly, each mouse was suspended by its front incisors on an incline board, its tongue was pulled gently forward, and the CRA solution was placed at the back of the pharynx in two 25-μL aliquots for aspiration. The immunization dose was a 1:2 dilution of the stock solution, and the challenge doses each was a 1:4 dilution containing 4 μg Blag1 and 2 μg Blag2. Naïve control mice received no CRA challenges. The 0-h mice received 2 intratracheal challenges of CRA and subsequently were assayed and euthanized when they were scheduled to receive their final allergen challenge, that is, they did not receive the third challenge. The 1.5- and 24-h mice received the full set of 3 challenges and were assayed and euthanized at 1.5 and 24 h after final challenge, respectively.
Respiratory measurements.
All 4 groups of mice were placed in unrestrained whole-body plethysmograph chambers at the same time of day and exposed to a 2-min aerosolization of PBS or 25 mg/mL or 50 mg/mL methacholine, followed by a 5-min recording period.16,21 The mice first were allowed to explore the chambers, with normal grooming behavior indicating that the mice had become acclimated.
Euthanasia and data collection.
The mice were anesthetized with intraperitoneal injection of ketamine–xylazine and then euthanized by exsanguination and cervical dislocation. The trachea was opened and cannulated with a length of flexible tube, and the lungs were lavaged with 2 mL warm HBSS in 250-μL aliquots. The left lung was removed and fixed in 70% ethanol for histology. The right lung was placed into ice-cold Complete Protease Inhibitor Cocktail (Roche Chemicals, Basel, Switzerland). The right lungs then were homogenized, the homogenate centrifuged at 10,000 × g for 15 min, and the supernatant removed for cytokine analysis. Bronchoalveolar lavage fluid (BAL) was centrifuged at 600 × g for 5 min, and the supernatant was removed. The cell pellet was resuspended in 200 μL RPMI, the RBC lysed, and remaining cells counted on an automated hematology machine (Particle Counter, Beckman Coulter, Fullerton, CA). The cells were adhered to a slide and counted at ×1000 magnification. The absolute cell counts per BAL sample were calculated for total WBC, neutrophils, macrophages, eosinophils, and lymphocytes.
Cytokine and chemokine analysis.
Cytokines and chemokines were measured by using ‘sandwich’ ELISA.25 Briefly, plates (Nunc, Rochester, NY) were coated with anticytokine antibodies overnight at 4 °C, plates were blocked, samples were incubated on plates for 2 h at room temperature, and a biotinylated secondary antibody was used to detect captured cytokines and chemokines after incubation with strepavidin-conjugated horseradish peroxidase and a colorimetric reaction. BAL samples were diluted 1:2, lung homogenate samples were diluted 1:5, and standards contained an equal concentration of pooled naïve lung homogenate. Plates were read in an automated plate reader (PowerWaveX, BioTek Instruments, Hopkinton, MA).
Microarray software analysis.
Microarray analysis was performed by using freeware TM4-MEV software (MultiExperiment Viewer, Dan-Farber Cancer Institute, Boston, MA). Data underwent Z-score normalization so that parameters with vastly different ranges could be compared directly. Briefly the average and SD of the data for each parameter were calculated across groups. The Z-score was calculated as the average for each data group subtracted from each data point and the difference divided by the SD for each data group:
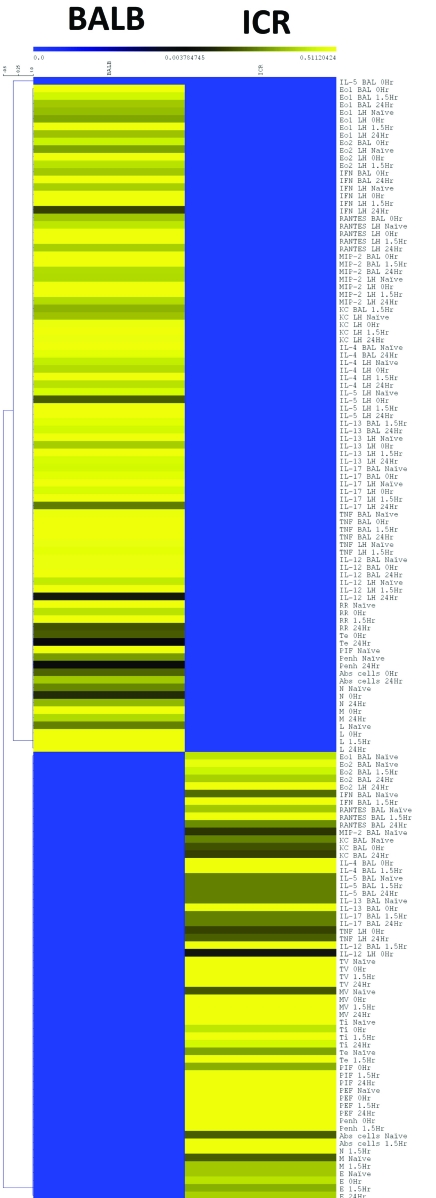
The normalized data then were averaged across groups and a heat map constructed (http://www.tm4.org/mev.html). Hierarchal clustering (average linkage clustering by using Pearson correlation as the distance metric) was performed within parameters (Figure 1).
Figure 1.
Heat map of Z-score data parameters including cytokines and chemokines in BAL and lung homogenate; inflammatory cells in BAL and respiratory parameters in response to 50 mg/mL methacholine at 4 time points (naïve, 0 h, 1.5 h, and 24 h). The values for each strain or stock at each of the time points were converted to Z scores (value – average for parameter / SD for parameter) so that they could be displayed on a single heat map without the large values overwhelming the small values. The Z-score data then were averaged for each parameter at each time point for each strain or stock and subjected to hierarchal clustering within data parameters. Clear differences in the inflammatory profile are evident in the heat map, although this figure does not contain any information concerning the intrastrain variability of each group.
Statistics.
Statistical comparisons were performed by 2-way ANOVA (Prism 4.0, GraphPad Software, La Jolla, CA). Power analysis was performed by using freeware tools (http://www.biomath.info/). The coefficient of variance was calculated as the ratio of the SD and the mean of each data set:
The average coefficient of variance for each strain or stock was displayed with its SD.
Results
Several data parameters were chosen to demonstrate that the cockroach allergens would induce pulmonary inflammation in both inbred BALB/cJ and outbred HSD-ICR(CD1) mice. The intent of the study was not to demonstrate equivalent levels of pulmonary inflammation but rather the variability in response to allergen.
We used a heat map to concisely display all the inflammatory response data. We compared the levels of cytokines and chemokines in BAL fluid and lung homogenates, numbers of inflammatory cells in BAL fluid, and respiratory parameters in response to 50 mg/mL methacholine. Briefly, each data point underwent Z-score normalization with respect to the population mean and SD for a given parameter (for example, the mean and SD of the BALB and ICR eotaxin 1 levels). This transformation was necessary to prevent the parameters with the highest values from overwhelming the gradient of the heat map and obscuring changes within the smaller values. The normalized data then were averaged for each parameter within each strain or stock to simplify the presentation. The resulting heat map revealed differences in the levels of numerous parameters, indicating that BALB and ICR mice responded distinctly to pulmonary inflammation induced by CRA sensitization and challenge (Figure 1).
The data revealed interesting differences in the inflammatory profiles of BALB and ICR mice, namely that these strains or stocks had relative differences in various inflammatory parameters and respiratory responses. However, both groups showed a sharp, early inflammatory response followed by partial recovery at the end of the experimental time frame.
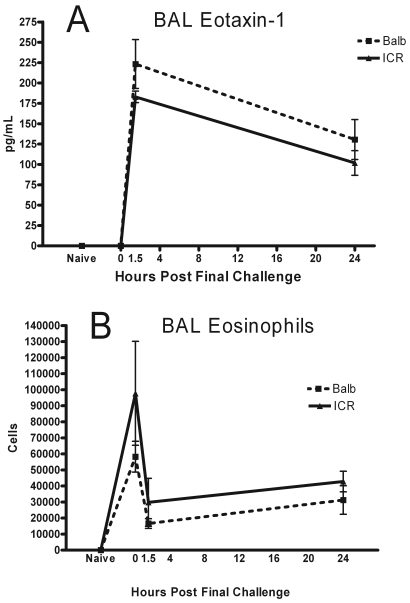
The first parameters we examined individually were those we expected to be elevated during asthma-like pulmonary inflammation. BAL fluid levels of eotaxin 1 were roughly equivalent between BALB and ICR mice at each of the time points. Amounts of this chemokine increased from below the limit of detection (naïve and 0 h) to a peak at 1.5 h after the final challenge dose. Levels dropped markedly by 24 h but were still elevated compared with those at earlier time points (Figure 2 A). Eosinophils were undetectable in the BAL fluids of naïve mice (Figure 2 B). These cells were increased at 0 h (when the mice had received 2 pulmonary challenge doses and were euthanized at the time they would have received their final challenge dose), dropped sharply 1.5 h after the final challenge dose, and then increased slightly by the final measurement at 24 h. The general shape of the curves were similar, and the size of the standard error bars in the graphs were also approximately equivalent.
Figure 2.
(A) Eotaxin 1 and (B) eosinophils in BAL fluid were measured in Balb/cJ and HSD-ICR(CD1) mice at 4 time points: naïve, acclimated mice that had not been exposed to CRA; 0 h, mice that underwent AHR measurement and euthanized when they would have received the final challenge dose; and 1.5 and 24 h after receiving the final challenge dose. Data are given as mean ± SEM (n = 4).
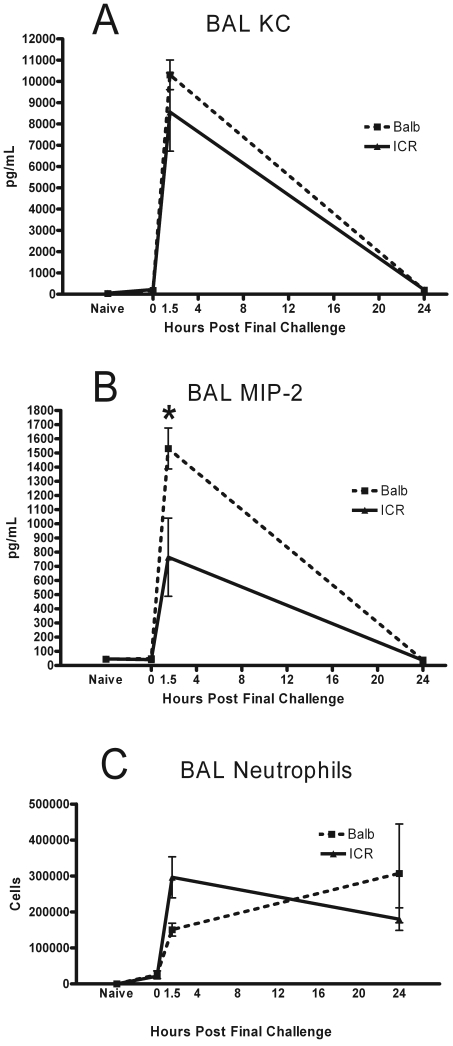
The BAL levels of the neutrophil chemoattractants KC and MIP2 were elevated from baseline at 1.5 h after final challenge in both the BALB and ICR mice (Figure 3 A, B). MIP-2 levels were significantly (P = 0.024) higher at 1.5 h in the BALB mice as compared with the ICR mice, and the levels of these mediators had returned to naïve levels by 24 h. Neutrophils were rare in the BAL fluid of naïve mice and at 0 h after final challenge (Figure 3 C). At 1.5 h, the levels of these inflammatory cells rose to coincide with the peak of the chemoattractant levels. At this early time point, the number of neutrophils present in the ICR lungs spaces was higher (P = 0.025) than those in the BALB. At 24 h, neutrophil levels remained elevated in both ICR and BALB mice.
Figure 3.
(A) KC, (B) MIP2, and (C) neutrophils in BAL fluids were measured in naïve mice and immunized mice at 0, 1.5, and 24 h. Data are given as mean ± SEM (n = 4). *, Significant (P < 0.05) between values for BALB and ICR mice.
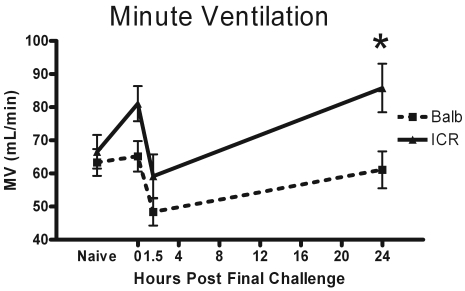
Respiratory parameters were recorded after 2-min exposure to PBS or 25 or 50 mg/mL methacholine. For the purpose of clarity, only the data from the 50-mg/mL dose of methacholine is displayed for the following pulmonary parameters. Minute ventilation (MV) was elevated from naïve levels at 0 h, dropped at 1.5 h at the point of peak neutrophil accumulation, and began to return to naive levels by 24 h after final challenge (Figure 4). The MV of outbred ICR mice was significantlys (P = 0.018) elevated at 24 h after final challenge as compared with that of the BALB group.
Figure 4.
Minute ventilation (volume of airflow per minute) was measured in naïve mice, in mice just before they would have received their final challenge dose (0 h), and at 1.5 and 24 h after final challenge. The displayed data is the MV change in response to exposure to 50 mg/mL of methacholine since the largest effects were observed at this dose. Data are given as mean ± SEM (n = 4). *, Significant (P < 0.05) between values for BALB and ICR mice.
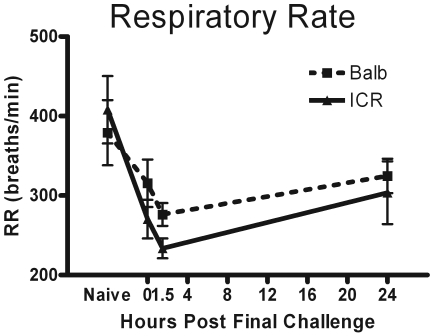
Respiratory rate ranged from 300 to 400 breaths per minute in naïve BALB and ICR mice in our experiments. Respiratory rate was diminished from naïve levels at 0 h, in concordance with the suppressed minute ventilation. Respiratory rate declined further at 1.5 h at the peak of neutrophil infiltration. At 24 h after final challenge, respiratory rate had begun to return to normal levels (Figure 5).
Figure 5.
Respiratory rate (no. of breaths per minute) was measured in naïve mice, in mice before they would have received their final challenge dose (0 h), and at 1.5 and 24 h after final challenge dose. The displayed data are the changes in respiratory rate in response to exposure to 50 mg/mL methacholine, because the largest effects were observed at this dose. Data are given as mean ± SEM (n = 4).
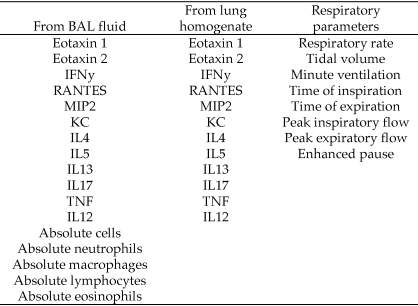
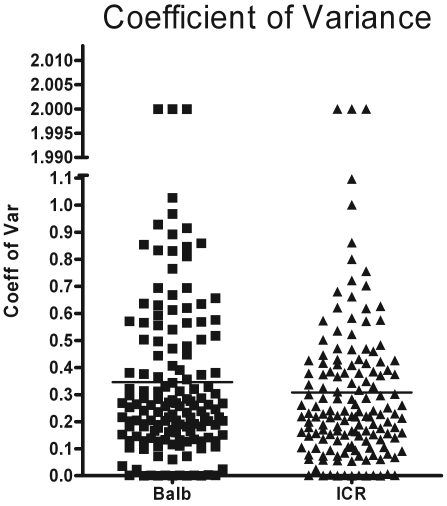
Substantial amounts of data were accumulated for each mouse at each time point, resulting in 37 discrete data points per mouse per time point (a total of 592 data points per strain or stock). A complete listing of the parameters measured in this study is shown in Figure 6. The data collected included spanned cell counts, cytokines, and chemokines from the BAL and lung homogenate and a number of respiratory parameters measured at each time point. A primary goal of this study was to determine the degree of variation between the outbred and inbred mice. To succinctly present all data concerning variation, the coefficients of variance for each data set within the strain or stock were graphed as a scatter plot displaying 148 discrete points per strain or stock (Figure 7). A visual inspection of the graphs showed that the variability between the 2 groups of mice was nearly equivalent. In addition, the 2 groups of mice had only 3 outliers out of 148 data points.
Figure 6.
Data collected during the current study. These parameters were measured in naïve mice and at 3 time points for each strain and stock, for a total of 37 data points per mouse per time point (592 data points per strain or stock).
Figure 7.
The total set of 148 coefficient of variance data points from each strain (n = 16) or stock (n = 16) were combined into a single scatter plot to display the overall pattern of variance.
To apply this finding, we performed a power analysis on several of the data sets. We chose an experiment design in which the goal was to detect a 50% difference in the parameter being measured at a biologically relevant time point. We examined BAL fluid for numbers of eosinophils and neutrophils and the amount of a chemotactic agent for each cell type (Table 1). The calculations revealed that more BALB mice would be needed to detect a difference in eosinophils. Conversely, more ICR mice would be needed to detect a difference in neutrophils and KC levels. The total number of mice needed to detect a 50% difference for 3 parameters at 1.5 h and 1 parameter at 24 h is approximately 19 for the BALB mice and approximately 14 for the ICR mice. This difference in numbers would shrink considerably if more data sets were examined.
Table 1.
Sample size calculation to detect 50% difference in eosinophils, neutrophils, and their chemotactic agents in BAL fluid
| BALB | ICR | |
| Eosinophils at 24 h | 13 | < 6 |
| Neutrophils at 1.5 h | < 6 | 7 |
| Eotaxin 1 at 1.5 h | < 6 | < 6 |
| KC at 1.5 h | < 6 | 8 |
The time point for each parameter was chosen to be biologically relevant. We chose a 50% difference because previous experiments showed at least a 50% change during treatment or manipulation.
Discussion
Our detailed analysis of pulmonary inflammatory parameters in BALB and ICR mice revealed 3 key factors regarding this inbred strain and outbred stock. First, comparison of the coefficient of variance from each of the 148 data sets between the BALB and ICR mice revealed no significant difference in the overall variance of the 2 groups. Second, both groups of mice developed significant pulmonary inflammation that led to respiratory impairment. Third, although BALB and ICR mice had significant lung inflammation, the profile of elevated cytokines and chemokines differed between the 2 groups.
Analysis of the coefficient of variance of all of the 148 separate data groups within the BALB and ICR mice revealed that BALB and ICR mice have roughly equivalent overall variance. This outcome was surprising, because of the widely held belief that outbred stocks of mice are more variable than their inbred counterparts.5,8,34 We realize that a comparison of a single strain with a single stock does not comprise an overarching trend, but we believe that the data detailed in our studies clearly demonstrate that in our model of asthma-like pulmonary inflammation, outbred mice are no more variable than are inbred strains. One of the principal arguments against the use of outbred mice for all but certain select experiments is that the number of genetically heterogeneous mice needed to perform a given experiment will greatly exceed the number of inbred mice required to achieve the same results.8 Therefore both logistical (caring for and performing the experiment on more mice) and ethical (euthanizing more mice than is necessary) arguments would favor the use of inbred mice. However, our experiments showed that a common outbred stock was no more variable than was an inbred strain. Therefore, at least in studies of pulmonary inflammation, we propose an economic incentive to using outbred mice. Specifically, the same results can be achieved with roughly equivalent numbers of mice while spending much less money to obtain outbred rather than inbred mice, which are generally more expensive. We in no way advocate the prioritizing of expenses over the euthanasia of laboratory animals. Rather, we suggest that outbred stocks can be used efficiently in certain disease models without an undue increase in the number of mice euthanized and that doing so happens to result in a cost benefit.
Next, we sought to demonstrate that both groups of mice developed significant pulmonary inflammation in response to CRA sensitization and challenge. We found that both BALB and ICR mice develop robust pulmonary inflammation in response to intratracheal immunization and subsequent challenge with CRA. This response was confirmed by analysis of inflammatory cells and cytokines (Figures 2 and 3) and respiratory parameters (Figures 4 and 5) and by previous studies.16,21,26 Eotaxin 1 is produced by macrophages and epithelial cells and is a potent eosinophil chemotactic agent.12,30,31 The production of this chemokine spikes soon after allergen challenge and decreases somewhat over time as the early inflammatory response begins to resolve. Interestingly, the peak of eosinophil presence in the lung space occurs at 0 h, with a sharp drop after allergen challenge. We have observed this pattern in many experiments and believe that after the second allergen exposure (the first challenge after immunization), eosinophils accumulate in the lung and persist over a long period of time (in this case, 1 wk; unpublished data).33 After the final challenge, these persistent eosinophils may begin to undergo apoptosis and steadily are replaced by fresh circulating eosinophils over the course of the experiment. KC and MIP2 are involved in the recruitment of circulating neutrophils to the site of inflammation.17,18 Neutrophils in the BAL fluid accumulated rapidly in response to the sharp spikes in KC and MIP2 production, which occurred very shortly after the final allergen challenge. Lung eosinophilia10,32 and neutrophilia1,15 are indicative of a strong inflammatory response, because neither of these immune cells or their chemotactic agents are present in naïve lung.
The respiratory parameters of our mice were also suggestive of robust pulmonary inflammation. MV is a measure of the total air exchanged per minute and is an indicator of respiratory health.3,4,11,19 In mice,3,11 decreases in minute ventilation are reflective of decreasing ventilatory fitness, and in humans,4,19 a low baseline MV is considered to be an indicator of pulmonary derangement in asthma. In our experiments, ICR and BALB mice both showed decreases in MV at 1.5 h. By 24 h, the MV capacity of both groups of mice had improved with the ICR mice showing significantly greater improvement. ICR mice tend to be larger than BALB, however, the mice displayed nearly equivalent naïve MV, so this difference in MV at 24 h likely represents a more rapid return to relatively normal respiratory function in the ICR mice (or a greater degree of respiratory compensation).
Furthermore, decreases in respiratory rate are indicative of pulmonary derangement in murine models of asthma. The BALB and ICR mice had diminished respiratory rate at 0, 1.5, and 24 h as compared with naïve levels. In concordance with the pattern seen in MV, respiratory rate improved relative to its nadir by 24 h. These respiratory factors indicate that inflammation was established in the lung and that it gradually resolved over the time course of the experiments.
Finally, although both groups of mice developed significant pulmonary inflammation, the degree to which various parameters were altered differed between the BALB and ICR mice (Figure 1). This difference is expected for 2 different strains or stocks of mice.13,24 BALB mice produced higher levels of Th2 cytokines and eotaxin 1 (Figure 1) and recruited elevated numbers of lymphocytes to the BAL fluid. Alternatively, ICR mice secreted relatively higher levels of eotaxin 2, had greater numbers of eosinophils in the BAL fluid, and exhibited larger exacerbations in respiratory parameters in response to methacholine. Although the 2 groups of mice differed in the character of their inflammatory responses, these differences were relative. Namely, both groups of mice had elevated cytokine and chemokine levels, both groups had large changes in respiratory parameters, and both groups showed strong recruitment of inflammatory cells to the BAL. That ICR and BALB differed does not affect the conclusions reached through the main research aim, which was to determine whether the intrastock variability of ICR mice was appreciably higher than was the intrastrain variability of BALB mice. However, differences in the inflammatory profile provide useful insight into the strain- and stock-specific responses to pulmonary allergen sensitization and challenge.
In conclusion, we have shown that in a robust model of CRA-induced pulmonary inflammation, inbred BALB and outbred ICR mice display roughly equivalent levels of overall, intrastrain variability. We believe that, at least in the case of pulmonary inflammation, BALB and ICR mice are equally suitable for targeted studies and that the use of the outbred stock provides considerable financial advantage without increasing the number of mice needed.
Acknowledgments
Research funded by NIEHS grant no. 5R01ES013538-04 and NIH training grant no. 2T32AI007309-21A1.
References
- 1.Ben-Baruch A, Michiel DF, Oppenheim JJ. 1995. Signals and receptors involved in recruitment of inflammatory cells. J Biol Chem 270:11703–11706 [DOI] [PubMed] [Google Scholar]
- 2.Chia R, Achilli F, Festing MF, Fisher EM. 2005. The origins and uses of mouse outbred stocks. Nat Genet 37:1181–1186 [DOI] [PubMed] [Google Scholar]
- 3.de Hennezel L, Debarre S, Ramisse F, Delamanche S, Harf A, Alonso JM, Calvet JH. 2001. Plethysmography for the assessment of pneumococcal pneumonia and passive immunotherapy in a mouse model. Eur Respir J 17:94–99 [DOI] [PubMed] [Google Scholar]
- 4.Eckert DJ, Catcheside PG, Smith JH, Frith PA, McEvoy RD. 2004. Hypoxia suppresses symptom perception in asthma. Am J Respir Crit Care Med 169:1224–1230 [DOI] [PubMed] [Google Scholar]
- 5.Festing MF. 1976. Phenotypic variability of inbred and outbred mice. Nature 263:230–232 [DOI] [PubMed] [Google Scholar]
- 6.Festing MF. 1993. International index of laboratory animals, 6th ed Leicester (UK): University of Leicester [Google Scholar]
- 7.Festing MF. 1997. Inbred strains of mice: a vital resource for biomedical research. Mouse Genome 95:845–855 [Google Scholar]
- 8.Festing MF. 1999. Warning: the use of heterogeneous mice may seriously damage your research. Neurobiol Aging 20: 237–244; discussion 245–246 [DOI] [PubMed] [Google Scholar]
- 9.Gavett SH, O'Hearn DJ, Li X, Huang SK, Finkelman FD, Wills-Karp M. 1995. Interleukin 12 inhibits antigen-induced airway hyperresponsiveness, inflammation, and Th2 cytokine expression in mice. J Exp Med 182:1527–1536 [DOI] [PMC free article] [PubMed] [Google Scholar]
- 10.Gonzalo JA, Lloyd CM, Kremer L, Finger E, Martinez AC, Siegelman MH, Cybulsky M, Gutierrez-Ramos JC. 1996. Eosinophil recruitment to the lung in a murine model of allergic inflammation. The role of T cells, chemokines, and adhesion receptors. J Clin Invest 98:2332–2345 [DOI] [PMC free article] [PubMed] [Google Scholar]
- 11.Hemmila MR, Kim J, Sun JM, Cannon J, Arbabi S, Minter RM, Su GL, Remick DG, Wang SC. 2006. Gene therapy with lipopolysaccharide binding protein for gram-negative pneumonia: respiratory physiology. J Trauma 61: 598–605; discussion 605–606 [DOI] [PubMed] [Google Scholar]
- 12.Huaux F, Gharaee-Kermani M, Liu T, Morel V, McGarry B, Ullenbruch M, Kunkel SL, Wang J, Xing Z, Phan SH. 2005. Role of eotaxin 1 (CCL11) and CC chemokine receptor 3 (CCR3) in bleomycin-induced lung injury and fibrosis. Am J Pathol 167:1485–1496 [DOI] [PMC free article] [PubMed] [Google Scholar]
- 13.Ichinose T, Takano H, Sadakane K, Yanagisawa R, Yoshikawa T, Sagai M, Shibamoto T. 2004. Mouse strain differences in eosinophilic airway inflammation caused by intratracheal instillation of mite allergen and diesel exhaust particles. J Appl Toxicol 24:69–76 [DOI] [PubMed] [Google Scholar]
- 14.Jay GE., Jr 1955. Variation in response of various mouse strains to hexobarbital (Evipal). Proc Soc Exp Biol Med 90:378–380 [DOI] [PubMed] [Google Scholar]
- 15.Kaplanski G, Marin V, Montero-Julian F, Mantovani A, Farnarier C. 2003. IL6: a regulator of the transition from neutrophil to monocyte recruitment during inflammation. Trends Immunol 24:25–29 [DOI] [PubMed] [Google Scholar]
- 16.Kim J, McKinley L, Siddiqui J, Bolgos GL, Remick DG. 2004. Prevention and reversal of pulmonary inflammation and airway hyperresponsiveness by dexamethasone treatment in a murine model of asthma induced by house dust. Am J Physiol Lung Cell Mol Physiol 287:L503–L509 [DOI] [PubMed] [Google Scholar]
- 17.Kobayashi Y. 2008. The role of chemokines in neutrophil biology. Front Biosci 13:2400–2407 [DOI] [PubMed] [Google Scholar]
- 18.Lee J, Cacalano G, Camerato T, Toy K, Moore MW, Wood WI. 1995. Chemokine binding and activities mediated by the mouse IL8 receptor. J Immunol 155:2158–2164 [PubMed] [Google Scholar]
- 19.Mansell AL, Walders N, Wamboldt MZ, Carter R, Steele DW, Devin JA, Monica TH, Miller AL, Wamboldt FS. 2006. Effect of body mass index on response to methacholine bronchial provocation in healthy and asthmatic adolescents. Pediatr Pulmonol 41:434–440 [DOI] [PubMed] [Google Scholar]
- 20.McClearn GE. 1999. Exotic mice as models for aging research: polemic and prospectus by R Miller. Neurobiol Aging 20: 233–236; discussion 245–246 [DOI] [PubMed] [Google Scholar]
- 21.McKinley L, Kim J, Bolgos GL, Siddiqui J, Remick DG. 2004. Reproducibility of a novel model of murine asthma-like pulmonary inflammation. Clin Exp Immunol 136:224–231 [DOI] [PMC free article] [PubMed] [Google Scholar]
- 22.McLaren A, Michie D. 1956. Variability of response in experimental animals. J Genet 54:440–455 [Google Scholar]
- 23.Miller RA, Austad S, Burke D, Chrisp C, Dysko R, Galecki A, Jackson A, Monnier V. 1999. Exotic mice as models for aging research: polemic and prospectus. Neurobiol Aging 20:217–231 [DOI] [PubMed] [Google Scholar]
- 24.Nakanishi M, Tazawa H, Tsuchiya N, Sugimura T, Tanaka T, Nakagama H. 2007. Mouse strain differences in inflammatory responses of colonic mucosa induced by dextran sulfate sodium cause differential susceptibility to PhIP-induced large bowel carcinogenesis. Cancer Sci 98:1157–1163 [DOI] [PMC free article] [PubMed] [Google Scholar]
- 25.Nemzek JA, Siddiqui J, Remick DG. 2001. Development and optimization of cytokine ELISAs using commercial antibody pairs. J Immunol Methods 255:149–157 [DOI] [PubMed] [Google Scholar]
- 26.Page K, Lierl KM, Hughes VS, Zhou P, Ledford JR, Wills-Karp M. 2008. TLR2-mediated activation of neutrophils in response to German cockroach frass. J Immunol 180:6317–6324 [DOI] [PMC free article] [PubMed] [Google Scholar]
- 27.Paigen K. 2003. One hundred years of mouse genetics: an intellectual history. I. The classical period (1902–1980). Genetics 163:1–7 [DOI] [PMC free article] [PubMed] [Google Scholar]
- 28.Paigen K. 2003. One hundred years of mouse genetics: an intellectual history. II. The molecular revolution (1981–2002). Genetics 163:1227–1235 [DOI] [PMC free article] [PubMed] [Google Scholar]
- 29.Peters LL, Robledo RF, Bult CJ, Churchill GA, Paigen BJ, Svenson KL. 2007. The mouse as a model for human biology: a resource guide for complex trait analysis. Nat Rev Genet 8:58–69 [DOI] [PubMed] [Google Scholar]
- 30.Rankin SM, Conroy DM, Williams TJ. 2000. Eotaxin and eosinophil recruitment: implications for human disease. Mol Med Today 6:20–27 [DOI] [PubMed] [Google Scholar]
- 31.Rothenberg ME. 1999. Eotaxin. An essential mediator of eosinophil trafficking into mucosal tissues. Am J Respir Cell Mol Biol 21:291–295 [DOI] [PubMed] [Google Scholar]
- 32.Spry CJ. 1971. Mechanism of eosinophilia. VI. Eosinophil mobilization. Cell Tissue Kinet 4:365–374 [PubMed] [Google Scholar]
- 33.Vaickus LJ, Bouchard J, Natarajan S, Kim J, Remcik DG.2010. Unpublished data.
- 34.Yoshiki A, Moriwaki K. 2006. Mouse phenome research: implications of genetic background. ILAR J 47:94–102 [DOI] [PubMed] [Google Scholar]


