Abstract
The tip asymmetry of a bevel-tip needle results in the needle naturally bending when it is inserted into soft tissue. This enables robotic needle steering, which can be used in medical procedures to reach subsurface targets inaccessible by straight-line trajectories. However, accurate path planning and control of needle steering requires models of needle-tissue interaction. Previous kinematic models required empirical observations of each needle and tissue combination in order to fit model parameters. This study describes a mechanics-based model of robotic needle steering, which can be used to predict needle behavior and optimize system design based on fundamental mechanical and geometrical properties of the needle and tissue. We first present an analytical model for the loads developed at the tip, based on the geometry of the bevel edge and material properties of soft-tissue simulants (gels). We then present a mechanics-based model that calculates the deflection of a bevel-tipped needle inserted through a soft elastic medium. The model design is guided by microscopic observations of needle-gel interactions. The energy-based formulation incorporates tissue-specific parameters, and the geometry and material properties of the needle. Simulation results follow similar trends (deflection and radius of curvature) to those observed in experimental studies of robotic needle insertion.
1 Introduction
Needle insertion into soft tissues is one of the most common minimally invasive medical procedures. Percutaneous therapies using needles are appropriate for diagnosis, localized therapeutic drug delivery, and sample removal from tissues deep within the body. Inaccurate needle placement may result in malignancies not being detected during biopsy, radioactive seeds not being placed in the correct location to destroy cancerous lesions during brachytherapy, and traumatic or even fatal effects during administration of anesthesia. Thus, for effective medical diagnosis and treatment, the needle must reach its intended target. However, the needle can deviate from its intended path due to tissue inhomogeneity and anisotropy, organ deformation, anatomy obstructing the needle path, and physiological processes such as respiration, flow of fluids, and edema (swelling). A possible method to mitigate needle targeting errors is to use a needle that can be robotically steered inside the body to reach the intended target. Such needle steering systems promise to enhance physicians’ abilities to accurately reach targets and maneuver inside the human body while minimizing patient trauma.
Several groups have examined the use of robotically steered flexible needles through tissue (Abolhassani & Patel 2006, DiMaio & Salcudean 2005, Engh et al. 2006, Glozman & Shoham 2007, Okazawa et al. 2005, Webster III et al. 2006). Abolhassani et al. (2007) provide a review of recent needle insertion research. One needle steering method uses flexible needles with standard bevel tips that naturally cause the needle to bend when inserted into soft tissue (Webster III et al. 2006). This steerability of these needles is attributed to the asymmetry of the bevel edge, which results in bending forces at the needle tip (Figure 1), and the flexibility of the needle shaft, which allows it to follow a curved path.
Figure 1.
Asymmetry of the bevel tip produces a resultant transverse load which causes a flexible needle to naturally bend when it is inserted through a soft medium. This phenomenon is not observed in needles with symmetric tips.
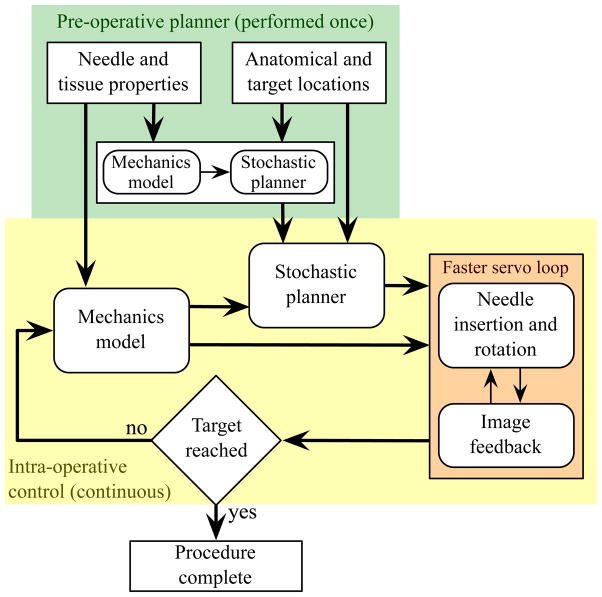
Although surgeons and interventional radiologists have long been aware that tip asymmetry causes needle deflection, manual steering of highly flexible needles is challenging due to the limitations of human manual control, lack of access to quantitative tissue models, and complexity of the needle paths. Robotic devices provide precise control of insertion distance and tip orientation, and can be integrated with pre-operative planners and real-time image-guided controllers. These planners and controllers require a model of needle-tissue interaction. A working robotic needle steering system incorporating planning and control has been developed to successfully drive a needle around obstacles to a desired target in artificial tissue (Reed et al. 2008). The integrated system uses an image-guided feedback controller (Kallem & Cowan 2009) and a stochastic motion planner (Alterovitz et al. 2008) to determine and follow the prescribed motion. These invoke a kinematic model in which the relationship between model parameters and the mechanical and geometric properties of the needle and tissue are not known (Webster III et al. 2006). Thus, the empirical model parameters must be fit using data from previous insertions of the same type of needle through the same material. Such a process is not feasible for clinical procedures, so a mechanics-based model that uses fundamental tissue and needle properties is necessary for practical implementation. This paper demonstrates a mechanics-based model that captures the salient behavior of needle-tissue interaction needed to enable robotic needle steering planning and control. Figure 2 depicts the use of mechanics-based needle-tissue interaction models, stochastic planners, and image-guided control systems for robotically steering needles to desired targets.
Figure 2.
Accurate robotic needle steering requires a model that predicts needle motion within the tissue. Both a stochastic motion planner (used pre- and/or intra-operatively) and an image-guided model-based feedback controller can use the mechanics-based model.
A general survey of surgical tool and tissue interaction models, which describes both physics- and non-physics-based interaction models is provided by Misra et al. (2008a). Several research groups have developed physics-based needle and soft tissue interaction models that are not specific to bevel-tipped needles (DiMaio & Salcudean 2003, Alterovitz et al. 2003, Nienhuys & van der Stappen 2004, Crouch et al. 2005, Heverly et al. 2005, Hing et al. 2006, Yan et al. 2009, Dehghan 2009). In all these studies, the researchers developed models to create simulations of needle insertion through soft tissue without specifically focusing on a physically based parametric model of needle-tissue interaction forces. However, experimental work has identified interaction forces (due to puncture, cutting, and friction) that develop during needle insertion through tissue (Okamura et al. 2004). Further, Shergold & Fleck (2004) provided a fracture mechanics-based model for flat-bottomed and sharp-tipped cylindrical punches as the tip interacted with soft solids, although their model does not consider the interaction of the punch shaft with the surrounding medium. Webster III et al. (2006) presented a nonholonomic model for steering flexible needles with bevel tips. The parameters for their kinematic model were fit using experimental data, but the model parameters cannot be predicted for new needle and tissue combinations. None of these studies focused on relating the tip forces to the amount of needle deflection based on the fundamental principles of continuum and fracture mechanics. To our knowledge, this work is the first to provide a physically based parametric model of needle-tissue interaction for asymmetric-tip steering. Any model describing the real world has limitations; the goal of our work is to create a model that captures needle behavior to inform the design, path planning, and control of robotic needle steering systems.
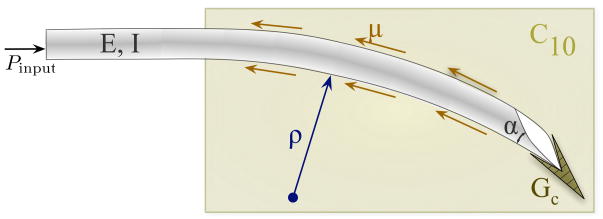
Our study considers two main components of needle steering mechanics – the interactions at the needle tip and the overall bending of the needle as it is inserted through soft tissue. First, we present an analytical model that calculates the forces at the bevel tip of the needle. The forces developed are a function of the bevel geometry and tissue material properties. Further, we conducted experimental studies with a physically scaled needle tip to validate the model. In addition to macroscopic studies, we also present confocal microscopic observations of needle tip-tissue interactions. Second, we present a two-dimensional model for a bevel-tip needle embedded in an elastic medium (Figure 3). Our mechanics-based model is guided by both macroscopic and microscopic observations of needles inserted through soft gels. The model accounts for the needle’s geometric and material properties, and also the medium’s nonlinear material properties. Uniaxial compression and toughness tests were performed to extract medium-specific material properties for incorporation into the model. In addition to capturing needle tip effects, our analytical model provides a physics-based understanding of the effect of the needle-tissue interaction (both along the needle shaft and at the bevel tip) on the evolving shape of the needle.
Figure 3.
Schematic of a bevel-tip needle interacting with a soft elastic medium. The two-dimensional model incorporates tip forces generated by rupture, tissue properties (toughness: GC, nonlinear elasticity: C10), and needle properties (bevel angle: α and flexural rigidity: EI). μ is the coefficient of friction between the needle and the elastic medium.
This paper is organized as follows: Section 2 presents dimensional analysis to demonstrate the importance of both tissue elasticity and toughness for needle steering calculations, and presents the mathematical preliminaries and experiments required to obtain the tissue elasticity and toughness values for several gels. Section 3 presents macroscopic and microscopic observations of needle tip and gel interactions. Section 4 provides an energy-based formulation for a needle inserted in an elastic medium. Section 5 compares the results from the experimental needle-gel interaction studies to those obtained from the energy-based model. Finally, this paper concludes with a summary of these efforts and provides possible directions for future work.
2 Influence of Tissue Properties on Bevel-Tip Needle Steering
2.1 Dimensional Analysis of Needle-Tissue Interactions
Our objective is to develop a mechanics-based needle-tissue interaction model that relates the deformed needle’s radius of curvature to the material and geometric properties of the tissue and needle. Here, we use dimensional analysis to demonstrate which needle and tissue parameters are relevant to this model. The radius of curvature (Figure 3) of a bevel-tipped needle is hypothesized to be a function of several parameters:
The needle’s Young’s modulus (E, unit: Pa), second moment of inertia (I, unit: m4), and tip bevel angle (α).
The tissue’s nonlinear (hyperelastic) material property (C10, unit: Pa), rupture toughness (GC, unit: N/m), and coefficient of friction with the needle (μ).
The input insertion force from the robot controller (Pinput, unit: N).
Thus, the radius of curvature of the needle (ρ, unit: m) can be written as a function, f, of these parameters:
| (1) |
Dimensional analysis is a way to group dimensionally similar variables. The Buckingham Π theorem is commonly used to perform dimensional analysis (Barenblatt 2002). This theorem describes how a physically meaningful equation involving n variables can be equivalently rewritten as an equation of n – m dimensionless parameters, where m is the number of fundamental dimensions used. This gives insight into the fundamental properties of the system. Dimensional analysis involves scaling quantities by characteristic units of a system (e.g. mass, length, and time).
Performing dimensional analysis and invoking Buckingham’s Π theorem on this system (1) results in the following Π-groups, for primary variables E, I, C10, and :GC: , and . Thus the non-dimensional form of (1) is given by
| (2) |
where ρ0 is the length scale of the system given by
| (3) |
We observe that, with an increase of the medium’s toughness, the length scale increases, while increasing the medium or needle stiffness results in a reduction of ρ0, and vice versa. From (2), irrespective of the choice of the primary variables, the radius of curvature is dimensionally scaled by both the tissue elasticity (global parameter) and the tissue rupture toughness (local parameter). This tells us that, in addition to α and μ, the effects of both C10 and GC need to be investigated. Thus, in order to understand and characterize the needle-tissue interaction, these material parameters need to be measured and incorporated into the model. In the following sections, we present the mathematical formulation and experimental techniques used to measure the tissue elasticity and rupture toughness.
2.2 Tissue Elasticity Model
The elastic deformation of materials under strains greater than 1 to 2% is described by the theory of nonlinear elasticity, and hyperelastic models are commonly used. For a hyperelastic material, the Cauchy stress tensor, σ, can be derived from a strain energy density function, W. There are various formulations for the strain energy density function depending on the type of material. The material parameters associated with the hyperelastic model are experimentally derived using tensile, compression, shear, or biaxial tests. In this study, we used uniaxial compression experiment data, and found that they fit the Neo-Hookean model well. The Neo-Hookean model is a hyperelastic strain energy function commonly used to describe rubber-like materials (Gurtin 2003).
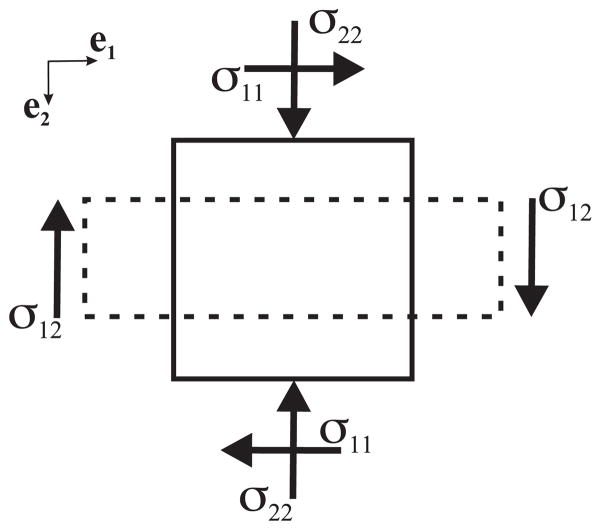
We now proceed to derive the stress-strain relationship. For a body under uniaxial compression (Figure 4), if y represents the position after deformation of a material reference initially located at X, we can describe compression by
Figure 4.
Stresses acting on a body under plane stress. The solid and dashed lines represent the body before and after compression, respectively.
| (4) |
where ei and λi, for i = 1 to 3, are the Cartesian base vectors and stretch ratios, respectively. From (4), the matrix of the deformation gradient tensor, F, for axisymmetric (λ1 = λ3 and λ = λ2) and incompressible materials is
| (5) |
For an isotropic, homogenous, and incompressible hyperelastic material, σ is
| (6) |
where I1 and I2 are the principal invariants, B is the left Cauchy-Green tensor, and p is the Lagrange multiplier (essentially a pressure) (Gurtin 2003). Assuming the material is Neo-Hookean, the strain energy density function is given by
| (7) |
where C10 is a material parameter specific to the tissue. In (7), the principal invariant, I1, can be evaluated from B = FFT as
| (8) |
The Lagrange multiplier, p, in (6) can be evaluated from the boundary condition
| (9) |
From (5) and (7) we can compute B2 and , respectively. Using (6) and (9), the compressive stress, σ22, is
| (10) |
where the stretch ratio is λ = 1 − ε, and ε is the strain. Equation (10) is used to fit experimental stress-strain data to obtain C10. We describe the uniaxial compression tests to evaluate C10 in Section 2.4.
We define KT as the needle-tissue interaction stiffness of the medium per unit length of the needle (N/m2). KT can be calculated from the stress-strain uniaxial compression data of a tested sample (height, h̃, diameter, d̃, circumference, c̃, and cross-sectional area, ã) of the elastic medium. For our cylindrical samples,
| (11) |
where ET is the Young’s modulus of the material. For the Neo-Hookean case, evaluating the slope, , for a unit uniaxial stretch ratio, λ = 1, results in
| (12) |
Combining (11) and (12) results in
| (13) |
2.3 Tissue Toughness Model
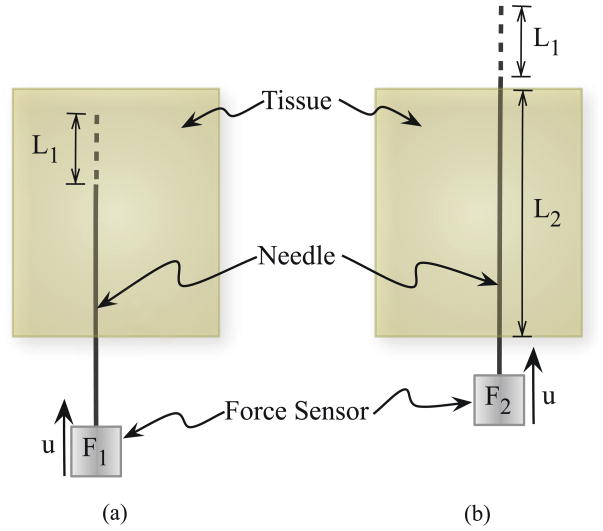
As the needle is pushed through the material, the total insertion force includes the forces needed to cut through tissue, overcome friction, and travel through tissue. Figure 5 provides a schematic representation of the method we will use to extract the toughness. F1 is the insertion force recorded when the needle travels some distance L1. The work done to cut the tissue, overcome friction, and travel through tissue is Gftc:
| (14) |
Figure 5.
The rupture toughness is measured by finding the difference in insertion force when the needle tip is (a) inside the tissue (i.e., cutting the tissue) compared to (b) when the needle tip is outside the tissue (i.e., not cutting).
Once the needle tip has completely passed through the material, there is no cutting force. The force recorded during this phase, for a distance L1 travelled by the needle, is given by F2. This is primarily the frictional force along the needle shaft and is given by
| (15) |
where μ, σn, and D̃ are the coefficient of friction between the needle and the tissue, stress along the needle shaft normal to the direction of insertion, and diameter of the needle, respectively In (15), k̃ is a term that linearly scales the frictional force with the length of the needle shaft inside the tissue. In order to account for the differences in frictional force along the needle shaft when the needle tip is interacting with the elastic medium (Figure 5(a)) compared to the case when the needle tip has completely passed through the material (Figure 5(b)), let
| (16) |
Substituting (15) in (16) gives
| (17) |
Thus, the work done to overcome friction and travel a distance L1, when the needle tip has completely passed through the material is Gft, is given by
| (18) |
In both (14) and (18), dL is the variable of integration that represents the incremental increase in needle length. Hence, the work done per unit needle cross-section area, A, to rupture and cut through tissue, i.e., the effective rupture toughness of the tissue, Gc, is given by
| (19) |
where Gftc and Gft are determined for various materials using needle insertion experiments. In the following section we describe experiments done to measure Gc for several gels and tissues.
2.4 Tissue Parameter Acquisition
Soft tissue simulants (gels) were tested to obtain tissue elasticity and toughness parameters. Specifically, we found the Neo-Hookean model material parameter, C10, given in (10) and the rupture toughness, Gc, derived in (19). In Section 2.4.1 we describe the experiments to evaluate elasticity properties of Plastisol (M-F Manufacturing Co., Inc., Ft. Worth, TX, USA) and porcine (Sigma-Aldrich Co., part number G2500) gels, and in Section 2.4.2 we present experiments to determine toughness properties of these gels. Three different types of Plastisol gel were used as the soft medium in these studies. The ratio of plastic to softener for the Plastisol gel was set to 3:1 (gel A), 4:1 (gel B), and 8:1 (gel C). The softener is a plasticizer added to the plastic (Polyvinyl chloride suspension) to vary the elasticity of the molded material. The porcine gelatin was fabricated using a ratio of 5 tbsp (74 cm3) of powder to 1 cup (237 cm3) of water.
2.4.1 Elasticity Properties of Plastisol and Porcine Gels
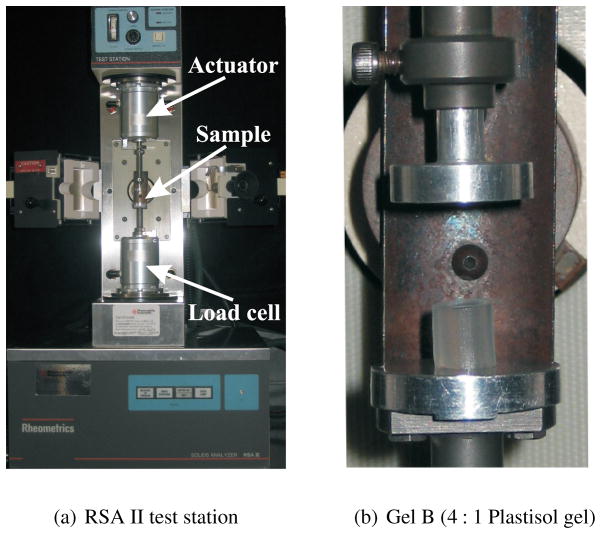
In order to measure C10, we performed uniaxial compression tests on the soft materials using the Rheometrics Solids Analyzer (RSA) II (TA Instruments, New Castle, DE, USA) shown in Figure 6. Seven cylindrical samples of each material were prepared and tested. The mean diameters of the samples were Ø 6.34 mm (gel A), Ø 6.51 mm (gel B), Ø 7.03 mm (gel C), and Ø 8.65 mm (porcine). The mean height of the tested samples was 7.31 mm (gel A), 6.78 mm (gel B), 6.31 mm (gel C), and 6.08 mm (porcine). The gel samples were cut manually from blocks of Plastisol and porcine, resulting in small variations in the size of the samples. The diameter and height of each sample was measured and used in the RSA II software, so the size was considered in the stress-strain calculations. The compression tests were performed at a strain rate of 0.001 s−1.
Figure 6.
The Rheometrics Solids Analyzer (RSA) II is a dynamic material testing device that was used to measure the tissue elasticity of several materials using uniaxial compression tests.
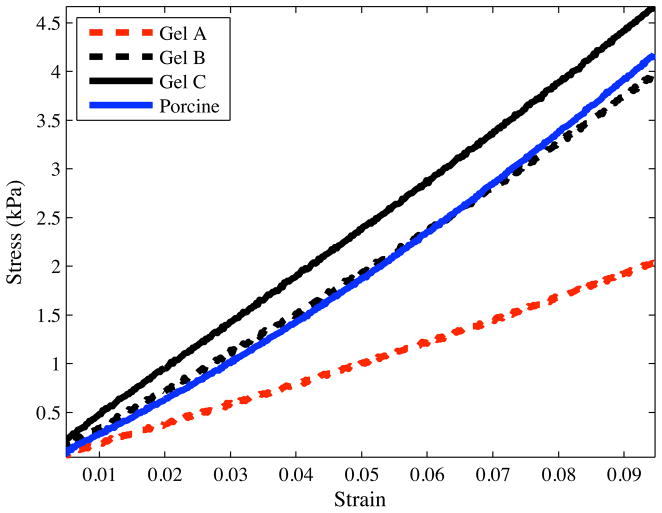
Representative stress-strain curves for several materials are shown in Figure 7. The experimental data were fit to the constitutive equation given in (10) to obtain C10 (Table 1). Linear elastic models were also fit to the experimental data. Table 1 gives the mean values of the Young’s modulus, ET, and stiffness per unit length, KT (11), for the various materials.
Figure 7.
Representative compressive stress-strain curves for Plastisol and porcine gels recorded using the Rheometrics Solids Analyzer (RSA) II.
Table 1.
Measured material elasticity (C10, ET, and KT) and rupture toughness (Gc) properties for various gels.
| Gel | C10 (kPa) | ET (kPa) | Gc (N/m) | KT (kN/m2) |
|---|---|---|---|---|
| Plastisol A (least stiff) | 3.68 | 22.29 | 115.40 | 4.83 |
| Plastisol B | 6.52 | 38.38 | 218.19 | 9.21 |
| Plastisol C (most stiff) | 7.57 | 45.24 | 221.04 | 12.61 |
| Porcine | 6.62 | 43.26 | 82.28 | 15.37 |
2.4.2 Toughness Properties of Plastisol and Porcine Gels
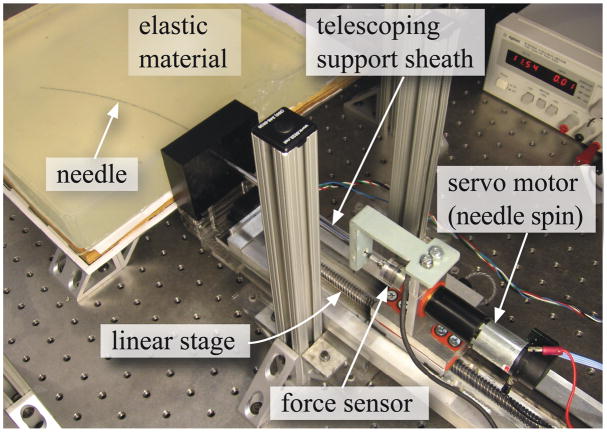
Experiments were conducted with the needle steering robot shown in Figure 8 to measure Gc for the Plastisol and porcine gels. The robot can rotate and insert a needle into tissues using two DC motors. A 6-axis Nano 17 sensor (ATI Industrial Automation, Apex, NC, USA) measures the force and torque at the base of the needle. The needle insertion controller ran and data was acquired at 1 kHz. Tracking of the needle tip was performed at 7 Hz by triangulating images from a pair of XCD-X710 firewire cameras (Sony Corporation, Tokyo, Japan) mounted above the artificial tissue. A telescoping support sheath prevents the needle from buckling during insertion. The robot is further described in Webster III et al. (2005).
Figure 8.
The experimental setup used to robotically steer a flexible needle though soft elastic materials and used for tissue toughness measurement.
Nitinol wires (Nitinol Devices and Components, Fremont, CA, USA) of varying diameter were used as flexible “needles”. These needles were solid rather than hollow. Each needle had a bevel tip. A smooth and sharp bevel was obtained by fixing the needles at an angle in Crystalbond™ (Aremco Products, Inc., Valley Cottage, NY, USA) mounting adhesive, which is a thermo-plastic, and then polishing the edges. After the needle tips had been polished, the needles were removed by breaking the Crystalbond™ mounting adhesive. Finally, the needle tips were cleaned with acetone solution.
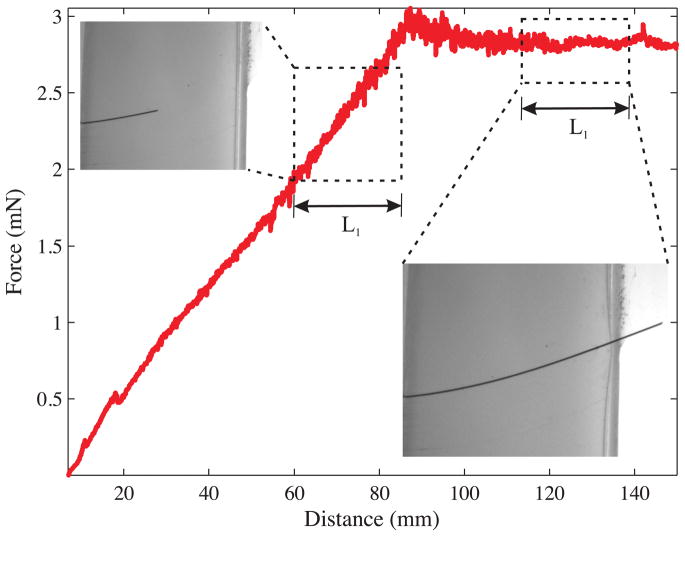
We used three Nitinol needles with diameters of Ø 0.36 mm, Ø 0.46 mm, and Ø 0.54 mm and bevel angles of 32.09°, 31.89°, and 34.85°, respectively. The bevel angles were measured using the Axio Scope. A1 (Carl Zeiss AG, Oberkochen, Germany) optical microscope. As the needle penetrated through the material, the insertion force was recorded using the force sensor. The material toughness was evaluated for Plastisol and porcine gels using the expression given in (19). Figure 9 shows an example of the insertion force recorded as the needle travels through Plastisol gel C. The needle was driven at a constant insertion velocity of 0.25 cm/sec. The length, L2, was 7.8 cm for all gels. Also shown in Figure 9 are representative images taken during the toughness experiments. The needle insertion length while the needle tip is interacting and outside is given by L1. During the phase when the needle tip is outside the tissue and only the needle shaft interacts with the tissue, the insertion force is fairly constant. The rupture toughness for the materials are provided in Table 1. Since the insertion force increases linearly as the needle is inserted into the gel, the choice of L1 did not affect the rupture toughness calculation. Further, based on the results presented by Misra et al. (2009), the rupture toughness is not sensitive to the overall bending of the needle and can be assumed constant for the ranges of needle diameter and bevel angle used in our experiments.
Figure 9.
Rupture toughness measurement for Plastisol gel C (most stiff) with the Ø 0.46 mm (α = 31.89°) needle. The representative images show the forces occuring when the needle tip is interacting with the tissue and when the needle tip is outside the tissue. Data collected during the windows in which the needle tip travelled L1 are used to calculate Gftc and Gft.
3 Observations of Needle Tip and Tissue Interactions
As a first step toward modeling the deflection of the needle in a soft elastic medium, we determine the forces at the bevel tip. Misra et al. (2008b) investigated the sensitivity of tip forces to tissue rupture toughness, tissue elasticity, and needle tip bevel angle using finite element simulations; here we use an analytical model. In order to guide the development of models for a needle embedded in an elastic medium, we conducted experiments that enabled microscopic and macroscopic observations. We then develop an analytical model for the loads developed at the bevel tip and compare our model to experimental results with soft tissue simulants (the Plastisol and porcine gels described in the previous section).
3.1 Local Macroscopic Tip Observations
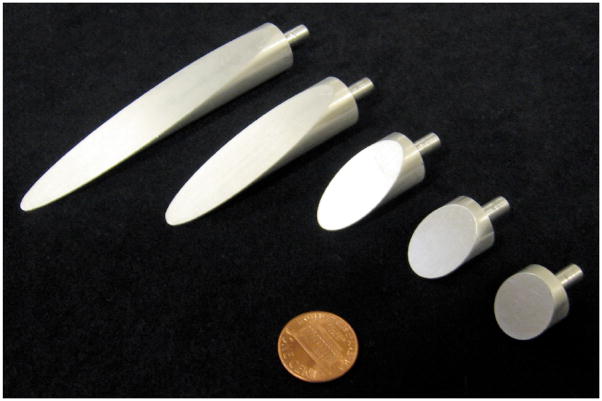
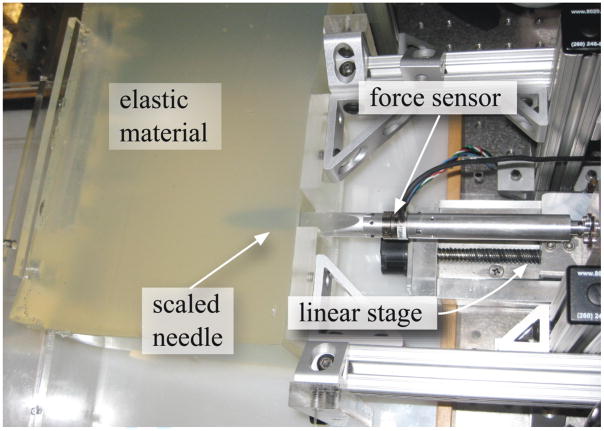
In order to understand the tissue cleavage process as the needle tip interacts with the medium, we performed experiments in which we physically magnified the bevel tip by machining needle tips of nominal diameter Ø 1.5 cm. These needle tips had five bevel angles ranging from 10° to 60°, as shown in Figure 10. We used the same three Plastisol gels and setup (Figure 11) from Section 2.4.2 for this study. The dimensions of the gel samples were 30 cm wide × 30 cm long × 8 cm thick. The needle insertion was performed in the center of the gel sample, and the boundary effects did not interfere with the local needle-gel interactions.
Figure 10.
Scaled needle tips of Ø 1.5 cm used in experiments to measure the forces between a needle tip and an elastic medium. We used needles with bevel angles of 10°, 15°, 30°, 45°, and 60° (shown left to right).
Figure 11.
Experimental setup used to insert a scaled needle with 10° bevel angle and Ø 1.5 cm into Plastisol gel A (least stiff).
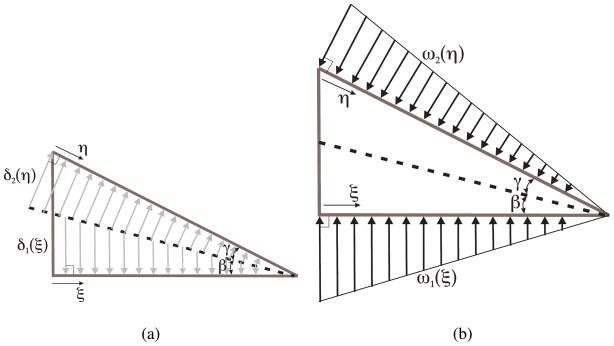
As the needle tip cuts through a soft solid, it moves material out of the way. We assume that the needle tip cuts the elastic medium along a straight line, shown as a dashed line in Figure 12(a). The angle by which the needle tip cuts and displaces material is given by β (cut angle). The material is displaced by δ1 (ξ) and δ2 (η) along the dashed line (cut path) in order to accommodate the needle tip (Figure 12(a)). As the needle tip interacts with the medium and moves forward, the displaced material results in a distributed load along the bevel and bottom edges of the needle tip.
Figure 12.
(a) The arrows show the displacement of material as the needle tip interacts with a soft solid, (b) A load distribution along the edges of the needle tip results in material moving out of the way to accommodate the needle tip. ξ, and η are defined as the positive directions for the triangular load distributions (and material displacements) on the bottom and bevel edges of the needle tip, respectively.
The load distribution along the edges of the needle tip is hypothesized to be triangular (Figure 12(b)). We have not characterized the frictional forces along the edges of the needle tip, or included them in the model. However, when needles interact with soft biological tissues during clinical procedures, fluids within the organ lubricate the needle’s surface and reduce friction. Thus, we believe that friction will not play a major role in the tip forces.
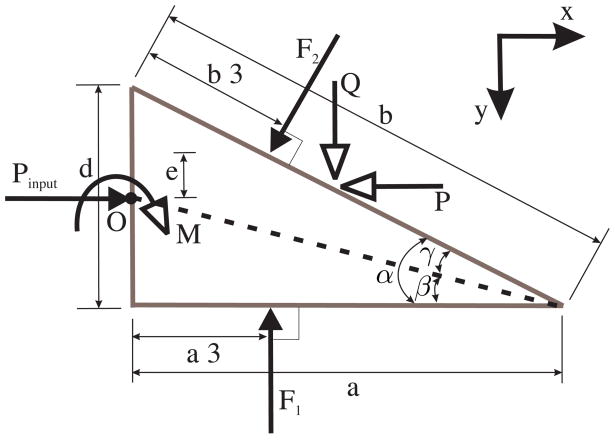
The resultant forces and moments acting on the needle tip due to deformation of the medium and inclusion of the bevel tip are shown in Figure 13. Using d and α, the diameter of the needle and the bevel angle, respectively, we define other variables representing various dimensions in Figure 13 as follows: α = γ + β, , and θ = 90° − α.
Figure 13.
Free-body diagram of the forces acting on the needle tip as it interacts with the elastic medium. Pinput does not necessarily act at the center of the needle cross section.
Our objective is to derive expressions for the forces and moments developed at the bevel tip. In particular, we are interested in the transverse load, Q, that results from the tip asymmetry causing the needle to bend. As previously denned, KT is the needle-tissue interaction stiffness per unit length. The triangular load distribution along the bottom edge of the needle, ω1(ξ), has the following constraints:
| (20) |
where δ1 (0) = a tan β. Similarly, the triangular load distribution along the bevel edge of the needle, ω2 (η), has the following constraints:
| (21) |
where δ2 (0) = b tan γ. With this triangular load distribution assumption, we derive the following total forces along the bottom and bevel edges of the needle:
| (22) |
| (23) |
We define Pinput as the input force used to drive the needle into the medium. Pinput does not necessarily act at the center of the needle cross section. The tissue cleavage process results in forces and moments acting on the needle tip. This pre-equilibrium phase of the needle tip is depicted in Figure 13. The resultant forces along the x and y directions are P and Q, respectively, and resultant moment, M, acting on the tip are:
| (24) |
| (25) |
| (26) |
We observe in (25) and (26) that the transverse tip force and the resultant tip moment are independent of the input force. The expressions are a function of the medium elasticity (KT) and the needle tip geometry. Both (25) and (26) are linear in KT.
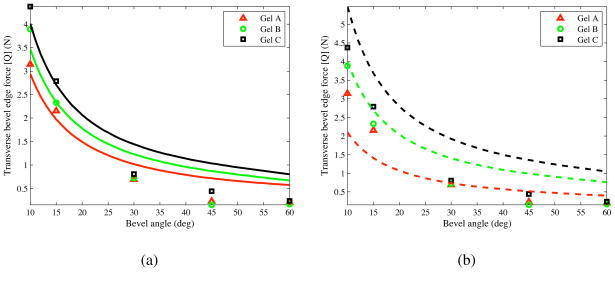
The inputs to the model are KT, a material property of the elastic medium, and β, which depends on both the medium and the bevel angle. KT is 4.83 kN/m2, 9.21 kN/m2, and 12.61 kN/m2, for gels A, B, and C, respectively, as shown in the previous section. The optimized values for β/α were obtained by minimizing the error between the experimentally derived normal force and the analytically derived Q, given in (25). For our model, β/α was 0.03, 0.21, and 0.26, for gels A, B, and C, respectively. We compared the transverse tip force, Q, derived in (25) to the experimental results. Figure 14(a) provides the maximum experimentally observed transverse force and analytically derived tip force for all bevel angles. Figure 14(b) shows the model when the ratio β/α is fixed at 0.17 for all materials, which is the mean of the optimized β/α values.
Figure 14.
Transverse tip load (Q) based on the analytical model and experiments, (a) The solid curves represent the analytical results when β/α is optimized for each material, (b) The dashed curves represent the analytical results when β/α = 0.17 for all materials.
While the modeled transverse tip force follows a trend similar to that of the experimental results, the model is not accurate over the entire range of bevel angles tested. There are several possible limitations to the model. First, it is possible that the cut angle varies as the needle tip insertion progresses, while we assume a constant cut angle for a given needle tip and gel. This assumption might account for the change in discrepancy as bevel angle (and thus insertion length) changes. Second, the model assumes a one-dimensional triangular load distribution, while the bevel face of the needle tip is an ellipse. Third, ignoring frictional effects (especially in the artificial tissues used here) would likely increase the errors for needle tips with larger bevel angles, i.e., larger contact area.
3.2 Local Microscopic Tip Observations
The previous section described macroscopic experiments to provide insight into the force balance for an asymmetric tip, and in this section we present microscopic observations in order to gain insight into the fracture processes. Microscopic observations of needle and elastic medium interactions have been reported previously (e.g. Shergold & Fleck (2005) and Azar & Hayward (2008)), but most of the published literature focuses on observing the damage to the gel or tissue surface after the needle has punctured the medium. Sections of the gel have also been observed, but again only after the needle has penetrated the medium. In order to observe the needle-tissue interaction within the gel as the needle is embedded in the medium, we used a Zeiss LSM 510 Meta laser scanning confocal microscope (Carl Zeiss AG, Oberkochen, Germany). The needle and gel were visualized with differential interference contrast (DIC), epifluorescence, and reflected light using the 488 nm line of an argon/ion laser and 0.3 NA Plan-Neofluar 10x objective lenses with pin hole diameter set at 9.33 Airy units.
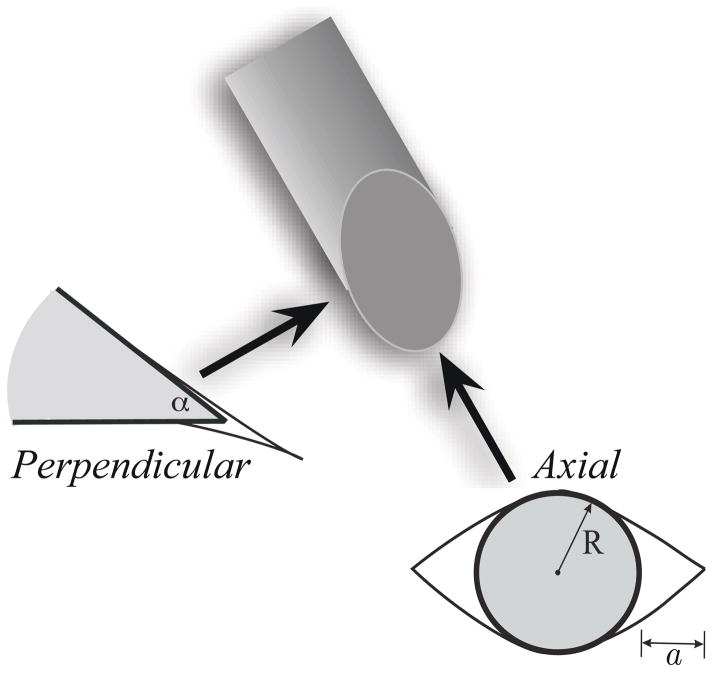
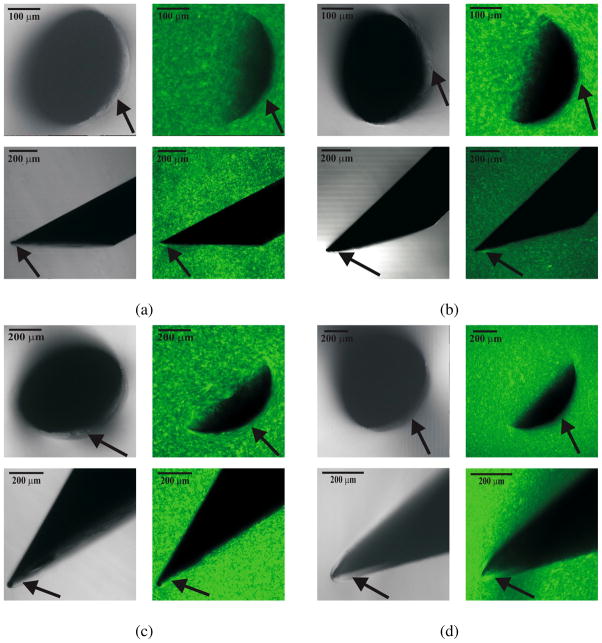
The ratio of plastic to softener for Plastisol gel was 4:1. The 400 cm3 gel was doped with 20 μl of 10 mg/ml rhodamine green solution (Invitrogen, Carlsbad, CA, USA). This dye was added to facilitate epifluorescent confocal imaging. Since a very small amount of dye was used, we assume that it does not significantly change the gel’s material properties. Cubes with sides of 0.5 cm were prepared and needles were manually inserted into the gel and viewed under the microscope. Observations were made in two configurations (axial and perpendicular) for needles of four different diameters and bevel angles (Figure 15). In the axial configuration, the laser light was along the needle axis, while in the perpendicular configuration the laser light was perpendicular to the needle axis. DIC and epifluorescent images were obtained for each configuration, as shown in Figure 16.
Figure 15.
Microscopic observations of needle-tissue interactions were made in two configurations: axial and perpendicular. The arrows indicate the direction of the laser light relative to the bevel tip of the needle. The figure also shows the cracks formed when a bevel-tipped needle interacts with a soft elastic medium. Axial configuration: Mode-I crack, or opening, where R and a are the needle radius and crack length, respectively. Perpendicular configuration: Mode-II crack, or rupture, where α is the bevel angle.
Figure 16.
Differential Interference Contrast (DIC) (first and third columns) and epifluorescent (second and fourth columns) images taken using a confocal microscope. The first and third rows are in the axial configuration, while the second and fourth rows pertain to the perpendicular configuration. The needle geometric properties were: (a) Ø 0.38 mm, α = 26.4° (b) Ø 0.40 mm, α = 33.9° (c) Ø 0.71 mm, α = 28.2° (d) Ø 0.90 mm, α = 26.6°. Arrows in the DIC and epifluorescent images in the axial configuration indicate the occurrence of a Mode-I crack (opening), while the arrows in the perpendicular configuration indicate a Mode-II crack (rupture).
In classical fracture mechanics, a Mode-I crack is characterized by opening and a Mode-II crack by sliding. Shergold and Fleck (2004) model the interaction of symmetric sharp-tipped and flat-bottomed punches with a soft medium as Mode-I and Mode-II cracks, respectively. As a bevel-tipped needle interacts with a soft elastic medium, we hypothesize that a combination of Mode-I and Mode-II cracks are developed. Figure 15 shows this hypothesized interaction and corresponding rupture of the soft medium. The size of the cracks has been exaggerated to highlight the modes. In the axial configuration, a Mode-I crack (an “opening”) occurs, while in the perpendicular configuration, a Mode-II crack (a “rupture”) occurs. We find these modes of fracture visible in the microscopic images.
For all the needles, opening and rupture are observed at the bevel edge. In the axial configuration, the needle cross-section appears crescent-shaped because of the bevel edge. In Figure 16, arrows in both the DIC and epifluorescent images in the axial configuration indicate regions where Mode-I crack (opening) of the gel is visible. In the perpendicular configuration, arrows point to the occurrence of Mode-II crack (rupture) near the bevel edge of the needle. In the epifluorescent images, the speckle pattern is uniform except in regions near the bevel face of the tip. In these regions, the gel appears to trace along the edges of the needle tip. This is an indication of a Mode-I crack (axial) and a Mode-II crack (perpendicular) in the gel. Unlike brittle materials, significant crack propagation (classical unstable Mode-I fracture) is not seen during the interaction of sharp needles and soft gels (Anderson 2004).
4 Needle and Tissue Interaction Model
We now present a mechanics-based model that incorporates the results from microscopic and macroscopic experiments described in the previous section. The model describes the deflection of a bevel-tip needle inserted in an elastic medium. The analysis assumes a two-dimensional model with the needle undergoing a single bend. The derived model incorporates the needle material and geometric properties, as well as the local and global elastic properties of the medium. Further, given the deflection, the radius of curvature of the needle can be readily evaluated.
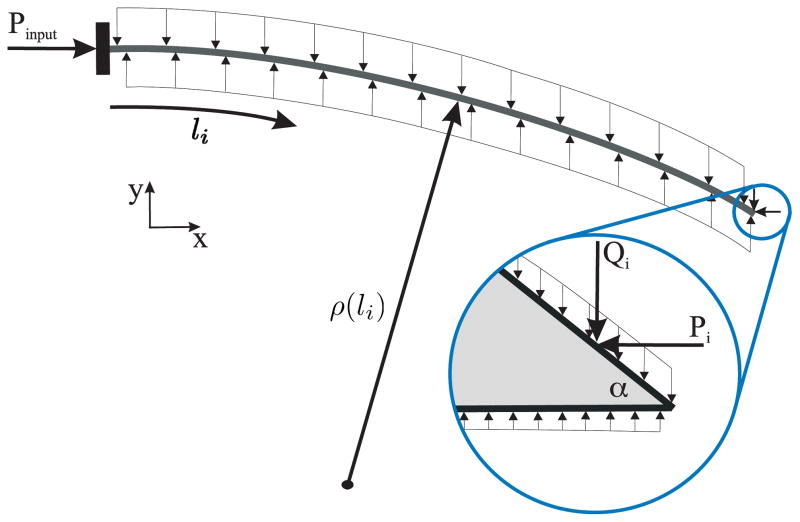
In the derivation presented below, the needle trajectory is discretized into a series of steps (increments of insertion), i, where the length of the needle is li. Figure 17 depicts the load distribution of a needle of length li surrounded by an elastic medium, where Pinput is the applied needle insertion force, and Pi and Qi are the tip loads at the bevel edge. The deflections in the transverse and axial directions at each step are vi (x) and ui (x), respectively. The functional form for the deflection of the needle in an elastic medium is initially assumed, and the Rayleigh-Ritz approach is used to evaluate the coefficients of the deflection equation. The Rayleigh-Ritz method is a variational method in which equilibrium is established as the minimum of a potential defined by the sum of the total energy and work done by the system.
Figure 17.
Distributed compressive load acting on a needle shaft as it interacts with an elastic medium. The frictional forces have been ignored in the model. Inset: Forces acting on the bevel tip, where Pi and Qi are the resultant forces along the bevel edge.
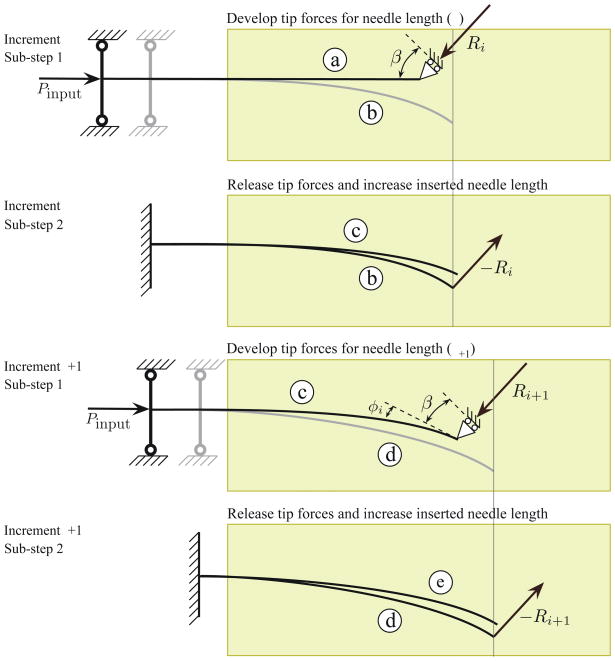
The process of needle insertion through a soft elastic medium can be viewed as occurring in two phases (Barbè et al. 2007). First, the needle is pushed into the medium, which results in forces generated at the tip and also along the needle shaft. Second, rupture of the medium and crack formation occurs near the tip, and the needle progresses forward. This cycle is then repeated. To capture the forces developed at the needle tip, tissue rupture, and subsequent bending and propagation of the needle, we divide the needle insertion process at each increment into two sub-steps. During sub-step 1, an input force is applied to the base of the needle, which causes the needle shaft and tip to push against the tissue. This phenomenon is modeled as a needle with a roller support at one end, as shown in Figure 18 (configuration ⓐ). The inclined roller at the needle tip is an abstraction for a geometric constraint at the tip. The angle of the inclined roller is equal to β, the cut angle, defined in Section 3.1. The presence of the roller boundary constraint results in reaction forces due to the input force. The reaction forces at the needle tip are given by
Figure 18.
Needle-tissue interaction model shown for two increments with two sub-steps each. In sub-step 1 (increment i), the needle is initially at configuration ⓐ. At the end of sub-step 2 (increment i), the needle is at configuration ⓒ. In sub-step 1 (increment i + 1), the needle is initially at configuration ⓒ. It deflects to configuration ⓔ at the end of sub-step 2 (increment i + 1). Ri and Ri+1 are the resultant reaction forces due to the presence of the roller boundary constraint in increments i and i + 1. The needle deflects to configurations ⓑ and ⓓ in increments i and i + 1, respectively due to the presence of these reaction forces and the insertion force (Pinput)- β is the cut angle and φi is the angle between the local and global tip configurations.
| (27) |
| (28) |
where Hi and Vi are the tip reaction forces in the local deformed configuration in the axial and transverse directions, respectively. In (27) and (28), E, A, and I are the Young’s modulus, cross-sectional area, and second moment of inertia of the needle, respectively. The reaction forces in the global configuration are Pi and Qi. The orientation, φi, between the local and global tip configurations is computed from the slope at the tip:
| (29) |
The needle goes from configuration (ⓐ) to ⓑ due to its interaction with the surrounding medium, the applied input force, and the geometric tip constraint. The deflected shape of the needle in sub-step 1 is shown in Figure 18 (configuration ⓑ). The resultant reaction force in the global configuration is Ri. Further application of input force results in the needle advancing. The increase in the inserted needle length at the base is ui (0), which is calculated in sub-step 1 and applied to sub-step 2.
Sub-step 2 captures rupture of the tissue due to tip forces and calculates the resulting deflection of the needle. Here we start at the deflected configuration of the needle, which is obtained from sub-step 1, as shown in Figure 18 (configuration ⓑ). The tip reaction forces computed in sub-step 1 are released (due to rupture of tissue) and applied as tip loads in the opposite direction in sub-step 2. The resulting deflection of the needle at the end of sub-step 2 is the configuration of the needle at the end of the increment, as shown in Figure 18 (configuration ⓒ). The input force is not applied to the system since the needle is supported by the surrounding medium. Figure 18 depicts two increments of this process, each with the two sub-steps. By decoupling the needle insertion and its subsequent bending into two sub-steps, we can compute the tip forces and, thus, the deflection of the needle.
In the Rayleigh-Ritz method, the expression for system potential includes assumed displacement functions satisfying the geometric boundary constraints of the system. The system potential of the needle-tissue interaction model is Λ1 and Λ2 for sub-steps 1 and 2, respectively:
| (30) |
| (31) |
where NE and SE are the energies associated with needle bending and needle-tissue interaction, WQ and WP are the work due to transverse and axial bevel tip loads, and WR is the work done to rupture the tissue. The subscripts 1 and 2 are used to signify sub-steps 1 and 2. We now derive explicit expressions for each of the terms in the system potential equations. We do not use the sub-step index in the derivations below, since the equations are applicable to both sub-steps.
4.1 Needle Bending
A flexible needle interacting with a soft elastic medium bends both in the transverse and axial directions. The axial compression of the needle is negligible compared to the bending in the transverse direction, but has been included in the analysis for completeness. In (30) and (31), NE is the sum of energy due to pure needle bending, [UB, and bending due to axial load, UA:
| (32) |
The general expression for curvature is
| (33) |
The energy due to the transverse bending of the needle of length li is (Timoshenko & Gere 1961)
| (34) |
In our model, UB is the energy associated with the current transverse needle deflection (vi), and the difference between the current and previous needle deflections (vi − vi−1 ). Thus, using (33) and (34), for needle segments of length li, UB is
| (35) |
Similarly, the bending due to axial load is
| (36) |
4.2 Needle-Tissue Interaction
As the needle is inserted into a soft elastic medium, the medium pushes against the needle shaft. SE is the energy associated with this needle-tissue interaction. In (30) and (31), SE is a combination of energy stored in the system due to compression of the elastic medium, UC, and interaction of the elastic medium along the needle shaft, UT:
| (37) |
The compression of the medium occurs at the tip and also along the needle shaft. Pressure is applied by the needle to the elastic medium and ΔV is the resulting change in volume of the medium. Thus, UC is
| (38) |
where K is the bulk modulus of the elastic medium and the change in volume of the medium is ΔV =Ali. For linear elastic materials, , where ET and vT are the Young’s Modulus and Poisson’s ratio of the medium, respectively. Thus,
| (39) |
The soft elastic medium supports the needle as it is embedded in the medium and UT accounts for this interaction. As mentioned earlier, the needle trajectory is discretized into a series of steps and UT is calculated at each step:
| (40) |
where KT is the stiffness of the elastic medium per unit length previously derived in (13). UT is a function of the square of the needle deflection. If the needle were embedded in the tissue straight and then bent by tip loads, the transverse deflection in the needle would be vi itself. However, since the needle cuts a path through the tissue, only the difference between the previous (vi−1) and the current (vi) needle deflections are considered in the calculation of UT.
4.3 Work
In addition to the energies associated with the system, the potential also contains the work done by the system. In (30), the work done by the input insertion force is
| (41) |
In (31), the work done by the transverse tip load, Qi, is
| (42) |
Also, the work done by the axial tip load, Pi, is
| (43) |
In order to account for the cracks observed in the microscopic images (Section 3.2), the work done to rupture the elastic medium is WR. It is a function of the effective rupture toughness, Gc, and the amount of tear or rupture, a. Thus,
| (44) |
5 Results
We now present a comparison of experimental and simulation results of needle insertion through a soft elastic medium, where the simulation is based on the energy-based model developed in the previous section. We also present results of the parametric simulation studies where the input force and the cut angle were varied. We begin by describing the robotic needle insertion experiments.
5.1 Robotic Insertion of Flexible Needles: Experiments
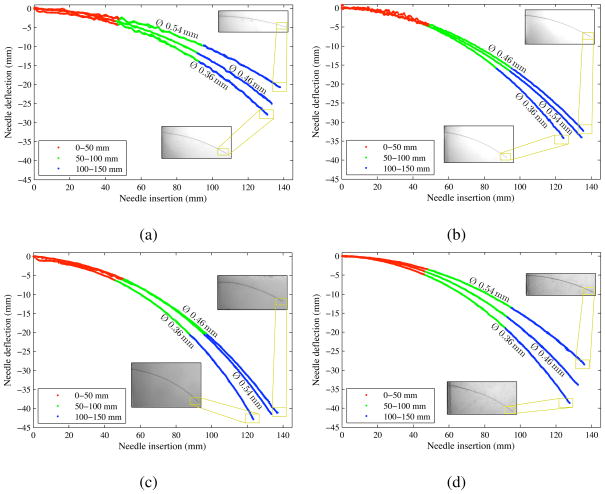
We used the experimental setup shown in Figure 8 to measure the radius of curvature for three needles inserted into four different artificial tissues. The needles and gels were the same as those used in the toughness experiments (Section 2.4.2). For each experiment, we inserted the needle 150 mm into the gel at a constant velocity of 2.5 mm/sec. To measure the consistency of the radius of curvature throughout the insertion, we sectioned the needle tip path into three 50 mm regions and calculated the radius of curvature over these sections. Figure 19 shows the needle tip positions for three needles inserted into the gels. The figure only shows planar data from one camera, although we used the full three-dimensional triangulated positions from two cameras to calculate the radius of curvature for each insertion. The triangulation was computed from unfiltered camera data. Table 2 shows the radii calculated over multiple sections of the needle. We found that a needle length segment of 50 mm was sufficiently large to fit a circle in order to allow a comparison of the radius of curvature across segments. The radius of curvature varies by an average of 8.1% throughout these twelve insertions, with half of the insertions deviating less than 3.6%. For a radius of curvature of 300 mm, this 8.1% variation will change the needle tip position by 6.8 mm. A 3.6% variation changes the tip position by 3.2 mm. These positions are calculated using a 150 mm arc length (insertion distance) around a circle of the specified radius. Since the variation in radius of curvature is relatively small, we assume a constant radius of curvature throughout the insertion, which corresponds to the kinematic model of Webster III et al. (2006). Park et al. (2010) provide further description of the intra-trial variation of needle insertions.
Figure 19.
Experimental data showing needle tip trajectories. During each 150 mm insertion, the tip position is measured. The radius of curvature remains relatively constant throughout the insertion, (a) Plastisol gel A (least stiff), (b) Plastisol gel B. (c) Plastisol gel C (most stiff), (d) Porcine gel. The needles were the same as those described in Section 2.4.2, Ø 0.36 mm (α = 32.09°), Ø 0.46 mm (α = 31.89°), and Ø 0.54 mm (α = 34.85°).
Table 2.
Radius of curvature for needle path segments, ρ̄ is the mean of ρ1, ρ2, and ρ3. Percentage deviation is calculated as .
| Gel | Needle Ø (mm) | Radius of curvature (mm) |
Deviation (ρ̄ and ρexp) | ||||
|---|---|---|---|---|---|---|---|
| 0–50 mm ρ1 | 50–100 mm ρ2 | 100–150 mm ρ3 | Mean ρ̄ | 0–150 mm ρexp | |||
| Plastisol A (least stiff) | 0.36 | 399.4 | 310.4 | 252.7 | 320.8 | 318.1 | 0.9% |
| 0.46 | 314.2 | 349.9 | 319.6 | 327.9 | 377.9 | 13.2% | |
| 0.54 | 543.0 | 440.0 | 234.9 | 406.0 | 477.3 | 14.9% | |
| Plastisol B | 0.36 | 302.5 | 240.5 | 210.7 | 251.2 | 242.8 | 3.5% |
| 0.46 | 195.8 | 328.3 | 285.1 | 269.7 | 305.9 | 11.8% | |
| 0.54 | 203.4 | 291.8 | 276.5 | 257.2 | 287.8 | 10.6% | |
| Plastisol C (most stiff) | 0.36 | 105.8 | 194.8 | 165.3 | 155.3 | 206.7 | 24.9% |
| 0.46 | 276.3 | 212.8 | 212.3 | 233.8 | 234.6 | 0.3% | |
| 0.54 | 324.3 | 231.0 | 224.4 | 259.9 | 240.0 | 8.3% | |
| Porcine | 0.36 | 242.0 | 214.8 | 263.1 | 240.0 | 231.9 | 3.5% |
| 0.46 | 294.9 | 266.4 | 239.7 | 267.0 | 275.5 | 3.1% | |
| 0.54 | 347.4 | 337.4 | 314.3 | 333.0 | 339.8 | 2.0% | |
In addition to deflection and radius of curvature measurements, we also performed preliminary experiments to study the effect of friction during interactions of the needle with the soft elastic medium (gel C). For these studies we used two Nitinol needles of Ø 0.22 mm and bevel angle α = 36.8°. One of the needles had a Teflon® (E. I. du Pont de Nemours and Company, Wilmington, DE, USA) coating in order to minimize the effect of friction along the needle shaft and the other needle was uncoated. Both needles were inserted 150 mm at 2.5 mm/s. The maximum insertion force was observed to be 4.9 mN and 2.6 mN for the uncoated and Teflon®-coated needles, respectively. Despite the 46.9% decrease in insertion force due to the Teflon® coating, the radius of curvature only increased by 8.3%. Thus, the impact of friction on needle path curvature is not very large. Further, it should be noted that soft tissue simulants such as Plastisol do not accurately represent the friction properties of biological organs, the fluids of which lubricate the needle shaft during insertion.
5.2 Comparison of Simulation and Experimental Results
We now present the needle deflection simulation results obtained using the model developed in Section 4. As mentioned earlier, in the Rayleigh-Ritz method, the functional form of the needle transverse (vis̃) and axial (uis̃) deflections are initially assumed for sub-steps 1 and 2 (s̃ = 1 or 2). We chose standard Hermite polynomials
| (45) |
and
| (46) |
where vis̃ and uis̃ satisfy the following geometric boundary conditions. For sub-step 1,
| (47) |
and for sub-step 2,
| (48) |
Using the Rayleigh-Ritz method, the coefficients aks̃ and bks̃ for k = 0, 1, 2, and 3, and cjs̃ for j = 0 and 1, are evaluated by minimizing the system potential at each sub-step given in (30) and (31). This provides us with aks̃, bks̃ and cjs̃ that satisfy the equilibrium conditions. The deflection equation coefficients are calculated by setting
| (49) |
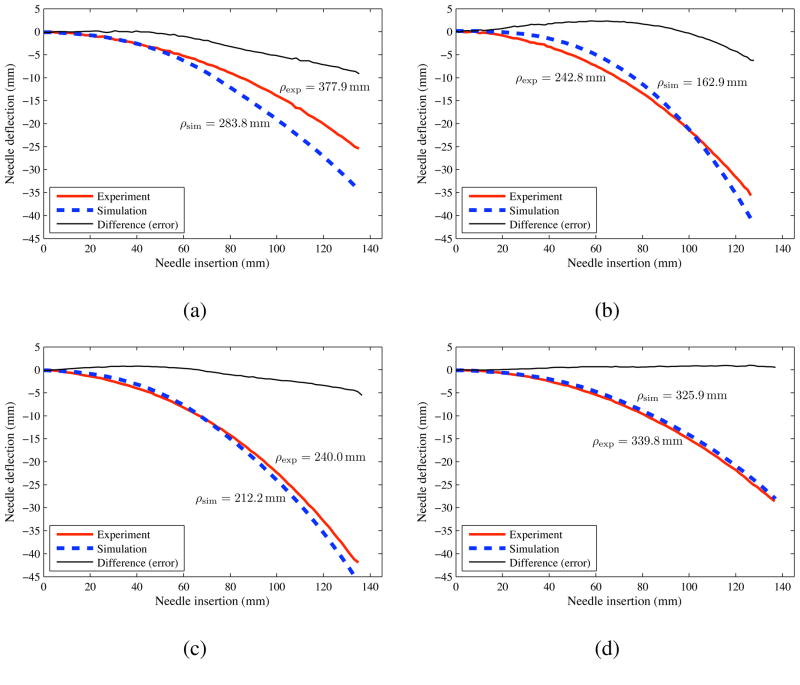
The needle geometric and medium-specific material parameters are given in Section 2.4.2 and Table 1, respectively, while the Young’s modulus of the needle (Nitinol wire) was assumed to be that of Nitinol (50 GPa). The two simulation control parameters are the input force (Pinput) and the cut angle (β). Pinput is set as 7 mN, 2 mN, 15 raN, and 5.5 mN for gels A, B, C, and porcine gelatin, respectively. The ratio β/α is specified to be 0.7, 0.3, 0.75, and 0.45 for gels A, B, C, and porcine gelatin, respectively. Initial values of β/α were assumed and then optimized to get the best fit between the experimental and simulation data. Figure 20 shows the needle deflection for the different needles inserted through various soft gels. The prescribed needle insertion distance for the simulations was 150 mm, but was truncated to match the insertions of the experimental data for comparison. Figure 20 also provides the radius of curvature of the needle insertions. Table 3 compares the experimental and simulation radius of curvature and final tip deflection values. The largest (32.9%) difference in the radius of curvature between the experimental and simulation results was observed for gel B and the thinnest needle, while the smallest (4.1%) difference was observed for porcine gel and the largest needle. The smallest (2.1%) deviation in final tip deflection was observed for porcine gel and the largest needle. In spite of several modeling assumptions, such as use of a two-dimensional model, ignoring frictional effects, approximate value of the needle insertion force, and lack of accurate knowledge of the cut angle, the current version of our mechanics-based model predicts the bending of the needle with reasonable accuracy. The kinematic model in Webster III et al. (2006) shows a better fit than our model to experimental data not only because the parameters are empirically fit but also because it uses a very stiff artificial tissue. When the kinematic model is applied to path planning and control in softer tissues, such as shown by Reed et al. (2008), there are significant deviations between the model and experimental data. In soft materials, the mechanics-based model has similar accuracy to that of the empirically fit kinematic model.
Figure 20.
Experimental (exp) and simulation (sim) results for needle deflection versus insertion distance. (a) Plastisol gel A (least stiff) with the Ø 0.46 mm (α = 31.89°) needle. (b) Plastisol gel B with the Ø 0.36 mm (α = 32.09°) needle. (c) Plastisol gel C (most stiff) with the Ø 0.54 mm (α = 34.85°) needle. (d) Porcine gel with the Ø 0.54 mm (α = 34.85°) needle.
Table 3.
Comparison of experimental and simulation final needle tip deflection and radius of curvature values. Percentage deviations are calculated as and .
| Case (Gel/Needle) | Final tip deflection |
Deviation (ρexp and ρsim) | ||
|---|---|---|---|---|
| vexp (mm) | vsim (mm) | Deviation | ||
| Plastisol A/Ø 0.46 mm | 25.4 | 34.5 | 35.8% | 24.9% |
| Plastisol B/Ø 0.36 mm | 35.7 | 42.1 | 17.9% | 32.9% |
| Plastisol C/Ø 0.54 mm | 41.9 | 47.3 | 12.9% | 11.6% |
| Porcine/Ø 0.54 mm | 28.6 | 28.0 | 2.1% | 4.1% |
The model accuracy required for steering needles through soft tissue is currently not known. The current planning and control used by Reed et al. (2008) do not involve mechanics. So long as the problems never stray from the training data, this is typically adequate. The advantage of a mechanics-based model, even when used with phenomenological extensions, and augmented with some black box control algorithms, is that predictions will remain grounded in physical reality. In addition, fundamental knowledge of tissue and needle mechanical properties can be used to derive the model, so “patient-specific” experiments are not required. Given separate needle- and tissue-specific parameters that can be known a priori, our model aims to predict the deflection of needle as it interacts with the medium.
5.3 Sensitivity Studies
Our needle-tissue interaction model contains two inputs in addition to tissue and needle material and geometric properties. These are the input force and the cut angle. In order to highlight and understand the sensitivity of these two parameters on our model, we performed parametric studies. Unless specified otherwise, the medium was porcine gel and the Young’s modulus of the needle was 50 GPa (Nitinol).
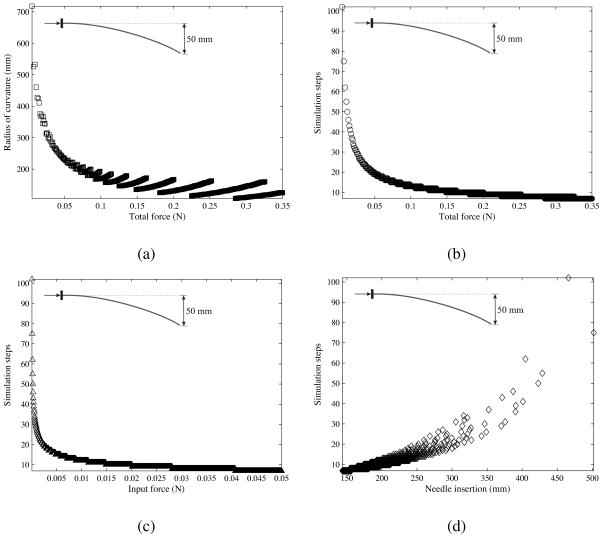
In the first sensitivity study, all needle- and medium-specific parameters were kept constant except the input force. The needle geometric properties were Ø 0.46 mm (α = 31.89°). The ratio β/α was set to 0.5. The input force (Pinput) was varied from 0.05 mN to 0.05 N in increments of 0.05 mN and the needle was prescribed to reach a deflection of 50 mm. The input force controls the number of simulation steps required by the model to achieve the prescribed needle deflection. Thus, for a small input force, the number of simulation steps required to reach the prescribed deflection will be large. Figure 21 shows the results of this sensitivity study, where each data point on the plot is a final value obtained from one simulation case.
Figure 21.
Variation in the (a) needle radius of curvature and (b) simulation steps as the total force changes. Also, shown are changes in the (c) simulation steps as the input force varies and (d) needle insertion length as the simulation steps varies. The total force is defined as the input force multiplied by the number of simulation steps required by the needle to reach the prescribed deflection of 50 mm.
The total force is defined as the input force multiplied by the number of simulation steps required by the needle to reach the prescribed deflection of 50 mm. The total force is a more appropriate metric than input force, which varies for each simulation case. Figure 21(a) shows the variation in radius of curvature as the total force changes. For a larger total force, the value and the variation in the needle radius of curvature are smaller. Figure 21(b) shows that the number of simulation steps required to reach the prescribed deflection reduces as the total force increases. Figure 21(c) demonstrates that, for larger input force values, there is no significant increase in the number of simulation steps. Further, as expected, Figure 21(d) shows that an increase in simulation steps causes the needle insertion length to increase. Another interpretation of these plots is that small total forces result in longer insertion lengths necessary to reach the fixed deflection of 50 mm, while larger total forces have the opposite effect. However, small total forces also result in larger radii of curvature, and hence poor needle steerability. Thus, an optimal value of insertion force should be chosen to obtain the required steerability to reach a target within a given insertion distance.
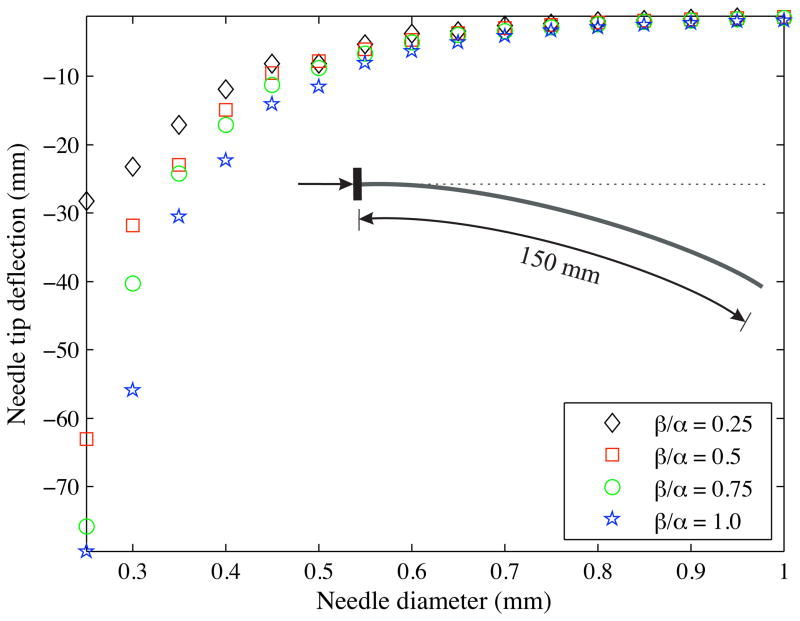
In the next set of sensitivity studies, we varied the ratio of the cut angle to bevel angle (i.e., β/α) from 0.25 to 1.0 in increments of 0.25. The bevel angle and the input force were set to 45° and 0.5 mN, respectively, and the needle insertion distance was prescribed to be 150 mm. Figure 22 shows the variation in the final needle tip deflection as the needle diameter changes. Each data point corresponds to a simulation case with a specific needle diameter and β/α value. A decrease in β/α implies a reduction in the cut angle, which implies that the cut or rupture path of the needle is not steep and hence, the needle deflection is less. Also, an increase in needle diameter results in an increase in the flexural rigidity of the needle and a reduction in the needle bending, which is observed in the simulations and experiments.
Figure 22.
Variation in the final needle tip deflection as the cut angle and needle diameter are changed. The needle insertion distance was prescribed to be 150 mm.
In order to assess the role of variability in the difference between the experimental and simulated results, we performed a model uncertainty analysis in which both measured and input parameters were given a ±10% uncertainty. The results of this study are tabulated in Table 4. The varied parameters include the needle parameters (bevel angle, diameter, and Youngs modulus), tissue parameters (elasticity and rupture toughness), and the simulation input parameters (β/α and input force). The radius of curvature was computed as each of these parameters were varied and compared to the experimental value of a Ø 0.54 mm (α = 34.85°) needle inserted through Plastisol gel C. Variation in the needle diameter resulted in the largest changes in the radius of curvature, while variation in the rupture toughness had the least effect on the radius of curvature.
Table 4.
Model uncertainity analysis: Percentage variation in radius of curvature as measured and simulation input parameters are changed by ±10%.
| Needle | Tissue | Simulation input | |||||
|---|---|---|---|---|---|---|---|
| ρexp (240.0 mm) | α (34.85°) | Ø (0.54 mm) | E (50 GPa) | ET (45.24 kPa) | Gc (221.04 N/m) | Pinput (0.015 N) | β/α (0.75) |
| ±10.5% | ±41.4% | ±14.4% | ±12.2% | ±7.9% | ±10.0% | ±10.5% | |
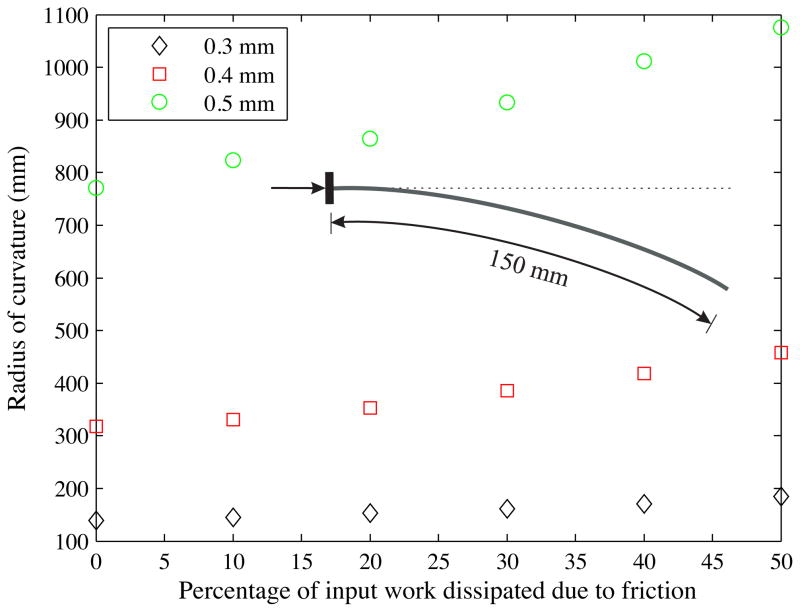
In addition to the sensitivity analysis, we also performed preliminary studies to determine the effect of friction, which is not present in the current model. The model given in (30) and (31) has the potential to include an energy term to represent friction dissipation. We performed simulations in which we varied the percentage of input work to overcome friction and observed the variation in the radius of curvature (Figure 23). The dissipation due to friction was expressed as a function of the input work and varied from 0% to 50%. The bevel angle and the input force were set to 45° and 0.5 mN, respectively, and the needle insertion distance was prescribed to be 150 mm. Three different needle diameters were simulated. The thickest (Ø 0.5 mm) needle has the largest (39.5%) increase in radius of curvature when the energy dissipation due to friction is 50% of the input work. Future tissue-specific studies include conducting experiments to test the accuracy of the energy dissipation term and also develop phenomenological needle-tissue friction models. These models could be developed using the experimental techniques presented in Podder et al. (2005) and also described in Section 5.1 (Teflon®-coated and uncoated needle insertion studies).
Figure 23.
Computed variation in the radius of curvature as the energy dissipation due to friction (0% to 50% of input work) and needle diameter (Ø 0.3 mm, Ø 0.4 mm, and Ø 0.5 mm) are changed. Items in the legend represent needle diameters. The needle insertion distance was prescribed to be 150 mm.
6 Summary and Future Work
Needles with asymmetric bevel tips naturally bend when they are inserted into tissue, an effect that can be harnessed by a robot-assisted needle steering system in order to enhance the accuracy of and enable new medical procedures. A mechanics-based model of needle-tissue interaction is needed for practical path planning and control of steerable needles.
We first presented an analytical formulation to calculate needle-tissue interaction forces and the moment at the bevel tip. The model relates the cut angle and medium material property to the tip loads, and was compared to experimental data from insertions with physically scaled-up needle tips. The experimental and analytical models exhibit similar trends for the transverse tip loads, but discrepancies were especially large for large bevel angles. Possible causes for differences between the model and experimental results are neglecting the effects of friction and lack of accurate knowledge of the cut angle. Experimental evidence has shown that needles with smaller bevel angles have larger curvature and hence, greater steerability (Webster III et al. 2005). Similarly, our analytical model and experiments show that smaller bevel angles result in larger transverse tip forces, which is an indication of greater needle bending and thus, larger curvature.
We also developed a mechanics-based model to determine the deflection of a robotically steered needle interacting with a soft elastic medium. The material and geometric parameters of the needle and tissue are inputs to the model. We demonstrated a technique to extract physically relevant tissue properties (tissue rupture toughness and nonlinear elasticity) and incorporated them into our needle-tissue interaction model. The energy-based model was guided by observations from confocal microscopic images, as well as macroscopic needle tip and gel interactions. Needle insertion experiments using several soft tissue simulants and needles were conducted for comparison with the simulation model. The model predicts the deflection and radius of curvature given two control inputs, input force and cut angle, and simulation results follow the trends of experimental data. Further, sensitivity studies with our current and previous (Misra et al. 2009) models indicate that the deflection of the needle is greatly influenced by the diameter of the needle, and not so much by small variations in the stiffness of the material. This is consistent with our experimental observations, in which increasing the needle diameter reduced the steerability of the needle. The formulation presented could be applied in general to a needle interacting with an elastic medium and is not specific to bevel-tip needles.
Section 5 demonstrated the similarity between the model and experimental data for needle deflection and radius of curvature. The variations in experimental and simulation results could be attributed to an approximate value of the needle insertion force that was provided as input into the simulation model and a lack of accurate knowledge of the cut angle. The model presented in this study introduces the needle-tissue interaction stiffness per unit length, KT, which was assumed to be a constant value. Future work could include considering tissue inhomogeneity and anisotropy by using KT (x,y) and setting KT (x) ≠ KT (y), respectively. In addition to stiffness, the model could also include needle-tissue interaction damping to account for the viscoelastic behavior of tissue. Given the elasticity properties of biological tissue, and the material and geometric properties of the needle, our model would predict the deflection of the needle and the interaction forces during insertion.
Possible extensions to the current study include microscopic observations of dynamic needle insertion through tissue using a linear actuator. Such studies would help characterize the dynamic rupture of soft solids, which are different from the conventional and well-understood fracture of brittle materials. These studies would also provide insight into the variation in the cut angle as needle insertion occurs. Friction is present in the system, but experiments indicate that its effect on radius of curvature is minimal. Further, we believe that as a first approximation ignoring friction still provides useful insights into the needle-tissue interaction behavior. As highlighted in this paper, our model has the potential to include an energy term to represent friction dissipation. Future studies could include experiments to specifically test the accuracy of such a term, and also consider more sophisticated friction models.
For robotically steered bevel-tip needles, an analytical model that predicts the interaction forces and deflection of the needle is desirable for optimization of system design, path planning, and real-time control. Our mechanics-based model, coupled with image-guided control, will improve the feasibility and accuracy of robotically steering flexible needles through biological tissue. In contrast to previous work in needle steering modeling, inputs to this model are fundamental properties: needle geometry and mechanical properties, and tissue material properties. Our present work investigated the interactions of a needle in an elastic medium as a two-dimensional problem with a single curve. Directions for future work include extending our work to a three-dimensional needle-tissue interaction model with multiple curves, using the model to choose feasible clinical applications and optimize needle design, and further analysis of path planning and control strategies to determine the necessary model fidelity for needle steering in biological tissues.
Acknowledgments
This work was supported by U.S. National Institutes of Health grant (R01 EB006435) and a Link Foundation fellowship. The authors thank Andrew S. Douglas his help and advice.
References
- Abolhassani N, Patel RV. Deflection of a flexible needle during insertion into soft tissue. Proc. Int’l. Conf. IEEE Engineering in Medicine and Biology; New York, USA. 2006. pp. 3858–3861. [DOI] [PubMed] [Google Scholar]
- Abolhassani N, Patel RV, Moallem M. Needle insertion into soft tissue: a survey. Medical Engineering and Physics. 2007;29(4):413–431. doi: 10.1016/j.medengphy.2006.07.003. [DOI] [PubMed] [Google Scholar]
- Alterovitz R, Branicky M, Goldberg K. Motion planning under uncertainty for image-guided medical needle steering. Int’l J Robotics Research. 2008;27(11–12):1361–1374. doi: 10.1177/0278364908097661. [DOI] [PMC free article] [PubMed] [Google Scholar]
- Alterovitz R, Goldberg K, Pouliot J, Taschereau R, Hsu CI. Needle insertion and radioactive seed implantation in human tissues: simulation and sensitivity analysis. Proc. IEEE Int’l. Conf. Robotics and Automation; Taipei, Taiwan. 2003. pp. 1793–1799. [Google Scholar]
- Anderson TL. Fracture mechanics: fundamentals and applications. 3. CRC Press; Boca Raton, USA: 2004. [Google Scholar]
- Azar T, Hayward V. Int’l Symp Computational Models for Biomedical Simulation (ISBMS) Vol. 5104. Springer; Berlin/Heidelberg: 2008. Estimation of the fracture toughness of soft tissue from needle insertion; pp. 166–175. Lecture Notes in Computer Science. [Google Scholar]
- Barbè L, Baylea B, de Mathelina M, Gangib A. Needle insertions modeling: identifiability and limitations. Biomedical Signal Processing and Control. 2007;2(3):191–198. [Google Scholar]
- Barenblatt GI. Scaling, self-similarity, and intermediate asympotics. 1. Cambridge University Press; Cambridge, UK: 2002. [Google Scholar]
- Crouch JR, Schneider CM, Wainer J, Okamura AM. 8th Int’l Conf Medical Image Computing and Computer Assisted Intervention (MICCAI) Vol. 3750. Springer; Berlin/Heidelberg: 2005. A velocity-dependent model for needle insertion in soft tissue; pp. 624–632. Lecture Notes in Computer Science. [DOI] [PubMed] [Google Scholar]
- Dehghan E. PhD thesis. University of British Columbia; Vancouver, Canada: 2009. Needle insertion simulation and path planning for prostate brachytherapy. [Google Scholar]
- DiMaio SP, Salcudean SE. Needle insertion modeling and simulation. IEEE Trans Robotics and Automation. 2003;19(5):864–875. [Google Scholar]
- DiMaio SP, Salcudean SE. Interactive simulation of needle insertion models. IEEE Trans Biomedical Engineering. 2005;52(7):1167–1179. doi: 10.1109/TBME.2005.847548. [DOI] [PubMed] [Google Scholar]
- Engh JA, Podnar G, Khoo S, Riviere C. Flexible needle steering system for percutaneous access to deep zones of the brain. Proc. 32nd Annual IEEE Northeast Bioengineering Conf; Easton, USA. 2006. pp. 103–104. [Google Scholar]
- Glozman D, Shoham M. Image-guided robotic flexible needle steering. IEEE Trans Robotics. 2007;23(3):459–467. [Google Scholar]
- Gurtin ME. An introduction to continuum mechanics. 1. Academic Press; London, UK: 2003. [Google Scholar]
- Heverly M, Dupont P, Triedman J. Trajectory optimization for dynamic needle insertion. Proc. IEEE Int’l. Conf. Robotics and Automation; Barcelona, Spain. 2005. pp. 1646–1651. [Google Scholar]
- Hing JT, Brooks AD, Desai JP. Reality-based needle insertion simulation for haptic feedback in prostate brachytherapy. Proc. IEEE Int’l. Conf. Robotics and Automation; Orlando, USA. 2006. pp. 619–624. [Google Scholar]
- Kallem V, Cowan NJ. Image guidance of flexible tip-steerable needles. IEEE Trans Robotics. 2009;25(1):67–78. doi: 10.1109/TRO.2008.2010357. [DOI] [PMC free article] [PubMed] [Google Scholar]
- Misra S, Ramesh KT, Okamura AM. Modeling of tool-tissue interactions for computer-based surgical simulation: a literature review. Presence: Teleoperators and Virtual Environments. 2008a;17(5):463–491. doi: 10.1162/pres.17.5.463. [DOI] [PMC free article] [PubMed] [Google Scholar]
- Misra S, Reed KB, Douglas AS, Ramesh KT, Okamura AM. Needle-tissue interaction forces for bevel-tip steerable needles. IEEE RAS/EMBS Int’l. Conf. on Biomedical Robotics and Biomechatronics; Scottsdale, USA. 2008b. pp. 224–231. [DOI] [PMC free article] [PubMed] [Google Scholar]
- Misra S, Reed KB, Schafer BW, Ramesh KT, Okamura AM. Observations and models for needle-tissue interactions. Proc. IEEE Int’l. Conf. Robotics and Automation; Kobe, Japan. 2009. pp. 2687–2692. [Google Scholar]
- Nienhuys H-W, van der Stappen FA. A computational technique for interactive needle insertions in 3d nonlinear material. Proc. IEEE Int’l. Conf. Robotics and Automation; New Orleans, USA. 2004. pp. 2061–2067. [Google Scholar]
- Okamura AM, Simone C, O’Leary MD. Force modeling for needle insertion into soft tissue. IEEE Trans Biomedical Engineering. 2004;51(10):1707–1716. doi: 10.1109/TBME.2004.831542. [DOI] [PubMed] [Google Scholar]
- Okazawa S, Ebrahimi R, Chuang J, Salcudean SE, Rohling R. Hand-held steer-able needle device. IEEE/ASME Trans Mechatronics. 2005;10(3):285–296. [Google Scholar]
- Park W, Reed KB, Okamura AM, Chirikjian GS. Estimation of model parameters for flexible needles. Proc. IEEE Int’l. Conf. Robotics and Automation; Anchorage, USA. 2010. Accepted. [DOI] [PMC free article] [PubMed] [Google Scholar]
- Podder T, Clark D, Messing E, Fuller D, Sherman J, Rubens D, Strang J, Ng W, Yu Y. Effects of coating on friction force during needle insertion in soft materials. Canadian Organization Medical Physics Conf; Hamilton, Canada. 2005. pp. 180–181. [Google Scholar]
- Reed KB, Kallem V, Alterovitz R, Goldberg K, Okamura AM, Cowan NJ. Integrated planning and image-guided control for planar needle steering. IEEE RAS/EMBS Int’l. Conf. on Biomedical Robotics and Biomechatronics; Scottsdale, USA. 2008. pp. 819–824. [DOI] [PMC free article] [PubMed] [Google Scholar]
- Shergold OA, Fleck NA. Mechanisms of deep penetration of soft solids, with application to the injection and wounding of skin. Proc of the Royal Society of London A. 2004;460(2050):3037–3058. [Google Scholar]
- Shergold OA, Fleck NA. Experimental investigation into the deep penetration of soft solids by sharp and blunt punches with application to the piercing of skin. J Biomechanical Engineering. 2005;127(5):838–848. doi: 10.1115/1.1992528. [DOI] [PubMed] [Google Scholar]
- Timoshenko SP, Gere J. Theory of elastic stability. 2. McGraw-Hill Companies; Columbus, USA: 1961. [Google Scholar]
- Webster RJ, III, Kim JS, Cowan NJ, Chirikjian GS, Okamura AM. Nonholo-nomic modeling of needle steering. Int’l J Robotics Research. 2006;25(5–6):509–525. [Google Scholar]
- Webster RJ, III, Memisevic J, Okamura AM. Design considerations for robotic needle steering. Proc. IEEE Int’l. Conf. Robotics and Automation; Barcelona, Spain. 2005. pp. 3588–3594. [Google Scholar]
- Yan KG, Podder T, Yu Y, Liu TI, Cheng CWS, Ng WS. Flexible needle-tissue interaction modeling with depth-varying mean parameter: preliminary study. IEEE Trans Biomedical Engineering. 2009;56(2):255–262. doi: 10.1109/TBME.2008.2005959. [DOI] [PubMed] [Google Scholar]


