

Abstract
We examined the effect of light adaptation on the gap junctional coupling of α-ganglion cells (α-GCs) in rabbit and mouse retinas. We assayed changes in coupling by measuring parameters of tracer coupling following injection of α-GCs with Neurobiotin and the concerted spike activity of α-GC neighbours under dark- and light-adapted conditions. We found that light adaptation using mesopic or photopic background lights resulted in a dramatic increase in the labelling intensity, number, and spatial extent of ganglion and amacrine cells coupled to OFF α-GCs when compared to levels seen under dark adaptation. While this augmentation of coupling by light did not produce an increase in the concerted spontaneous activity of OFF α-GC neighbours, it did significantly increase correlated light-evoked spiking. This was seen as an increase in the number of correlated spikes for α-GC neighbours and an extension of correlations to second-tier neighbours that was not seen under dark-adapted conditions. Pharmacological studies in the rabbit retina indicated that dopamine mediates the observed changes in coupling by differentially activating D1 and D2 receptors under different adaptation states. In this scheme, activation of dopamine D1 receptors following light exposure triggers cAMP-mediated intracellular pathways resulting in an increase in gap junctional conductance. Overall, our results indicate that as we move from night to day there is an enhanced electrical coupling between α-GCs, thereby increasing the concerted activity believed to strengthen the capacity and efficiency of information flow across the optic nerve.
Introduction
There is strong converging evidence that electrical synaptic transmission via gap junctions forms a prevalent mode of communication in the CNS (Söhl et al. 2005; Meier & Dermietzel, 2006). An elegant example is the vertebrate retina, in which each of the five neuronal types is coupled by gap junctions that express a number of different subunit connexin proteins. The broad distribution of these junctions within both retinal plexiform layers suggests that electrical transmission plays key and diverse roles in the transmission and processing of visual information (Bloomfield & Völgyi, 2009).
Similar to ion channels, the conductance of gap junctions is regulated by a number of physiological factors and agents. In retina, the neuromodulators dopamine and nitric oxide (NO) activate a number of intracellular pathways involving cAMP- and cGMP-dependent protein kinases (Lasater, 1987; Koistinaho et al. 1993; Mills & Massey, 1995; Witkovsky, 2004; Patel et al. 2006). This modifies the phosphorylation of connexins, thereby altering the conductance of gap junctions to ionic currents. Importantly, both the production and release of dopamine and NO in the retina are light dependent. As a consequence, changes in ambient light regulate the conductance of certain gap junctions, including those coupling horizontal cells, AII amacrine cells, and rod to cone photoreceptors (Mangel & Dowling, 1985; DeVries & Schwartz, 1989; Bloomfield et al. 1997; Xin & Bloomfield, 1999b; Bloomfield & Völgyi, 2004; Ribelayga et al. 2008). In each case, light adaptation results in a decreased coupling between neurons. These results suggest a rerouting of visual signals through electrical pathways as we move from night to day.
The variety of electrical synapses is perhaps richest in the inner retina where the output ganglion cells are often coupled to an array of neighbouring ganglion cells and/or amacrine cells (Bloomfield & Völgyi, 2009). These networks are thought to produce different patterns of concerted spike activity in neighbouring ganglion cells (Mastronarde, 1983a,b,c; Meister et al. 1995; Brivanlou et al. 1998; Hu & Bloomfield, 2003). Studies suggest that concerted activity serves to compress visual information for more efficient transmission across the limited capacity of the optic nerve (Meister et al. 1995; Meister & Berry, 1999). In addition, concerted activity may provide additional information that is multiplexed with asynchronous signals (Pillow et al. 2008; Shlens et al. 2008).
How changes in ambient light affect ganglion cell coupling and thereby alter the concerted activity sent to the brain is currently unknown. Therefore, in this study we examined the effects of changing ambient illumination on the gap junctional coupling of the α subtype of ganglion cells (α-GCs), which are coupled to neighbouring α-GCs as well as multiple subtypes of amacrine cells. Opposite to the light-induced effects on other retinal neurons, we find that light adaptation results in a dramatic increase in the coupling of α-GCs to both neighbouring ganglion cells and amacrine cells. This is observed as both an expansion of the tracer-coupled network of cells and a proportional increase in the correlated spike activity between neighbouring α-GCs. Our results thus suggest that concerted ganglion cell activity is augmented under daylight conditions, thereby increasing the capacity and efficiency of the flow of visual information to the brain.
Methods
Preparation
The experimental procedures utilized in this study have been described previously (Hu et al. 2000; Hu & Bloomfield, 2003; Völgyi et al. 2004). Adult New Zealand White rabbits (n = 93) were anaesthetized with an intraperitoneal injection of 40% ethyl carbamate (2.0 g (kg body weight)−1). In separate experiments, adult (P30−90) C57BL6 wild-type mice (n = 37) were anaesthetized with an intraperitoneal injection of Nembutal (0.08 g (g body weight)−1). Following a local injection of 2% lidocaine hydrochloride to the eyelids and surrounding tissue, eyes were removed under dim red illumination and hemisected posterior to the ora serrata. Radial cuts were made peripherally to flatten the resultant retina-eyecup in a Maltese cross configuration, which was then placed in a superfusion chamber within a light-tight Faraday cage. The retina-eyecup was superfused at a flow rate of 30 ml min−1 with a mammalian Ringer solution (Bloomfield & Miller, 1982). The superfusate was kept at a constant temperature of 34°C with oxygenation and pH 7.4 was maintained by bubbling with a gaseous mixture of 95% O2–5% CO2. For pharmacological studies, drugs (Sigma-Aldrich, St. Louis, MO, USA) were dissolved in separate bottles of Ringer solution and applied to the retina. For dark adaptation, retinas were maintained in complete darkness for 1 h prior to initiation of experiments. Following enucleations, rabbits were killed with an intracardial injection of ethyl carbamate (5 ml of a 40% solution) and mice were killed by cervical dislocation. All surgical procedures were approved by the Institutional Animal Care and Use Committee at NYU School of Medicine. These procedures comply with The Journal of Physiology policy and UK regulations on animal experimentation. Animals were maintained in a 12:12 h day–night cycle and all experiments were performed during daylight hours.
The superfusion chamber was mounted on the stage of an upright light microscope (Olympus BX51, Center Valley, PA, USA). A 900 nm cut-off filter allowed transmission of IR light from below the stage and then up through a condenser and the glass coverslip mounted in the superfusion chamber base. An IR-sensitive CCD camera (Dage-MTI, Michigan City, IN, USA) captured the retinal image that was displayed on a video monitor outside the Faraday cage. Two triple-axis motorized micromanipulators (Sutter Instruments, Novato, CA, USA) were operated by controllers from outside the cage. Each micromanipulator supported the headstage of an isolated AC differential amplifier (World Precision Instruments, Sarasota, FL, USA) for extracellular recordings or that of high-impedance amplifier for intracellular recordings (Molecular Devices, Sunnyvale, CA, USA). Thus, simultaneous extracellular or intracellular recordings could be made from neighbouring cells. Data were digitized online with an A/D board using Axoscope software (Molecular Devices).
Visualization of α-GCs
To visualize cells in the rabbit retina, the superfusion was temporarily halted and three to five drops of 0.1% Azure B (dissolved in Ringer solution) were placed on the retinal surface. After 60–90 s the superfusion was resumed and the Azure B suctioned off the retina and discarded. Optimal staining density occurred within 10–15 min and cells remained visible for the entire duration of the experiment (up to 10 h). Visualization of ganglion cells in the mouse retina was achieved by Nomarski differential interference optics. In both rabbit and mouse, the largest somata in the ganglion cell layer were targeted as these corresponded to α-GCs (Hu & Bloomfield, 2003; Völgyi et al. 2005).
Intracellular and extracellular recordings
Simultaneous extracellular recordings were obtained from pairs of neurons using carbon fibre or tungsten microelectrodes. Following extracellular recordings, one neuron in each pair was impaled with an intracellular microelectrode and labelled with Neurobiotin for subsequent morphological identification and to visualize cells to which it was coupled via gap junctions.
Intracellular recordings were obtained from neurons using microelectrodes fashioned from standard borosilicate glass tubing (Sutter Instruments). Electrodes were filled at their tips with 4%N-(2-aminoethyl) biotinamide hydrochloride (Neurobiotin; Vector Laboratories, Burlingame, CA, USA) in 0.1 Tris buffer (pH 7.6), and then back-filled with 4 m potassium chloride. Final DC resistances of these electrodes ranged from 350–450 MΩ. Following physiological characterization of a cell, Neurobiotin was injected into the cell with a combination of sinusoidal (3 Hz, 0.8 nA p-p) and DC current (0.4 nA) applied simultaneously; this method allowed for passage of tracer through the microelectrode with minimal tip polarization.
Light stimulation
A green LED (λ = 525 nm) focused onto the retinal surface provided a scotopic (4.7 Rh* rod−1 s−1), full-field light stimulus to the dark-adapted retina. The adapting lights consisted of full-field white light provided by a 100 W tungsten-halogen lamp. The intensity of the adapting light was either log −3.5 or log 0.0 intensity, corresponding to mid mesopic or photopic levels, respectively, where log 0.0 = 0.27 mW cm−2.
Analysis of spike activity
The spike trains were sorted and time-stamped offline (Off-Line Sorter, Plexon, Dallas, TX, USA). The cross-correlation function between two spike trains was computed by calculating all time differences between a spike from one cell and a spike from the other cell (Neuroexplorer, Plexon). Significance was determined by 99% confidence limits.
For light-evoked activity, a shift predictor correction procedure (Perkel et al. 1967) separated the features of the cross-correlation functions that were related to neuronal interactions from those resulting from the coactivation of the cells by the light stimulus. The shift predictor was generated in the same manner as a normal cross-correlation function except that one of the spike trains was shifted over one or more stimulus intervals (Neuroexplorer, Plexon). Here, the shift predictor was created as the arithmetical mean of all possible interval shifts. The shift predictor was then subtracted from the original cross-correlation function to generate the shift-predicted function, which included only those correlations independent of the light stimulus.
To calculate the percentage of correlated spikes between pairs of neighbouring α-GCs, the ratio of spikes correlated above the 99% confidence level was compared to the total number of spikes within a ±2.5 ms epoch in the centre of the cross-correlogram. For light-evoked spokes, the measurements were made after a shift predictor analysis was applied to remove correlations secondary to the presentation of the light stimulus.
To measure the centre-receptive field of a cell, a 50 μm wide/1.0 mm long rectangular slit of light was moved along its minor axis (parallel to the visual streak) in discrete steps in both directions from the central position. The position of the slit at which it evoked the largest response was considered to be centred over the cell. Peak spike frequency responses were plotted against stimulus position and the extent of a neuron's centre-receptive field was taken as the diameter of the Gaussian function fit to the data (Origin, OriginLab Corp., Northampton, MA, USA). The Gaussian diameter was defined as 0.849 times the width (w) of the Gaussian at half height (w≈ 2σ).
Histology and morphometry
Following a physiological experiment, the retina was fixed immediately in a cold (4°C) fixative solution of 4% paraformaldehyde–0.1% glutaraldehyde in 0.1 m phosphate buffer (pH 7.3) for 12 min. The retina was then detached, trimmed, and fixed onto a gelatinized glass coverslip and left in fixative overnight at 4°C. Retinas were washed for 4–5 h in 10 mm sodium phosphate buffered saline (PBS, 0.9% saline, pH 7.6) and then reacted with the Elite ABC kit (Vector Laboratories) and 1% Triton X-100 in PBS overnight at 4°C. Retinas were processed for peroxidase histochemistry using 3,3′-diaminobenzidine (DAB) with cobalt intensification, then dehydrated, cleared and flatmounted in Permount (Fisher Scientific, Houston, TX, USA).
All cells were photographed with a Spot II (Diagnostic Instruments, Sterling Heights, MI, USA) cooled CCD camera and images were manipulated for brightness and contrast with Adobe Photoshop software. To determine the labelling intensity of coupled ganglion and amacrine cell somata, pixels covering each soma were captured using Photoshop software and the average greyscale intensity (256 levels) was calculated for all pixels. This average intensity value for each coupled soma was then normalized against the intensity of label of the injected α-GC in each coupled mosaic to compensate for differences in overall labelling in different injections.
Statistics
All statistical comparisons were made using Student's two-sided t test. A value of P < 0.01 was considered significant.
Results
Identification of α-GCs in the rabbit retina
Azure B was used to label a subset of the somata within the ganglion cell layer (GCL) of the living rabbit retina (Hu et al. 2000; Hu & Bloomfield, 2003). These included mosaics of cells easily identified by their regular spacing and particularly large somata when viewed under IR illumination. In this study, we targeted the largest somata in the GCL that, when stained with Neurobiotin, displayed the morphological features described previously for α-GCs in a number of mammalian species, including the rabbit (Boycott & Wässle, 1974; Wässle et al. 1975, 1981; Peichl et al. 1987; Peichl, 1991; Hu & Bloomfield, 2003). These features included: (1) relatively large somata and dendritic fields; (2) four to six stout primary dendrites; (3) dendrites with up to sixth-order radiate branching at acute angles; (4) rare overlap of dendrites; (5) relatively long terminal dendrites; and (6) a narrowly stratified arbour in either sublamina a or b of the inner plexiform layer (IPL), which corresponded to the cells’ OFF or ON receptive fields, respectively (Famiglietti et al. 1977; Nelson et al. 1978; Bloomfield & Miller, 1986).
Coupling pattern under dark-adapted conditions
As reported previously, we found that the tracer coupling patterns for ON and OFF α-GCs differed dramatically (Hu & Bloomfield, 2003). Without exception, ON α-GCs (n = 59) showed no evidence of tracer coupling following injection of a single cell with Neurobiotin (Fig. 1A). In contrast, the coupling pattern of dark-adapted OFF α-GCs (n = 169) consisted of: (1) an extensive array of over 100 small somata (123.2 ± 19.3; mean ±s.d.) that lay within both the GCL and proximal inner nuclear layer (INL); and (2) a local ring of three to eight ganglion cells (5.1 ± 0.8) with large somata similar in size to that of the injected α-GC (Fig. 1B). Under dark-adapted conditions, we usually could not visualize the entire dendritic arbour of the coupled ganglion cells as only the primary dendrites were labelled (Fig. 2A). However, several pieces of data indicate that the coupled ganglion cells were indeed α-GCs. First, the somata of the coupled ganglion cells were always the largest of somata found locally in the GCL (Fig. 2A). Second, occasionally the dendrites of a coupled ganglion cell could be visualized and showed the typical extensive and radial branching of α-GCs (Fig. 2B). Third, both the injected and tracer-coupled ganglion cells formed a regularly spaced array indicative of cells within a single morphological class. Our conclusion that α-GCs in rabbit retina are coupled homologously to each other is consistent with tracer-coupling patterns established for α-GCs in a number of mammalian retinas (Vaney, 1991; Dacey & Brace, 1992; Penn et al. 1994; Xin & Bloomfield, 1997). Importantly, tracer coupling was limited to nearest neighbour OFF α-GCs under dark-adapted conditions; second-tier α-GCs were rarely visible with Neurobiotin labelling.
Figure 1. Coupling pattern and concerted firing of ON and OFF α-GCs in the dark-adapted rabbit retina.
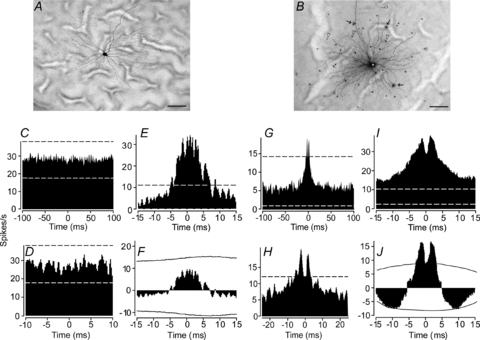
A, typical tracer coupling pattern of dark-adapted ON α-GC after injection with Neurobiotin. ON α-GC never showed evidence of coupling to neighbouring neurons. Scale bar = 50 μm. B, typical coupling pattern of an OFF α-GC after injection with Neurobiotin. The cell is tracer coupled to neighbouring α-GCs (arrows) as well as an array of multiple amacrine cell subtypes (arrowheads). Note that the dendritic arbour of the injected α-GC is clearly labelled while those of the coupled amacrine and ganglion cells are not. Asterisk indicates somata of injected α-GC. Scale bar = 50 μm. C, cross-correlogram of spontaneous spikes of two neighbouring ON α-GCs. Dashed lines indicate 99% confidence limit outside which correlations were above chance. There were no spike correlations above chance. D, same cross-correlogram as in C, but at a shorter time scale. E, cross-correlogram for light-evoked spikes of two neighbouring ON α-GCs. Function shows a unimodal profile with peak at time zero. F, cross-correlogram for light-evoked spikes of same cells as in E, but after shift predictor analysis to eliminate spike correlations due to the light stimulus. Continuous lines indicate the 99% confidence level. No correlations above chance were seen after the shift predictor was applied. G, cross-correlogram of spontaneous spikes of two neighbouring OFF α-GCs. H, same cross-correlogram as in G, but at a shorter time scale showing the dual peak profile with a trough at time zero. I, cross-correlogram of light-evoked spikes for two neighbouring OFF α-GCs. The profile consists of two peaks superimposed on a broader component, all of which were outside the 99% confidence limit. J, cross-correlogram for light-evoked spikes of same cells as in E, but after a shift predictor analysis was performed to eliminate spike correlations due to common synaptic inputs activated by the light stimulus. Only the dual peak profiles were outside the 99% confidence limit (continuous line), much as seen in the cross-correlogram for spontaneous spikes.
Figure 2. Detailed coupling pattern of dark-adapted OFF α-GCs.
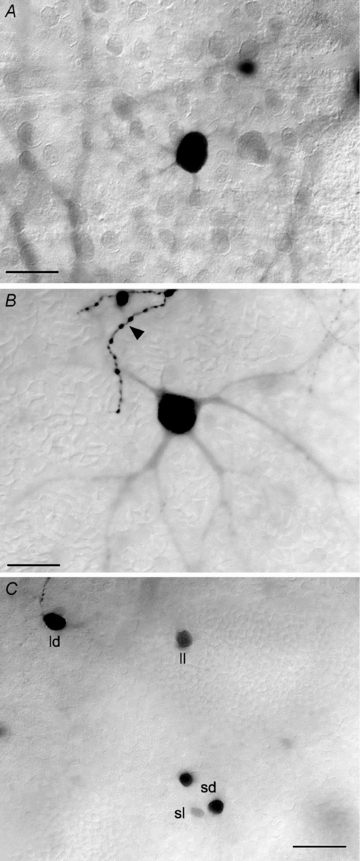
A, labelled soma of an OFF α-GC that is tracer coupled to a neighbouring OFF α-GC injected with Neurobiotin. Note that the dendritic arbour of the coupled cell is not labelled with only the primary dendrites partially visible. This was the typical labelling pattern for coupled OFF α-GCs in the dark-adapted rabbit retina. The soma injected α-GC is just out of view along the upper right margin of the panel. Scale bar = 25 μm. B, tracer coupled OFF α-GC that was particularly well labelled so that a sizeable portion of its dendritic arbour could be visualized. The arbour shows the radial branching pattern typical of α-GCs. The arrowhead indicates the well-labelled terminal dendritic branches of the OFF α-GC that was injected with Neurobiotin. Scale bar = 25 μm. C, the variability of the soma size and labelling intensity of the amacrine cells that are tracer coupled in OFF α-GCs. Based on these two parameters, we differentiated the coupled amacrine cells into four subtypes: large/dark (ld), large/light (ll), small/dark (sd), and small/light (sl). Scale bar = 25 μm.
Previous studies have shown that multiple subtypes of amacrine cells are coupled to α-GCs, including one with long-range dendritic or axonal processes extending beyond a millimeter (Vaney, 1991; Dacey & Brace, 1992; Penn et al. 1994; Xin & Bloomfield, 1997; Hu & Bloomfield, 2003; Mills et al. 2007). Unfortunately, the dendritic/axonal processes of the amacrine cells that were tracer-coupled to OFF α-GCs were also normally not visible in dark-adapted retinas. However, we were able to distinguish up to four different subtypes of coupled amacrine cells based on their soma size and the intensity of Neurobiotin labelling (Fig. 2C). We therefore classified these cells as: (1) large/dark; (2) large/light; (3) small/dark; and (4) small/light. These different amacrine cell somata were found to be uniformly distributed around an injected OFF α-GC and so the size and labelling intensity of the amacrine cells were not related to their distance from the α-GC soma. Thus, the size and darkness of the different coupled amacrine cells did not appear to be a technical artifact related to the movement of Neurobiotin over different distances. Further, we found that the nearest neighbour distances for the four subtypes of coupled amacrine cells were different: (1) 18.1 ± 1.3 μm for large/dark cells; (2) 11.6 ± 2.7 μm for small/dark cells; (3) 24.8 ± 3.1 μm for large/light cells; and (4) 34.2 ± 8.3 μm for small/light amacrine cells. The different mosaics provide further evidence that OFF α-GCs are coupled to distinct subtypes of neighbouring amacrine cells.
Concerted firing under dark-adapted conditions
To functionally assay the degree of electrical coupling between α-GC neighbours in the rabbit retina, we evaluated their correlated spike activity (Hu & Bloomfield, 2003). Simultaneous recordings were made from pairs of ON or OFF α-GCs either as nearest neighbours or as second- or third-tier neighbours. The data presented here in both dark- and light-adapted retinas represent 365 simultaneous paired recordings (72 from paired ON α-GCs and 293 from paired OFF α-GCs). Recordings were made mainly in and around the visual streak; cell eccentricities ranged from 0.5 to 4.0 mm ventral to the optic disk.
Spontaneous activity
As we reported previously (Hu & Bloomfield, 2003), the spontaneous spike activity of nearest neighbour ON α-GCs (n = 54) showed no correlated activity under dark-adapted conditions (Fig. 1C and D). This was true for second- and third-tier neighbours (n = 15) as well. In contrast, spontaneous activity of neighbouring OFF α-GCs (n = 53) showed a clear bimodal cross-correlation distribution consisting of a trough at 0 ms and peaks with latencies of ±2.0–2.5 ms (Fig. 1G and H). This type of cross-correlation was found for 88% of all nearest neighbour pairs of OFF α-GCs whose spontaneous spikes were recorded simultaneously. Without exception, every pair that showed correlated firing was darkly tracer coupled as well. Overall, we found that 15% of spontaneous spikes of nearest neighbours were correlated under dark-adapted conditions. In contrast, we found that second-tier OFF α-GC neighbours (n = 52) very rarely (1% of all cell pairs studied) showed correlated firing in their cross-correlation functions for spontaneous spiking above the 99% confidence level. For the rare second-tier cells that showed correlated spiking, the correlated activity accounted for only 1–2% of all spontaneous spike activity. Overall, these data revealed a strong correspondence in the tracer and ionic movements through particular sets of gap junctions.
Light-evoked activity
The cross-correlation analysis of light-evoked spike activity from neighbouring ON α-GCs (n = 10) in dark-adapted rabbit retinas typically showed a peak at 0 ms and a relatively broad width of ±10 ms (Fig. 1E). In contrast, the cross-correlations generated from paired recordings of neighbouring OFF α-GCs (n = 30) showed a trough at time zero and dual peaks, similar to that seen for spontaneous spike activity (Fig. 1I). However, the peaks appeared to be superimposed on the same relatively broad (±10 ms) profile seen for the light-evoked correlations of ON α-GC neighbours. As expected, the light-evoked activity of ON and OFF α-GCs recorded simultaneously were negatively correlated (data not shown).
It is plausible that the correlated light-evoked activity for both ON and OFF α-GC pairs arises independently, the result of each cell's activity being synchronized by common light stimulation. To test for this possibility, we performed a shift predictor analysis on the light-evoked spike trains of neighbouring α-GCs (Perkel et al. 1967). Following this analysis, the robust unimodal distribution for the ON α-GC pairs was eliminated, leaving no statistically significant correlations in spike activity (Fig. 1F). The shift-predictor analysis also eliminated the broad unimodal distribution seen in the light-evoked spike cross-correlograms of OFF α-GC pairs, suggesting that it reflected common light-evoked synaptic inputs (Fig. 1J). However, the bimodal peaks that survived the shift-predictor analysis (above the 99% confidence level) were similar to those seen for the correlated spontaneous spike activity. This result suggests that the bimodal distribution seen in the cross-correlation functions of both spontaneous and light-evoked spike activity of OFF α-GC cell pairs reflects direct interactions likely via gap junctions.
Comparing the shift-predicted data, we found that 92% of nearest neighbour OFF α-GCs showed correlated light-evoked spike activity under dark-adapted conditions. The correlated light-evoked spikes of these pairs accounted for 36% of all light-evoked activity. We found that 21% of second-tier OFF α-GC pairs showed correlated light-evoked spikes, but this activity accounted for only 1–2% of all light-evoked spikes. No correlated light-evoked activity was found for third-tier OFF α-GC neighbours (n = 14) in the dark-adapted rabbit retina.
Coupling pattern under light-adapted conditions
Prior to intracellular injections, retinas were light adapted with full-field white light illumination for 1 h. Adapting lights consisted of either mesopic (log −3.5) or photopic (log 0.0) illumination. Neither of the adapting lights had an effect on the tracer coupling pattern of ON α-GCs (n = 5), which continued to show no evidence of coupling following injection with Neurobiotin. In contrast, light adaptation of the retina produced a dramatic and robust increase the tracer coupling pattern of OFF α-GCs (n = 30) when compared to that seen in dark-adapted retinas. This included an overall increase in the labelling intensity, cell number and size of the tracer-coupled field of cells.
First and most evident, light adaptation produced a dramatic increase in the labelling intensity of Neurobiotin in coupled amacrine and ganglion cells (Fig. 3A and B). In contrast to dark-adapted retinas, in which only the soma and primary dendritic segments of coupled α-GCs were usually visible, up to fifth-order dendritic branches could be seen in light-adapted retinas (Fig. 3C and D). Equally dramatic was the increased visibility of amacrine cell processes. Whereas the dendritic/axonal processes of coupled amacrine cells were rarely labelled in dark-adapted retinas, extensive arrays of amacrine cell dendritic processes were visible in light-adapted retinas (Fig. 3), with some axons that could be followed for well over a millimetre. Overall, there were statistically significant increases (P < 0.01) in the labelling intensity of light-adapted coupled amacrine and ganglion cell somata when compared to that seen under dark-adapted conditions (Fig. 4A).
Figure 3. Coupling pattern of OFF α-GCs in the light-adapted rabbit retina.
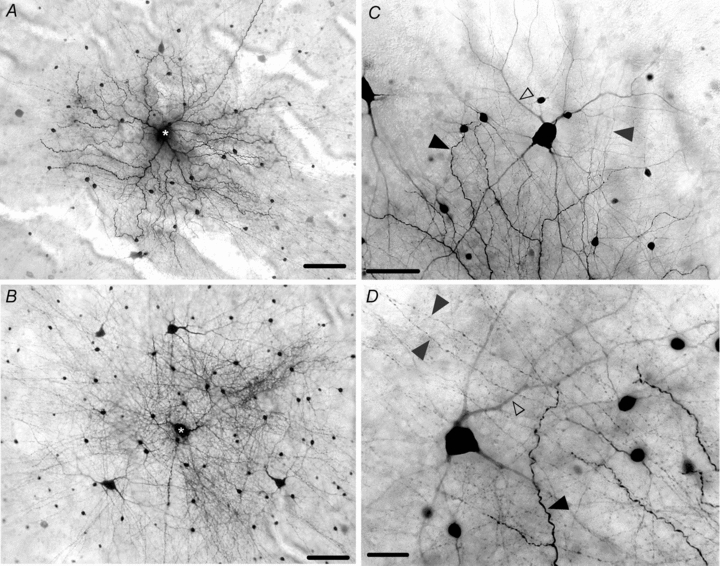
A, tracer coupling pattern seen after Neurobiotin was injected into an OFF α-GC (asterisk) in a retina light-adapted with a background light (log −3.5) for 1 h. The dendritic and axonal processes of coupled cells are extensively labelled, in clear contrast to the tracer coupling pattern seen in dark-adapted retinas. B, tracer coupling pattern seen after Neurobiotin was injected in an OFF α-GC in a retina light-adapted with a bright (log 0.0) background light. Scale bar = 100 μm. C, detailed labelling of coupled amacrine and ganglion cells in a retina light adapted with a background stimulus (log −3.5). The dendritic processes (open arrowhead) of coupled α-GCs and the axonal processes (grey arrowhead) are darkly labelled. The terminal dendrites of the injected OFF α-GC are indicated by the dark arrowhead. Scale bar = 50 μm. D, detailed coupling pattern of coupled amacrine and ganglion cells in a rabbit retina light adapted with a bright (log 0.0) background light. The dendrites (open arrowhead) of the coupled α-GC are well labelled as are the extensive axonal processes (grey arrowheads) of the coupled amacrine cells. The terminal dendritic ending of the injected OFF α-GC is indicated by the dark arrowhead. Scale bar = 25 μm.
Figure 4. Quantitative comparison of the tracer coupling pattern of OFF α-GCs seen in dark- and light-adapted retinas.
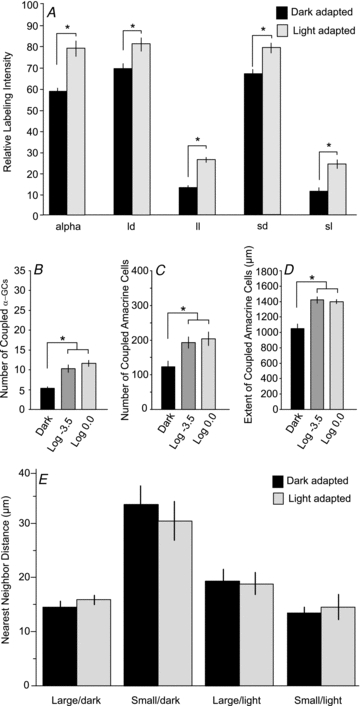
A, bar graph comparing the relative labelling intensity of the coupled α-GCs and four subtypes of amacrine cells in dark- and light-adapted retinas. Columns show means and standard error bars. The data for light-adapted retinas included retinas exposed to mesopic (log −3.5) and photopic (log 0.0) background lights. The labelling intensity for each was statistically different (asterisks, P < 0.01) in dark- and light-adapted retinas. B, bar graph showing the difference in the number of coupled α-GCs in dark- and light-adapted retinas. There was a statistically significant difference (asterisk, P < 0.01) in the number of coupled α-GCs in dark- and light-adapted (log −3.5 and log 0.0) retinas. There was no statistical difference in the number of α-GCs in retinas adapted with log −3.5 or log 0.0 background lights. C, bar graph showing the difference in the number of coupled amacrine cells in dark- and light-adapted retinas. There was a statistically significant difference (asterisk, P < 0.01) in the number of coupled amacrine cells in dark- and light-adapted (log −3.5 and log 0.0) retinas. There was no statistical difference in the number of amacrine cells in retinas adapted with log −3.5 or log 0.0 background lights. D, bar graph showing the maximum distance of coupled amacrine cell somata from the injected OFF α-GC in dark- and light-adapted retinas. There was a statistically significant difference (asterisk, P < 0.01) in the extent measured in dark- and light-adapted (log −3.5 and log 0.0) retinas. There was no statistical difference in the extent measured in retinas adapted with log −3.5 or log 0.0. E, bar graph comparing the nearest neighbour distances for the four subtypes of amacrine cells coupled to OFF α-GCs in dark- and light-adapted (log −3.5 and log 0.0) retinas. There were no statistically significant differences (P > 0.1) seen under the different adaptation states.
Light adaptation also produced an extensive increase in the number of neighbouring α-GCs and amacrine cells that were labelled with Neurobiotin (Fig. 4A and B). This included a near doubling of the number of coupled α-GC neighbours from approximately 5 to 10. While usually only the nearest neighbour α-GCs were tracer coupled in the dark-adapted retina, both second- and third-tier neighbours could be visualized under light-adapted conditions. There was also a significant increase in the number of labelled amacrine cells from 123 in dark-adapted retinas to about 200 cells in light-adapted retinas (Fig. 4C). While the tracer coupled amacrine cell somata were found to lie up to 1 mm from a Neurobiotin-injected α-GC in the dark-adapted state, coupled amacrine cell somata up to 1.4 mm from the injected α-GC could be visualized under light-adapted conditions (Fig. 4D). Although the differences in coupling between dark- and light-adapted retinas were dramatic, we found no statistical difference between the number or extent of coupled ganglion/amacrine cells in retinas adapted with log −3.5 or log 0.0 intensity background lights.
Our results indicate that light adaptation increased the number and labelling intensity of each of the four subtypes of amacrine cells. However, since labelling intensity was one of the variables used to differentiate the subtypes, it was possible that identification of amacrine cell subtypes in light-adapted retinas was equivocal. We therefore compared the nearest neighbour frequency of the four subtypes of amacrine cells under dark- and light-adapted conditions. We found that the mosaic of each amacrine cell subtype was the same under the different adapting conditions (Fig. 4E). Thus, although the number and labelling intensity of coupled amacrine cells were increased by light adaptation, the overall density of cells remained the same as observed under dark-adapted conditions. These results argue against the recruitment of additional subtypes of amacrine cells under light-adapted conditions through the opening of new gap junctional connections.
Concerted firing under light-adapted conditions
Clearly, light adaptation increased the movement of tracer across the gap junctions formed by α-GCs. This suggests an increase in the permeability of homologous and/or heterologous gap junctions to tracer molecules. To test whether such an increase in permeability produced a corresponding increase in electrical coupling, we compared the concerted activity of α-GCs in dark- and light-adapted retinas.
Spontaneous activity
In initial experiments, as described above, we allowed retinas to remain in the dark for 1 h and then examined the cross-correlation functions of spontaneously evoked spikes from neighbouring α-GCs. Retinas were then light-adapted for 1 h with either a mesopic (log −3.5) or photopic (log 0.0) full-field white light and cross-correlations for the spontaneous spikes were reanalysed. Figure 5A and B shows the results of an experiment in which the concerted spontaneous activity of first-, second-, and third-tier OFF α-GC neighbours was compared under dark- and light-adapted conditions. Similar to the results of experiments described above, we found that only nearest neighbour α-GCs showed concerted firing as reflected by the bimodal profile of the cross-correlogram. Cells that formed second- or third-tier neighbours almost never (1% and 0%, respectively) showed statistically significant correlated spontaneous firing (n = 28). Interestingly, we found that light adaptation, with either log −3.5 or log 0.0 intensity background illumination, did not alter the correlated spontaneous activity of neighbouring OFF α-GCs (n = 32). That is, we found that 89% of nearest-neighbour pairs showed correlated spontaneous activity in light-adapted retinas, similar to the number found under dark-adapted conditions. Further, these correlated spontaneous spikes accounted for 13% of all spontaneous activity, once again similar to the number found in dark-adapted retinas. Light adaptation also had no effect on the number of second-tier neighbours showing correlated spontaneous activity, which remained at the same 1% level seen under dark-adapted conditions. Thus, there was no significant difference in the concerted spontaneous activity of OFF α-GCs under dark- or light-adapted conditions, despite the dramatic difference in tracer coupling.
Figure 5. Concerted light-evoked, but not spontaneous, activity is enhanced by light adaptation.
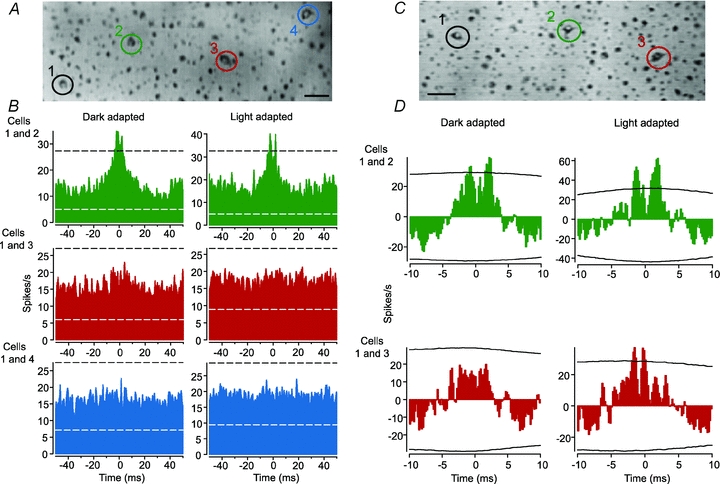
A, video image of the living rabbit retina showing four OFF α-GC somata that were labelled with Azure B. The spontaneous spike activity of pairs of these cells was recorded with extracellular electrodes. Scale bar = 25 μm. B, cross-correlograms of the spontaneous activity of nearest (cells 1 and 2), second-tier (cells 1 and 3), and third-tier (cells 1 and 4) neighbours under dark- and light-adapted (log 0.0 background light) conditions. Conventions are the same as in Figure 1. Nearest neighbour OFF α-GCs showed correlated spontaneous activity in dark-adapted retinas consisting of two peaks with a trough at time zero (top left panel). Light adaptation did not change the cross-correlogram profile (top right panel). In contrast, the second-tier and third-tier neighbours showed no spike correlations above chance in both dark- and light-adapted retinas (middle and bottom panels). C, video image of the living rabbit retina showing three OFF α-GCs that were labelled with Azure B. The light-evoked activity of nearest and second-tier neighbours was recorded under dark- and light-adapted (log 0.0) conditions. D, cross-correlograms of light-evoked spikes of nearest (cells 1 and 2) and second-tier (cells 1 and 3) neighbours after a shift predictor analysis was performed to remove correlations due to the light stimulus. Under dark-adapted conditions, the shift predicted cross-correlogram for the nearest neighbours showed two peaks with a trough at zero (top left panel). After light adaptation, the correlated activity was enhanced as indicated by the extended peaks above the 99% confidence limit (top right panel). Under dark-adapted conditions, the second-tier neighbours showed no concerted firing above chance (bottom left panel). However, after light adaptation, the second-tier neighbours showed significant concerted light-evoked activity (bottom right panel).
Light-evoked spike activity
In contrast to spontaneous activity, we found that light adaptation produced a significant increase in the correlations of light-evoked spikes of neighbouring OFF α-GCs. In these experiments, we compared correlations following a shift predictor analysis in which correlations due to light-evoked inputs were eliminated. We found that virtually all nearest-neighbour α-GCs (99%; n = 56) in light-adapted retinas (log −3.5 and log 0.0) showed correlated light-evoked activity. These correlated light-evoked spikes accounted for 48% of all light-evoked activity, a significant (P < 0.01) increase from the level seen in dark-adapted retinas. Light adaptation thus increased both the number of nearest-neighbour pairs showing correlated light-evoked activity and the number of correlated spikes for each pair.
Light adaptation also increased the number of second-tier OFF α-GC neighbours that showed light-evoked spike correlation from dark-adapted levels. Figure 5C and D shows results of an example experiment in which the concerted light-evoked activity of first- and second-tier α-GC neighbours was examined under dark- and light-adapted conditions. The nearest neighbours showed correlated activity under dark-adapted conditions, whereas second-tier neighbours did not. However, under an adapting light (log 0.0), we found that the second-tier neighbours now showed significant correlations between light-evoked spikes. Overall, we found that light adaptation produced a doubling of the number of second-tier α-GC neighbours that showed correlated light-evoked spikes (43%) compared to that seen in dark-adapted retinas (21%). Further, the percentage of light-evoked spikes that were correlated in light-adapted retinas was 32%, a clear increase from the 1–2% found for second-tier neighbours in the dark-adapted rabbit retina.
Receptive fields
Taken together, our results suggest that light increases the conductance of OFF α-GC gap junctions resulting in the increased pattern of tracer coupling and concerted light-evoked spike activity. We examined whether the presumed light-induced increase in gap junctional conductance and the resulting lateral spread of current also resulted in a significant increase in the centre-receptive field size of individual OFF α-GCs. We computed the Gaussian diameter for α-GCs (n = 5) initially under dark-adapted conditions and then following a 1 h exposure to a bright (log 0.0) background light. The Gaussian curves computed for one α-GC is presented in Fig. 6A and the diameters measured for each of five cells under dark- and light-adapted condition are shown in Fig. 6B. Overall, we found a small, but statistically insignificant (P > 0.1) increase in the centre receptive field size of OFF α-GCs under light-adapted conditions.
Figure 6. Centre-receptive fields of OFF α-GCs do not change size following light adaptation.
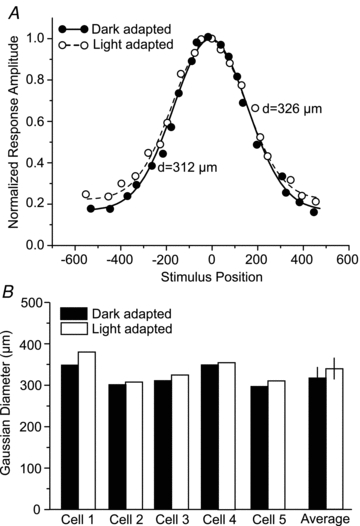
A, scatterplot of the normalized spike frequency of an OFF α-GC to a rectangular slit of light moved in discrete steps from a position (0) centred over the cell. Measurements were made under dark- and light-adapted (log 0.0) conditions. Data were fitted by a Gaussian function and the diameters were computed. There was no significant difference in the Gaussian diameters for this cell computed under dark- and light-adapted conditions. B, bar graph comparing the Gaussian diameters of five OFF α-GCs computed under dark- and light-adapted condition. The mean and standard errors of the mean for the five cells are indicated by the rightmost columns.
Light-induced changes in α-GC coupling in the mouse retina
We investigated whether the light-induced increases in tracer coupling and spike correlations we found in the rabbit retina also occurred in the mouse retina. The α-GCs in the mouse retina were targeted and identified using criteria similar to those discussed above for use in the rabbit. The OFF α-GCs in the dark-adapted mouse retina are tracer coupled to neighbouring OFF α-GCs and multiple subtypes of amacrine cells (Völgyi et al. 2009), similar to the pattern seen in the rabbit (Fig. 7A). Exposure of mouse retinas to a bright (log 0.0) background light produced dramatic and statistically significant increases (P < 0.01) in the labelling intensity, number, and extent of coupled ganglion and amacrine cells (Fig. 7C–E), matching the effects we found in the rabbit.
Figure 7. Light adaptation enhances coupling of OFF α-GCs in the mouse retina.
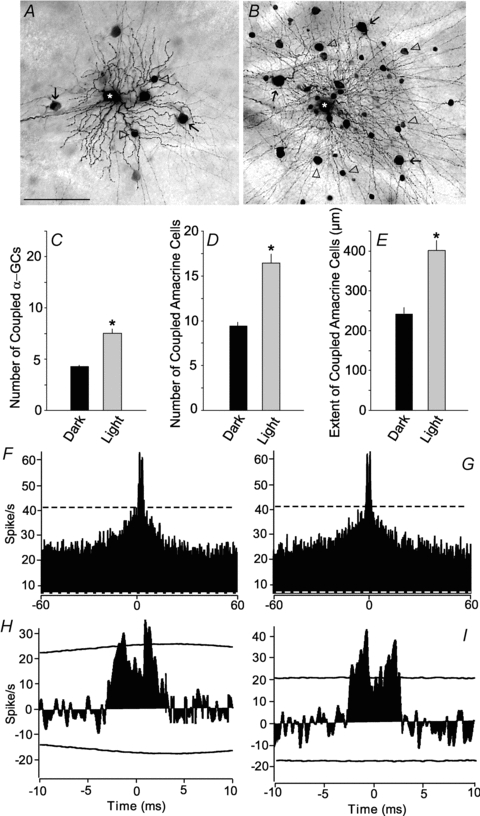
A, typical tracer coupling pattern in the mouse retina following injection of an OFF α-GC with Neurobiotin (asterisk). This consists of an array of coupled α-GCs (arrows) and at least two subtypes of amacrine cells (arrowheads). Note that the processes of the coupling amacrine cells cannot be visualized. Scale bar = 100 μm. B, tracer coupling pattern for OFF α-GCs seen in a mouse retina light adapted by presentation of a bright (log 0.0) background light for 1 h. Darkly labelled somata of coupled α-GCs (arrows) and amacrine cells (arrowheads) can be seen. Moreover, the dendritic and axonal processes of the coupled ganglion and amacrine cells are well labelled and easily visualized. Scale is the same as in A. C, bar graph showing the difference in the number of coupled α-GCs in dark- and light-adapted retinas. There was a statistically significant difference (asterisk, P < 0.01) in the number of coupled α-GCs in dark- and light-adapted (log 0.0) retinas. D, bar graph showing the difference in the number of coupled amacrine cells in dark- and light-adapted retinas. There was a statistically significant difference (asterisk, P < 0.01) in the number of coupled amacrine cells in dark- and light-adapted (log 0.0) retinas. E, bar graph showing the maximum distance of coupled amacrine cell somata from the injected OFF α-GC in dark- and light-adapted retinas. There was a statistically significant difference (asterisk, P < 0.01) in the distance measured in dark- and light-adapted (log 0.0) retinas. F, cross-correlogram of spontaneous spikes of two neighbouring OFF α-GCs in the dark-adapted mouse retina. Dashed lines indicate 99% confidence limit outside which correlations were above chance. G, cross-correlogram for spontaneous activity of same cells as in F, but after light adaptation of the retina with a bright (log 0.0) background light for 1 h. The cross-correlogram is unchanged following light adaptation. H, cross-correlogram for the light-evoked spikes of a pair of neighbouring OFF α-GCs in the dark-adapted mouse retina following a shift predictor analysis to remove correlations due to the light stimulus. There are two peaks in the cross-correlation profile that extend outside the 99% confidence limit. I, cross-correlogram for light-evoked spikes for same cells as in H, but after the retina was light adapted by presentation of a bright (log 0.0) background light. There is an enhancement of the correlated light-evoked spikes as indicated by the extent to which the peak components exceed the 99% confidence limit.
The cross-correlation profiles of the spontaneous spikes of neighbouring α-GCs in dark-adapted mouse retinas (n = 12) showed the same bimodal distribution with latencies of ±2.0–2.5 ms seen for α-GCs in rabbit (Fig. 7F). This profile remained the same under light-adapted conditions (Fig. 7G). Overall, we found that the percentage of correlated spontaneous spikes for α-GCs was the same in dark-adapted and light-adapted mouse retinas (18.4 ± 4.1%vs. 17.6 ± 3.7%; n = 11). In contrast, light produced an increase in the percentage of correlated light-evoked spikes compared to that seen in dark-adapted retinas (12.6 ± 4.0%vs. 8.1 ± 3.1%; n = 6). This was seen as an increase in the amplitude of the bimodal profile of the cross-correlogram of light-evoked spikes when retinas were exposed to a bright background light (Fig. 7H and I). Overall, we thus found that light produced an increase in the tracer-coupling and correlated activity of light-evoked, but not spontaneous, spikes of murine OFF α-GCs, strikingly similar to the finding in the rabbit retina.
Effects of pharmacological agents on α-GC coupling
A number of neuromodulators, including dopamine and nitric oxide (NO) acting through the intracellular messengers cAMP and cGMP, have been shown to modulate the coupling of some retinal neurons (Bloomfield & Völgyi, 2009). We found that application of the NO donor S-nitroso-N-acetylpenicillamine (SNAP; 500 μm) (Fig. 8A) as well as 8-bromo-cGMP (500 μm) had no effect on the tracer coupling pattern of dark-adapted α-GCs in the rabbit retina. Likewise, application of the dopamine D1 receptor agonist SKF-38393 (100 μm) (Fig. 8B), D1 receptor blocker SCH-23390 (10 μm), or D2 receptor agonist quinperole (20 μm) produced no significant change in the tracer coupling pattern of dark-adapted OFF α-GCs. It should also be noted that these drugs did not alter the tracer coupling pattern (lack of coupling) of rabbit ON α-GCs.
Figure 8. Dopamine plays a role in the light-induced increase in the coupling of OFF α-GCs.

A, tracer coupling pattern seen in the dark-adapted rabbit retina after injection of an OFF α-GC (asterisk) with Neurobiotin and application of the NO donor SNAP (500 μm). There was no significant change in the coupling pattern relative to that seen in dark-adapted retinas under control conditions. B, tracer coupling pattern seen in the dark-adapted rabbit retina after application of the dopamine D1 receptor agonist SKF-38393 (100 μm). There was no significant difference in the coupling pattern relative to that seen in dark-adapted retinas under control conditions. C, tracer coupling pattern seen in the dark-adapted rabbit retina after injection of an OFF α-GC (asterisk) with Neurobiotin and application of the dopamine D2 receptor blocker eticlopride (25 μm). There was significant increase in the intensity, number, and extent of coupled amacrine and ganglion cells. D, tracer coupling pattern seen in the dark-adapted rabbit retina after injection of an OFF α-GC (asterisk) with Neurobiotin and application of the dopamine D2 receptor antagonist spiperone (10 μm). There was significant increase in the intensity, number and extent of coupled amacrine and ganglion cells. E, bar graph comparing the number of coupled α-GCs under different adaptational conditions and following the application of dopaminergic agents. The asterisks indicate a statistically significant change from values measured under dark-adapted, control conditions. MDL, MDL-12330; Rp-8-CPT-cA, Rp-8-CPT-cAMPS. Number of cells for each condition: Dark = 10; Log −3.5 = 10; Log 0.0 = 10; Dark + D2 Blocker = 10; Log 0.0 + D2 Blocker = 10; Log 0.0 + MDL = 5; Log 0.0 + Rp-8-CPT-cA = 5. F, bar graph comparing the number of coupled amacrine cells under different adaptational conditions and following the application of dopaminergic agents. Number of cells is the same as in E. G, bar graph comparing the number of coupled α-GCs under different adaptation conditions and following the application of dopaminergic agents. Number of cells is the same as in E.
Surprisingly, we found that the dopamine D2 receptor antagonists eticlopride (25 μm) and spiperone (10 μm) produced a dramatic increase in both the spread and the intensity of Neurobiotin labelling of coupled α-GCs and amacrine cells in dark-adapted retinas (Fig. 8C and D). This increase in the coupling pattern was qualitatively similar to that found following light adaptation, although the number of coupled α-GCs (24 ± 8), number of coupled amacrine cells (348 ± 53), and the extent of the amacrine cell field (1594 ± 102 μm) seen under drug conditions were greater than those seen under adapting lights (Fig. 8E–G). Application of D2 agonists also increased the concerted activity of α-GC neighbours. This included a statistically significant increase (P < 0.01) in the fraction of correlated light-evoked spikes between nearest-neighbours (62%) and second-tier neighbours (51%) from values obtained under dark-adapted conditions.
To determine whether blockade of D2 receptors may play a role in the enhanced coupling produced by bright lights, we examined whether application of the D2 agonist quinperole (20 μm) to retinas exposed to a log 0.0 intensity adapting light could reverse the coupling increase. We found, however, that quinperole had no effect on the enhanced coupling seen under light-adapted conditions. In contrast, we found that application of the D1 receptor blocker SCH-23390 (10 μm) to light-adapted retinas significantly reduced the number of coupled α-GCs, number of coupled amacrine cells, and the extent of coupled amacrine cell somata (P < 0.01 for all parameters) to approximate dark-adapted levels (Fig. 8E–G). Application of SCH-23390 also reduced the number of nearest and second-tier α-GC neighbours showing correlated light-evoked spike activity and the fraction of their correlated spikes to levels that were statistically indistinguishable from values measured under dark-adapted conditions (P > 0.1 for all measures).
In addition, application of the adenylate cyclase inhibitor MDL-12330 (20 μm) and the PKA inhibitor Rp-8-CPT-cAMPS (25 μm) to light-adapted retinas both produced a significant reduction in the number of coupled α-GCs, number of coupled amacrine cells, and the extent of coupled amacrine cell somata (P < 0.01 for all parameters) to approximate dark-adapted levels (Fig. 8E–G). Thus, while these results indicate that manipulation of D2 receptors can alter the permeability of α-GC gap junctions under dark-adapted conditions, it appears that a D1 receptor-dependent cascade, subserved by adenylate cyclase and PKA activation, underlies the permeability changes induced by light (see Discussion).
Discussion
Light enhances gap junctional coupling
Our results show that modifying the adaptation state of the retina initiates dramatic changes in the coupling pattern of OFF α-GCs in both rabbit and mouse. These include light-induced increases in the labelling intensity, number and spatial extent of coupled amacrine and ganglion cells, consistent with an elevated permeability of gap junctions. Our findings thus extend previous studies showing that retinal gap junctions are modulated by light (Mangel & Dowling, 1985; Xin & Bloomfield, 1999a,b; Bloomfield & Völgyi, 2004; Ribelayga et al. 2008). However, whereas the gap junctional coupling between rod and cone photoreceptors, horizontals cells, and AII amacrine cells were all shown to be decreased by light adaptation, the present results indicate that light increases the conductance of OFF α-GC gap junctions. Taken together, these results indicate that changes in adaptation state have differential effects on the various retinal gap junctions, whereby some electrical circuits are closed and others activated. This suggests a gap junction by gap junction plasticity ensuring precise control of electrical circuitry in the retina by light.
Consistent with the increased pattern of tracer coupling, we found that light adaptation enhanced the concerted spike activity of α-GCs. However, there was a clear difference between spontaneous and light-evoked activity. We found that light adaptation did not increase the number of nearest neighbour α-GCs that showed concerted spontaneous spiking, nor did it change the percentage of correlated spikes from levels seen in dark-adapted retinas. Likewise, the negligible correlated spontaneous activity of second-tier neighbours was seen under both dark- and light-adapted conditions. In contrast, light adaptation brought about a significant increase in the number of neighbouring α-GCs that showed concerted light-evoked spike activity and in the percentage of their correlated spikes. Further, the number of second-tier neighbour pairs that showed concerted light-evoked spiking doubled following light adaptation with a significant increase in the percentage of correlated spikes displayed by each.
The clear differences in the correlations of spontaneous and light-evoked activity, under both dark- and light-adapted conditions, suggest that an excitatory drive, presumably via bipolar cells, generated by light stimulation plays a role in correlating signals in the inner retina. In this scheme, gap junctions serve as conduits to correlate activity of neighbouring cells, but ‘priming’ of these cells with common light-driven excitation forms a complementary mechanism to enhance correlations. These results are consistent with a recent report in primate showing that while correlated spiking of neighbouring parasol cells (the homologue of α-GCs) requires electrical connections via gap junctions, excitatory synaptic inputs, which would be activated by light stimulation, play an important role in bringing ganglion cells to threshold to initiate correlated activity (Trong & Rieke, 2008).
Why the light-driven increase in coupling increased light-driven, but not spontaneous, activity is uncertain. However, it has been suggested that while enhanced coupling of ganglion cells and amacrine cells increases excitatory drive, it also increases an inhibitory drive from amacrine cells via conventional GABAergic synapses (Kenyon & Marshak, 1998). These two opposing effects could explain why the light-induced increase in coupling did not result in a greater number of correlated spontaneous spikes. In contrast, the greater concerted light-evoked activity seen under light-adapted conditions suggests that common excitatory drive from bipolar cells to ganglion cells was necessary and sufficient to counter the proposed increase in inhibition.
There were thus three prominent affects of light adaptation on concerted spike activity. First, there was increase in the number of first- and second-tier α-GC neighbours that showed correlated light-evoked spiking. Second, the percentage of total light-evoked spikes of first- and second-tier neighbours that were correlated was increased. Finally, as a result of the enhanced coupling of second-tier neighbours, the electrical syncytium formed by coupled α-GCs was enlarged. Despite this enhanced lateral spread of current, we found that the size of the centre-receptive field of individual α-GCs was not significantly altered following light adaptation. Thus, increased electrical coupling did not result in attenuated spatial acuity. Again, increased coupling of the ganglion cell/amacrine cell network is believed to augment lateral inhibition from amacrine cells (Kenyon & Marshak, 1998). This idea is consistent with the now classic finding that lateral (surround) inhibition to ganglion cells is greater in light-adapted than dark-adapted retinas (Barlow et al. 1957; Rodieck & Stone, 1965; Muller & Dacheux, 1997). In this scheme, the increased lateral inhibition would offset the enhanced lateral spread of current through coupling, thereby preserving the circumscribed centre-receptive field structure we observed under light-adapted conditions.
Mechanism of light-induced changes in coupling
In retina, light-activated neuromodulators such as dopamine or NO activate a number of intracellular pathways involving cAMP- or cGMP-dependent protein kinases (Bloomfield & Völgyi, 2009). This results in the phosphorylation/dephosphorylation of gap junction connexins that alters the conductance of gap junctions. We found that application of D2 (but not D1) receptor antagonists to dark-adapted retinas mimicked the light-induced increase in coupling. However, application of a D2 agonist did not block the increase in coupling observed following light adaptation. Instead, we found that application of a D1 receptor antagonist blocked the increased coupling seen in light-adapted retinas. Our finding that activation of two types of dopamine receptors affects coupling is consistent with those of Mills et al. (2007) showing that dopamine D1 and D2 receptor activation differentially modify the α-GC network.
Based on our pharmacological results we posit the following mechanism as responsible for the light-induced changes in coupling (Fig. 9). In this scheme, the basal levels of dopamine in dark-adapted retinas activate high-affinity D2 receptors resulting in an inhibition of adenylate cyclase, a dephosphorylation of connexins and a reduction in the permeability of α-GC gap junctions. This results in the relatively circumscribed coupling pattern seen under dark-adapted conditions. Accordingly, we posit that application of D2 antagonists to dark-adapted retinas phosphorylated gap junction connexins, thereby producing the observed enhanced coupling of the α-GC/amacrine cell network. Under mesopic/photopic conditions, dopamine levels increase and activate low-affinity D1 receptors which, via a cAMP-mediated activation of protein kinase A, increase connexin phosphorylation (Mills et al. 2007). While the conductance of many gap junctions is reduced by phosphorylation, others show an increase, including those between rod and cone photoreceptor (Ribelayga et al. 2008) and between AII amacrine cells (Kothmann et al. 2009). Our results suggest that activation of D1 receptors and the resultant connexin phosphorylation under light-adapted conditions increases the coupling of the α-GC network. Thus, although D2 receptor blockade in dark-adapted retinas can mimic the light-induced increase in coupling, it is in fact activation of D1 receptors that produces the increased coupling under light-adapted conditions. It should be noted that D2 autoreceptors on dopaminergic amacrine cells are thought to truncate dopamine release and thereby reduce activation of D1 receptors (Dubocovich & Weiner, 1985; Veruki, 1997). However, this mechanism cannot underlie the coupling increase produced by D2 receptor antagonists as we found that application of a D1 (or D2) receptor agonist did not produce enhanced coupling of the ganglion cell/amacrine cell network in dark-adapted retinas, while a D1 receptor agonist actually increased coupling in light-adapted retinas.
Figure 9. Schematic diagram of the intracellular pathway proposed to control the conductance of α-GC gap junctions under dark- and light-adapted conditions.
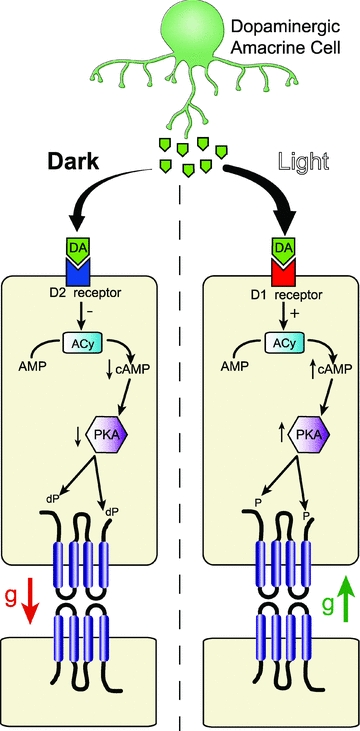
In this scheme, dopamine levels are low in the dark and activate the more sensitive D2 receptors, which, through reduction of cAMP and PKA activity, results in the dephosphorylation (dP) of connexin protein and a resultant reduction in the permeability of gap junctions. In contrast, light adaptation produces an increase in dopamine levels that activate D1 receptors, which, through an increase of cAMP and PKA activity, results in a phosphorylation (P) of connexins and an increase in gap junctional conductance. ACy = adenylate cyclase; g = conductance. Modified from Bloomfield & Völgyi (2009) with permission from Macmillan Publishers Ltd (Nature Reviews Neuroscience), ©2009.
Our finding that D2 antagonists increased coupling of the α-GC network is consistent with the findings by Mills et al. (2007). However, they reported that D1 dopamine receptor agonists reduced tracer coupling, while we found that they had no effect in dark-adapted retinas and actually increased coupling under light-adapted states. Moreover, Mills et al. (2007) speculated that the overall coupling of the α-GC network would decrease under light-adapted conditions, clearly opposite to our experimental findings. While an explanation for these conflicting results is unclear, the different histochemistry (fluorescence vs. peroxidase) used to visualize tracer coupling as well as differences in the adaptation state of the retinas (Mills et al. targeted cells visualized with fluorescent dyes excited by light and thus did not control for adaptation) could be contributing factors.
An important question is why D1 receptor activation in the dark-adapted retinas did not produce an increase in coupling as seen in the light-adapted condition. We speculate that endogenous activation of D2 receptors in dark-adapted retinas, which reduced gap junction permeability, counteracted any increase induced by pharmacological activation of the D1 receptors. In support of this idea, D1 and D2 receptors are known to have opposing actions on cAMP production (Vallone et al. 2000) and activation of D2 receptors can directly reduce the D1 receptor-dependent increase in cAMP in striatal neurons (Stoof & Kebabian, 1981). With the increased levels of dopamine release with light adaptation (Mills et al. 2007), it is likely that D2 receptors were desensitized (Schorderet & Nowak, 1990; Kim et al. 2001; Callier et al. 2003; Monte-Silva et al. 2009) allowing for the D1 receptor-mediated conductance increase to occur. Overall, then, the differential effects of dopaminergic drugs under dark- and light-adapted conditions are likely to reflect the changing extracellular concentration of dopamine and the different affinities of the D1 and D2 receptors.
It is important to note that there are three sets of gap junctions involved in the α-GC network: α-GC-to-α-GC, α-GC-to-amacrine cell, and likely amacrine cell-to-amacrine cell. Mills et al. (2007) reported that these gap junctions are differentially modulated by dopamine. However, the degree of coupling across the α-GC network is interdependent in that the coupling via one set of gap junctions will necessarily influence the movement of available tracers and current across other gap junctions. Therefore, although we found that light and extrinsically applied drugs had apparent homogeneous actions on the extent of coupling of α-GCs and amacrine cells, our findings do not exclude the possible differential modulation of the gap junctions within the α-GC network.
Role of correlated spiking
Spike synchrony and coherence occur throughout the visual system and have been studied extensively for retinal ganglion cells (Arnett & Spraker, 1981; Mastronarde, 1983a,b,c; Meister, 1996; Brivanlou et al. 1998; DeVries, 1999; Neuenschwander et al. 1999; Singer, 1999; Hu & Bloomfield, 2003; Shlens et al. 2008). Overall, our results extend previous reports that gap junctions play a crucial role in generating the correlated activity of neighbouring ganglion cells (Mastronarde, 1989; Brivanlou et al. 1998; DeVries, 1999; Hu & Bloomfield, 2003). It has been suggested that synchronous activity between ganglion cells compresses information for efficient transmission, thereby increasing the bandwidth of the optic nerve (Meister & Berry, 1999). In this scheme, synchronous activity can provide additional information to the brain by multiplexing with asynchronous signals from individual ganglion cells (Schnitzer & Meister, 2003).
In the primate, it is estimated that 20% more information about the visual world can be decoded from spike trains of parasol cell assembles when synchronized firing is included (Pillow et al. 2008). Concerted spike activity is also thought to enhance the saliency of visual signals by increasing temporal summation at central targets (Alonso & Martinez, 1998; Stevens & Zador, 1998; Usrey & Reid, 1999). In this way, concerted ganglion cell activity may provide the temporal precision by which retinal signals are reliably transmitted to central targets (Singer, 1999).
Our finding that correlated activity of α-GC neighbours is enhanced underlight-adapted conditions, via increased electrical coupling, is consistent with the need for efficient transmission of information under daylight conditions. Concerted firing would be particularly important during daylight vision to encode the additional information captured under bright light conditions and transmit it across the limited capacity of the optic nerve (Meister et al. 1995; Meister & Berry, 1999). The fact that this light-induced increase in correlated activity was found for α-GCs in both rabbit and mouse suggests that this may be a stereotypic mechanism to regulate information processing in the inner mammalian retina. It will therefore be of interest to determine how adaptation modulates gap junctions of the many other subtypes of ganglion cells, which show a variety of coupling patterns to ganglion and amacrine cell neighbours (Völgyi et al. 2009).
Acknowledgments
We thank Dr Jacob Lee for participating in a portion of the experiments and Dr Paul Witkovsky for helpful discussions. This work was supported by NIH Grants EY007360 and EY017832.
Glossary
Abbreviations
- α-GC
α-ganglion cell
- INL
inner nuclear layer
- IPL
inner plexiform layer
Author contributions
Conception and design of the experiments: E.H. and S.B.; collection, analysis and interpretation of data: E.H., F.P., B.V. and S.B.; drafting the article or revising it critically for important intellectual content: E.H., F.P., B.V. and S.B.
References
- Alonso JM, Martinez LM. Functional connectivity between simple cells and complex cells in cat striate cortex. Nat Neurosci. 1998;1:395–403. doi: 10.1038/1609. [DOI] [PubMed] [Google Scholar]
- Arnett D, Spraker TE. Cross-correlation analysis of the maintained discharge of rabbit retinal ganglion cells. J Physiol. 1981;317:29–47. doi: 10.1113/jphysiol.1981.sp013812. [DOI] [PMC free article] [PubMed] [Google Scholar]
- Barlow HB, Fitzhugh R, Kuffler SW. Change of organization in the receptive fields of the cat's retina during dark adaptation. J Physiol. 1957;137:338–354. doi: 10.1113/jphysiol.1957.sp005817. [DOI] [PMC free article] [PubMed] [Google Scholar]
- Bloomfield SA, Miller RF. A physiological and morphological study of the horizontal cell types of the rabbit retina. J Comp Neurol. 1982;208:288–303. doi: 10.1002/cne.902080306. [DOI] [PubMed] [Google Scholar]
- Bloomfield SA, Miller RF. A functional organization of ON and OFF pathways in the rabbit retina. J Neurosci. 1986;6:1–13. doi: 10.1523/JNEUROSCI.06-01-00001.1986. [DOI] [PMC free article] [PubMed] [Google Scholar]
- Bloomfield SA, Völgyi B. Function and plasticity of homologous coupling between AII amacrine cells. Vision Res. 2004;44:3297–3306. doi: 10.1016/j.visres.2004.07.012. [DOI] [PubMed] [Google Scholar]
- Bloomfield SA, Völgyi B. The diverse functional roles and regulation of neuronal gap junctions in the retina. Nat Rev Neurosci. 2009;10:495–506. doi: 10.1038/nrn2636. [DOI] [PMC free article] [PubMed] [Google Scholar]
- Bloomfield SA, Xin D, Osborne T. Light-induced modulation of coupling between AII amacrine cells in the rabbit retina. Vis Neurosci. 1997;14:565–576. doi: 10.1017/s0952523800012220. [DOI] [PubMed] [Google Scholar]
- Boycott BB, Wässle H. The morphological types of ganglion cells of the domestic cat's retina. J Physiol. 1974;240:397–419. doi: 10.1113/jphysiol.1974.sp010616. [DOI] [PMC free article] [PubMed] [Google Scholar]
- Brivanlou IH, Warland DK, Meister M. Mechanisms of concerted firing among retinal ganglion cells. Neuron. 1998;20:527–539. doi: 10.1016/s0896-6273(00)80992-7. [DOI] [PubMed] [Google Scholar]
- Callier S, Snapyan M, Le Crom S, Prou D, Vincent JD, Vernier P. Evolution and cell biology of dopamine receptors in vertebrates. Biol Cell. 2003;95:489–502. doi: 10.1016/s0248-4900(03)00089-3. [DOI] [PubMed] [Google Scholar]
- Dacey DM, Brace S. A coupled network for parasol but not midget ganglion cells in the primate retina. Vis Neurosci. 1992;9:279–290. doi: 10.1017/s0952523800010695. [DOI] [PubMed] [Google Scholar]
- DeVries SH. Correlated firing in rabbit retinal ganglion cells. J Neurophysiol. 1999;81:908–920. doi: 10.1152/jn.1999.81.2.908. [DOI] [PubMed] [Google Scholar]
- DeVries SH, Schwartz EA. Modulation of an electrical synapse between solitary pairs of catfish horizontal cells by dopamine and second messengers. J Physiol. 1989;414:351–375. doi: 10.1113/jphysiol.1989.sp017692. [DOI] [PMC free article] [PubMed] [Google Scholar]
- Dubocovich ML, Weiner N. Pharmacological differences between the D-2 autoreceptor and the D-1 dopamine receptor in rabbit retina. J Pharmacol Exp Ther. 1985;233:747–754. [PubMed] [Google Scholar]
- Famiglietti EV, Jr, Kaneko A, Tachibana M. Neuronal architecture of on and off pathways to ganglion cells in carp retina. Science. 1977;198:1267–1269. doi: 10.1126/science.73223. [DOI] [PubMed] [Google Scholar]
- Hu EH, Bloomfield SA. Gap junctional coupling underlies the short-latency spike synchrony of retinal α ganglion cells. J Neurosci. 2003;23:6768–6777. doi: 10.1523/JNEUROSCI.23-17-06768.2003. [DOI] [PMC free article] [PubMed] [Google Scholar]
- Hu EH, Dacheux RF, Bloomfield SA. A flattened retina-eyecup preparation suitable for electrophysiological studies of neurons visualized with trans-scleral infrared illumination. J Neurosci Methods. 2000;103:209–216. doi: 10.1016/s0165-0270(00)00319-8. [DOI] [PubMed] [Google Scholar]
- Kenyon GT, Marshak DW. Gap junctions with amacrine cells provide a feedback pathway for ganglion cells within the retina. Proc Biol Sci. 1998;265:919–925. doi: 10.1098/rspb.1998.0379. [DOI] [PMC free article] [PubMed] [Google Scholar]
- Kim KM, Valenzano KJ, Robinson SR, Yao WD, Barak LS, Caron MG. Differential regulation of the dopamine D2 and D3 receptors by G protein-coupled receptor kinases and β-arrestins. J Biol Chem. 2001;276:37409–37414. doi: 10.1074/jbc.M106728200. [DOI] [PubMed] [Google Scholar]
- Koistinaho J, Swanson RA, de Vente J, Sagar SM. NADPH-diaphorase (nitric oxide synthase)-reactive amacrine cells of rabbit retina: putative target cells and stimulation by light. Neuroscience. 1993;57:587–597. doi: 10.1016/0306-4522(93)90008-4. [DOI] [PubMed] [Google Scholar]
- Kothmann WW, Massey SC, O’Brien J. Dopamine-stimulated dephosphorylation of connexin 36 mediates AII amacrine cell uncoupling. J Neurosci. 2009;29:14903–14911. doi: 10.1523/JNEUROSCI.3436-09.2009. [DOI] [PMC free article] [PubMed] [Google Scholar]
- Lasater EM. Retinal horizontal cell gap junctional conductance is modulated by dopamine through a cyclic AMP-dependent protein kinase. Proc Natl Acad Sci U S A. 1987;84:7319–7323. doi: 10.1073/pnas.84.20.7319. [DOI] [PMC free article] [PubMed] [Google Scholar]
- Mangel SC, Dowling JE. Responsiveness and receptive field size of carp horizontal cells are reduced by prolonged darkness and dopamine. Science. 1985;229:1107–1109. doi: 10.1126/science.4035351. [DOI] [PubMed] [Google Scholar]
- Mastronarde DN. Correlated firing of cat retinal ganglion cells. I. Spontaneously active inputs to X- and Y-cells. J Neurophysiol. 1983a;49:303–324. doi: 10.1152/jn.1983.49.2.303. [DOI] [PubMed] [Google Scholar]
- Mastronarde DN. Correlated firing of cat retinal ganglion cells. II. Responses of X- and Y-cells to single quantal events. J Neurophysiol. 1983b;49:325–349. doi: 10.1152/jn.1983.49.2.325. [DOI] [PubMed] [Google Scholar]
- Mastronarde DN. Interactions between ganglion cells in cat retina. J Neurophysiol. 1983c;49:350–365. doi: 10.1152/jn.1983.49.2.350. [DOI] [PubMed] [Google Scholar]
- Mastronarde DN. Correlated firing of retinal ganglion cells. Trends Neurosci. 1989;12:75–80. doi: 10.1016/0166-2236(89)90140-9. [DOI] [PubMed] [Google Scholar]
- Meier C, Dermietzel R. Electrical synapses–gap junctions in the brain. Results Probl Cell Differ. 2006;43:99–128. doi: 10.1007/400_013. [DOI] [PubMed] [Google Scholar]
- Meister M. Multineuronal codes in retinal signaling. Proc Natl Acad Sci U S A. 1996;93:609–614. doi: 10.1073/pnas.93.2.609. [DOI] [PMC free article] [PubMed] [Google Scholar]
- Meister M, Berry MJ., 2nd The neural code of the retina. Neuron. 1999;22:435–450. doi: 10.1016/s0896-6273(00)80700-x. [DOI] [PubMed] [Google Scholar]
- Meister M, Lagnado L, Baylor DA. Concerted signaling by retinal ganglion cells. Science. 1995;270:1207–1210. doi: 10.1126/science.270.5239.1207. [DOI] [PubMed] [Google Scholar]
- Mills SL, Massey SC. Differential properties of two gap junctional pathways made by AII amacrine cells. Nature. 1995;377:734–737. doi: 10.1038/377734a0. [DOI] [PubMed] [Google Scholar]
- Mills SL, Xia XB, Hoshi H, Firth SI, Rice ME, Frishman LJ, Marshak DW. Dopaminergic modulation of tracer coupling in a ganglion-amacrine cell network. Vis Neurosci. 2007;24:593–608. doi: 10.1017/S0952523807070575. [DOI] [PMC free article] [PubMed] [Google Scholar]
- Monte-Silva K, Min-Fang K, Thirugnanasambandam N, Liebetanz D, Paulas W, Nitsche MA. Dose-dependent inverted U-shaped effect of dopamine (D2-like) receptor activation on focal and nonfocal plasticity in humans. J Neurosci. 2009;29:6124–6131. doi: 10.1523/JNEUROSCI.0728-09.2009. [DOI] [PMC free article] [PubMed] [Google Scholar]
- Muller JF, Dacheux RF. Alpha ganglion cells of the rabbit retina lose antagonistic surround responses under dark adaptation. Vis Neurosci. 1997;14:395–401. doi: 10.1017/s0952523800011512. [DOI] [PubMed] [Google Scholar]
- Nelson R, Famiglietti EV, Jr, Kolb H. Intracellular staining reveals different levels of stratification for on- and off-center ganglion cells in cat retina. J Neurophysiol. 1978;41:472–483. doi: 10.1152/jn.1978.41.2.472. [DOI] [PubMed] [Google Scholar]
- Neuenschwander S, Castelo-Branco M, Singer W. Synchronous oscillations in the cat retina. Vision Res. 1999;39:2485–2497. doi: 10.1016/s0042-6989(99)00042-5. [DOI] [PubMed] [Google Scholar]
- Patel LS, Mitchell CK, Dubinsky WP, O’Brien J. Regulation of gap junction coupling through the neuronal connexin Cx35 by nitric oxide and cGMP. Cell Commun Adhes. 2006;13:41–54. doi: 10.1080/15419060600631474. [DOI] [PMC free article] [PubMed] [Google Scholar]
- Peichl L. Alpha ganglion cells in mammalian retinae: common properties, species differences, and some comments on other ganglion cells. Vis Neurosci. 1991;7:155–169. doi: 10.1017/s0952523800011020. [DOI] [PubMed] [Google Scholar]
- Peichl L, Ott H, Boycott BB. Alpha ganglion cells in mammalian retinae. Proc R Soc Lond B Biol Sci. 1987;231:169–197. doi: 10.1098/rspb.1987.0040. [DOI] [PubMed] [Google Scholar]
- Penn AA, Wong RO, Shatz CJ. Neuronal coupling in the developing mammalian retina. J Neurosci. 1994;14:3805–3815. doi: 10.1523/JNEUROSCI.14-06-03805.1994. [DOI] [PMC free article] [PubMed] [Google Scholar]
- Perkel DH, Gerstein GL, Moore GP. Neuronal spike trains and stochastic point processes. II. Simultaneous spike trains. Biophys J. 1967;7:419–440. doi: 10.1016/S0006-3495(67)86597-4. [DOI] [PMC free article] [PubMed] [Google Scholar]
- Pillow JW, Shlens J, Paninski L, Sher A, Litke AM, Chichilnisky EJ, Simoncelli EP. Spatio-temporal correlations and visual signalling in a complete neuronal population. Nature. 2008;454:995–999. doi: 10.1038/nature07140. [DOI] [PMC free article] [PubMed] [Google Scholar]
- Ribelayga C, Cao Y, Mangel SC. The circadian clock in the retina controls rod-cone coupling. Neuron. 2008;59:790–801. doi: 10.1016/j.neuron.2008.07.017. [DOI] [PMC free article] [PubMed] [Google Scholar]
- Rodieck RW, Stone J. Analysis of receptive fields of cat retinal ganglion cells. J Neurophysiol. 1965;28:832–849. doi: 10.1152/jn.1965.28.5.833. [DOI] [PubMed] [Google Scholar]
- Schnitzer MJ, Meister M. Multineuronal firing patterns in the signal from eye to brain. Neuron. 2003;37:499–511. doi: 10.1016/s0896-6273(03)00004-7. [DOI] [PubMed] [Google Scholar]
- Schorderet M, Nowak JZ. Retinal dopamine D1 and D2 receptors: characterization by binding or pharmacological studies and physiological functions. Cell Mol Neurobiol. 1990;10:303–325. doi: 10.1007/BF00711177. [DOI] [PMC free article] [PubMed] [Google Scholar]
- Shlens J, Rieke F, Chichilnisky E. Synchronized firing in the retina. Curr Opin Neurobiol. 2008;18:396–402. doi: 10.1016/j.conb.2008.09.010. [DOI] [PMC free article] [PubMed] [Google Scholar]
- Singer W. Neuronal synchrony: a versatile code for the definition of relations? Neuron. 1999;24:49–65. 111–125. doi: 10.1016/s0896-6273(00)80821-1. [DOI] [PubMed] [Google Scholar]
- Söhl G, Maxeiner S, Willecke K. Expression and functions of neuronal gap junctions. Nat Rev Neurosci. 2005;6:191–200. doi: 10.1038/nrn1627. [DOI] [PubMed] [Google Scholar]
- Stevens CF, Zador AM. Input synchrony and the irregular firing of cortical neurons. Nat Neurosci. 1998;1:210–217. doi: 10.1038/659. [DOI] [PubMed] [Google Scholar]
- Stoof JC, Kebabian JW. Opposing roles for D-1 and D-2 dopamine receptors in efflux of cyclic AMP from rat neostriatum. Nature. 1981;294:366–368. doi: 10.1038/294366a0. [DOI] [PubMed] [Google Scholar]
- Trong PK, Rieke F. Origin of correlated activity between parasol retinal ganglion cells. Nat Neurosci. 2008;11:1343–1351. doi: 10.1038/nn.2199. [DOI] [PMC free article] [PubMed] [Google Scholar]
- Usrey WM, Reid RC. Synchronous activity in the visual system. Annu Rev Physiol. 1999;61:435–456. doi: 10.1146/annurev.physiol.61.1.435. [DOI] [PubMed] [Google Scholar]
- Vallone D, Picetti R, Borrelli E. Structure and function of dopamine receptors. Neurosci Biobehav Rev. 2000;24:125–132. doi: 10.1016/s0149-7634(99)00063-9. [DOI] [PubMed] [Google Scholar]
- Vaney DI. Many diverse types of retinal neurons show tracer coupling when injected with biocytin or Neurobiotin. Neurosci Lett. 1991;125:187–190. doi: 10.1016/0304-3940(91)90024-n. [DOI] [PubMed] [Google Scholar]
- Veruki ML. Dopaminergic neurons in the rat retina express dopamine D2/3 receptors. Eur J Neurosci. 1997;9:1096–1100. doi: 10.1111/j.1460-9568.1997.tb01461.x. [DOI] [PubMed] [Google Scholar]
- Völgyi B, Abrams J, Paul DL, Bloomfield SA. Morphology and tracer coupling pattern of alpha ganglion cells in the mouse retina. J Comp Neurol. 2005;492:66–77. doi: 10.1002/cne.20700. [DOI] [PMC free article] [PubMed] [Google Scholar]
- Völgyi B, Chheda S, Bloomfield SA. Tracer coupling patterns of the ganglion cell subtypes in the mouse retina. J Comp Neurol. 2009;512:664–687. doi: 10.1002/cne.21912. [DOI] [PMC free article] [PubMed] [Google Scholar]
- Völgyi B, Deans MR, Paul DL, Bloomfield SA. Convergence and segregation of the multiple rod pathways in mammalian retina. J Neurosci. 2004;24:11182–11192. doi: 10.1523/JNEUROSCI.3096-04.2004. [DOI] [PMC free article] [PubMed] [Google Scholar]
- Wässle H, Levick WR, Cleland BG. The distribution of the alpha type of ganglion cells in the cat's retina. J Comp Neurol. 1975;159:419–438. doi: 10.1002/cne.901590308. [DOI] [PubMed] [Google Scholar]
- Wässle H, Peichl L, Boycott BB. Morphology and topography of on- and off-alpha cells in the cat retina. Proc R Soc Lond B Biol Sci. 1981;212:157–175. doi: 10.1098/rspb.1981.0032. [DOI] [PubMed] [Google Scholar]
- Witkovsky P. Dopamine and retinal function. Doc Ophthalmol. 2004;108:17–40. doi: 10.1023/b:doop.0000019487.88486.0a. [DOI] [PubMed] [Google Scholar]
- Xin D, Bloomfield SA. Tracer coupling pattern of amacrine and ganglion cells in the rabbit retina. J Comp Neurol. 1997;383:512–528. doi: 10.1002/(sici)1096-9861(19970714)383:4<512::aid-cne8>3.0.co;2-5. [DOI] [PubMed] [Google Scholar]
- Xin D, Bloomfield SA. Comparison of the responses of AII amacrine cells in the dark- and light-adapted rabbit retina. Vis Neurosci. 1999a;16:653–665. doi: 10.1017/s0952523899164058. [DOI] [PubMed] [Google Scholar]
- Xin D, Bloomfield SA. Dark- and light-induced changes in coupling between horizontal cells in mammalian retina. J Comp Neurol. 1999b;405:75–87. doi: 10.1002/(sici)1096-9861(19990301)405:1<75::aid-cne6>3.0.co;2-d. [DOI] [PubMed] [Google Scholar]