

Abstract
Ca2+-activated Cl− channels play relevant roles in several physiological processes, including olfactory transduction, but their molecular identity is still unclear. Recent evidence suggests that members of the transmembrane 16 (TMEM16, also named anoctamin) family form Ca2+-activated Cl− channels in several cell types. In vertebrate olfactory transduction, TMEM16b/anoctamin2 has been proposed as the major molecular component of Ca2+-activated Cl− channels. However, a comparison of the functional properties in the whole-cell configuration between the native and the candidate channel has not yet been performed. In this study, we have used the whole-cell voltage-clamp technique to measure functional properties of the native channel in mouse isolated olfactory sensory neurons and compare them with those of mouse TMEM16b/anoctamin2 expressed in HEK 293T cells. We directly activated channels by rapid and reproducible intracellular Ca2+ concentration jumps obtained from photorelease of caged Ca2+ and determined extracellular blocking properties and anion selectivity of the channels. We found that the Cl− channel blockers niflumic acid, 5-nitro-2-(3-phenylpropylamino)benzoic acid (NPPB) and DIDS applied at the extracellular side of the membrane caused a similar inhibition of the two currents. Anion selectivity measured exchanging external ions and revealed that, in both types of currents, the reversal potential for some anions was time dependent. Furthermore, we confirmed by immunohistochemistry that TMEM16b/anoctamin2 largely co-localized with adenylyl cyclase III at the surface of the olfactory epithelium. Therefore, we conclude that the measured electrophysiological properties in the whole-cell configuration are largely similar, and further indicate that TMEM16b/anoctamin2 is likely to be a major subunit of the native olfactory Ca2+-activated Cl− current.
Introduction
In several cell types, an increase in intracellular Ca2+ concentration produces the activation of chloride channels that, depending on the electrochemical gradient of Cl−, will cause depolarization or hyperpolarization of the cell membrane. Ca2+-activated Cl− channels were first identified in Xenopus oocytes (Miledi, 1982; Barish, 1983) and in the inner segment of salamander photoreceptors (Bader et al. 1982), and afterwards in many other cell types, including olfactory sensory neurons (Kleene & Gesteland, 1991; Kleene, 1993; Kurahashi & Yau, 1993). These channels are involved in a large variety of physiological processes, including generation of the fertilization potential in Xenopus oocytes, regulation of synaptic transmission in photoreceptors, and signal amplification in olfactory sensory neurons (reviewed by Frings et al. 2000; Hartzell et al. 2005; Kleene, 2008; Frings, 2009a,b;).
Despite the physiological relevance of Ca2+-activated Cl− channels, their molecular identity remained largely elusive. Several molecular candidates have been proposed for these channels, but none of them completely reproduced the properties of native Ca2+-activated Cl− currents (reviewed by Hartzell et al. 2005; Duran et al. 2010). In 2008, three independent studies reported evidence suggesting that some members of the family of TMEM16/anoctamins are likely to be the molecular determinants of Ca2+-activated Cl− currents in some cell types (Caputo et al. 2008; Schroeder et al. 2008; Yang et al. 2008; reviewed by Flores et al. 2009; Galietta, 2009; Hartzell et al. 2009; Kunzelmann et al. 2009).
In olfactory sensory neurons, Ca2+-activated Cl− currents are measured, together with cAMP-activated currents, in the cilia (Kleene & Gesteland, 1991; Kleene, 1993), where they play an important role in the amplification of the response to odorants, constituting up to 90% of the transduction current (Kurahashi & Yau, 1993; Lowe & Gold, 1993; Boccaccio & Menini, 2007). Indeed, the process of olfactory transduction occurs in the cilia of olfactory sensory neurons, where a second messenger cascade is activated by the binding of odorant molecules to odorant receptors and leads to the production of cAMP and the opening of cAMP-activated channels (reviewed by Schild & Restrepo, 1998; Lowe & Gold, 1993; Menini, 1999; Matthews & Reisert, 2003; Menini et al. 2004; Pifferi et al. 2006a, 2009c; Kleene, 2008; Tirindelli et al. 2009). Since olfactory sensory neurons maintain an unusually elevated intracellular concentration of Cl− (Reuter et al. 1998; Kaneko et al. 2001, 2004), the influx of Ca2+ through cAMP-activated channels in the cilia produces an efflux of Cl− through Ca2+-activated Cl− channels, contributing to the odorant-induced depolarization (Kleene & Gesteland, 1991; Kleene, 1993, 1997, 2008; Kurahashi & Yau, 1993; Lowe & Gold, 1993; Boccaccio & Menini, 2007; reviewed by Frings et al. 2000; Frings, 2009a,b; Pifferi et al. 2009c).
At present, several lines of evidence indicate that TMEM16b/anoctamin2 is the best candidate for being the main molecular component of the olfactory Ca2+-activated Cl− channels in the cilia. Indeed, in situ hybridization studies showed that TMEM16b/anoctamin2 is expressed in mature sensory neurons of the mouse olfactory epithelium (Yu et al. 2005); proteomic screenings identified TMEM16b/anoctamin2 as a prominent protein of olfactory ciliary membranes (Stephan et al. 2009; Hengl et al. 2010; Rasche et al. 2010); the fusion protein TMEM16b/anoctamin2–EGFP localized to the cilia when expressed in vivo using an adenoviral vector (Stephan et al. 2009); immunohistochemistry showed the localization of TMEM16b/anoctamin2 to the ciliary region (Hengl et al. 2010; Rasche et al. 2010); functional properties measured by patch-clamp recordings from excised inside-out membrane patches of TMEM16b/anoctamin2 expressed in HEK 293T cells or from the dendritic knobs and ciliary region of olfactory sensory neurons are very similar (Pifferi et al. 2009a; Stephan et al. 2009).
However, to identify the channel protein it is necessary to prove that all the functional properties of native channels are reproduced by the candidate protein. At present, several electrophysiological properties of native olfactory Ca2+-activated Cl− currents are still unknown. Indeed, while the properties of native olfactory channels in the excised cilium (Kleene & Gesteland, 1991; Kleene, 1993) or in the excised inside-out membrane patches have been extensively investigated (Reisert et al. 2003; Pifferi et al. 2006b, 2009b; Stephan et al. 2009), those of the native channels in isolated olfactory sensory neurons are poorly known. Moreover, currents in excised patches exhibited a pronounced rundown as well as inactivation/desensitization in the presence of a constant Ca2+ concentration (Reisert et al. 2003), while whole-cell recordings appeared to be more stable (Boccaccio & Menini, 2007; Takeuchi et al. 2009).
Niflumic acid or 4-acetamido-4-isothiocyanatostilben-2, 2-disulfonate (SITS; Kurahashi & Yau, 1993; Lowe and Gold, 1993) are commonly used as extracellular blockers of Ca2+-activated Cl− channels in intact olfactory sensory neurons, but the extracellular blocking potencies of several other compounds have not been measured. Moreover, the ion selectivity of the native channels in isolated olfactory sensory neurons has not been estimated yet, except for showing that the current is carried by Cl− ions (Kurahashi & Yau, 1993; Takeuchi et al. 2009).
The goal of this study was to measure the unknown electrophysiological properties of the native olfactory Ca2+-activated Cl− channels and to obtain a side-by-side comparison with the recently cloned TMEM16b/anoctamin2 (Stephan et al. 2009) heterologously expressed in HEK 293T cells. Channels were directly activated by rapidly increasing the intracellular Ca2+ concentration by flash photolysis of caged Ca2+.
Our results show that Ca2+-activated Cl− currents measured in the whole-cell configuration in olfactory sensory neurons were largely similar to those induced by the candidate protein, contributing further support to the hypothesis that TMEM16b/anoctamin2 is a major constituent of the olfactory Ca2+-activated Cl− channel.
Methods
Ethical approval
All animals were handled in accordance with the Italian Guidelines for the Use of Laboratory Animals (Decreto Legislativo 27/01/1992, no. 116) and European Union guidelines on animal research (No. 86/609/EEC). For experiments mice were killed by cervical dislocation or anaesthetized with CO2 inhalation and then decapitated.
RNA extraction and RT-PCR
RNA was extracted from the olfactory epithelium of FVB mice and purified using Trizol reagent (Invitrogen Milano, Italy). About 2 μg of total RNA served as template for oligo-dT primed first strand cDNA synthesis with Im-Prom-II Reverse Transcriptase (Promega, Milano, Italy). PCR was performed in Mastercycler Personal (Eppendorf, Milano, Italy) using AmpliBiotherm DNA polymerase, 3 mm MgCl2, 0.2 mm for each dNTPs and 200 pmol forward/reverse target-specific oligonucleotide primers. Cycling parameters consisted of an initial denaturation step (95°C, 2 min) followed by 35 cycles each of these included a denaturation (95°C, 30 s), a primer annealing (50°C, 30 s), and an extension (72°C, 30 s) step. Reaction was completed by a final extension step at 72°C for 5 min. Semiquantitative analysis of RNA expression was performed on agarose gel after electrophoresis using the NIS-Elements Advanced Research software (Nikon, Firenze, Italy).
Primers were designed to amplify a 650–700 bp DNA sequence, which is predicted to encode a region of the C-terminal intracellular domain of TMEM16/anoctamins. The chromosomic region corresponding to the amplicon DNA sequences spans over five exons and four introns.
The following primer sequences were used to amplify target DNAs:
TMEM16a/anoctamin1: bases 1826–2493, fwd: 5′-ACGTGTACATCTTCCGCTCTTT-3′ (Tm 58°C), rev: 5′ GATCTGAACCTCATAGCCCAG-3′ (Tm 59°C);
TMEM16b/anoctamin2: bases 1694–2358, fwd: 5′-ATGTCTACGTGTTCGACGGTTA-3′ (Tm 58°C) rev: 5′-AAACTGAACCTCCTGGTCGAA (Tm 57°C);
TMEM16c/anoctamin3: bases 2009–2652, fwd: 5′-ACAATAAACTTTTTGAGCGGTG-3′ (Tm 54°C) rev: 5′-GTAACCAGATTTTCCCATACC-3′ (Tm 55°C);
TMEM16d/anoctamin4: bases 1361–2052, fwd: 5′-ACTTGAGATTGATAAACAGGTG-3′ (Tm 54°C) rev: 5′-GTACTTCAGAGGGGTTCCTGA-3′ (Tm 59°C);
TMEM16e/anoctamin5: bases 1739–2382, fwd: 5′-ACACATATATGTTCAACATATGGA-3′ (Tm 54°C), rev: 5′-GGTGACGAAGTCTTTTTTCTC-3′) (Tm 55°C);
TMEM16f/anoctamin6: bases 1751–2418, fwd: 5′-CAGTGTACTTGCTGGGCAAATA-3′ (Tm 57°C), rev: 5′-CAAGGTATAGTTACCAAGCCC-3′(Tm 57°C);
TMEM16g/anoctamin7: bases 1685–2340, fwd: 5′-ACCACACCTTGTTTGGAATCC-3′ (Tm 57°C), rev: 5′-GTAAGTCGGAGAATAGTGTCC 3′ (Tm 57°C);
TMEM16h/anoctamin8: bases 1962–2665, fwd: 5′-CGAAGAAGACGATGAGCCTGA-3′ (Tm 71°C), rev: 5′-CCTGCCGCTCGTGCCGCTTGA-3′ (Tm 61°C);
TMEM16j/anoctamin9: bases 1331–2004, fwd: 5′-CCACGCGCCTGGCTGGCCTGTG-3′ (Tm 63°C), rev: 5′-CACGGTCACGTTTTCTTGGCC-3′ (Tm 54°C);
TMEM16k/anoctamin10: bases 1298–1894, fwd: 5′-TGGCCACACTCCTGATCACCTC-3′ (Tm 59°C), rev: 5′-AAGATTCGAATTCCAATCTGG-3′ (Tm 67°C);
OMP (olfactory marker protein): bases 1–1079, fwd: 5′-CCCTGCTGGCCAAAGCTGGAA-3′ (Tm 63°C), rev: 5′-GTCTCTAAAGCTGTAGGGAGA-3′ (Tm 58°C);
Vmn2r70, bases 1011–1704, fwd: 5′-TTACAGTAGTGAATTTTCCTTTGC-3′ (Tm 55°C), rev: 5′-TTGGAGGCAGAGAGTATGGTGTTC (Tm 63°C).
All amplicons were separated by agarose gel electrophoresis, the corresponding bands were excised and the DNA extracted and purified (Qiagen gel extraction Kit, Milano, Italy) and subsequently subcloned in pGEMt-easy vector (Promega) for sequencing.
Immunohistochemistry
Immunostainings of olfactory epithelium were performed as previously described (Pifferi et al. 2009b). Primary antibodies were: mouse monoclonal anti-TMEM16b (1:1; provided by H. Stöhr, Universität Regensburg, Regensburg, Germany; Stöhr et al. 2009) and rabbit anti-adenylyl cyclase III (1:300, Santa Cruz Biotechnology, SantaCruz, CA, USA; cat. no. sc-558). Secondary antibodies were: Alexa 488-conjugated goat anti-mouse and Alexa 594-conjugated goat anti-rabbit diluted to 1:300 (Molecular Probes-Invitrogen, West Eugene, OR, USA).
Images were visualized by Leica TCS SP2 confocal microscope (Leica Microsystems, Milano, Italy) acquired using Leica software at 1024 × 1024 pixels resolution and analysed with ImageJ software. Images were not modified other than to balance brightness and contrast.
Dissociation of mouse olfactory sensory neurons
Olfactory sensory neurons were dissociated enzymatically from the olfactory epithelium of 1- to 3-month-old C57 Black mice with a method similar to that previously described (Lagostena & Menini, 2003; Boccaccio et al. 2006). The olfactory epithelium was removed and transferred in 1 ml of zero-divalent mammalian Ringer solution with 200 μm cystein and 2 U ml−1 papain (Sigma, Milano, Italy) for 8–10 min at room temperature. The olfactory epithelium was minced with fine forceps. The reaction was stopped by adding 0.5 ml of Ringer solution with 0.1 mg ml−1 bovine serum albumin (BSA), 0.3 mg ml−1 leupeptin and 0.02 mg ml−1 of DNaseI (all from Sigma). After centrifugation (300 g for 5 min) the cells were resuspended in 1 ml of Ringer solution and plated on glass coverslips (WPI, Sarasota, FL, USA), coated with poly-l-lysine and concanavalin-A Type V (Sigma). Before use, dissociated olfactory sensory neurons were allowed to settle for 60 min at +4°C.
Only olfactory sensory neurons with clearly visible cilia were used for the experiments.
Heterologous expression of TMEM16b/anoctamin2
The full-length, dominant olfactory isoform of the mouse TMEM16b/anoctamin2 cloned into the expression vector pAdtrack-CMV (Stratagene, LaJolla, CA, USA) with an independent expression cassette for EGFP (provided by Haiqing Zhao of the Johns Hopkins University in Baltimore (Stephan et al. 2009), was transfected into HEK 293T cells using FuGENE 6 reagent (Roche Applied Science, Mannheim, Germany) according to the manufacturer's protocol. Transfected cells were identified by EGFP fluorescence and used for electrophysiological recordings from 24 to 48 h after transfection.
Patch-clamp recordings
Olfactory sensory neurons or HEK 293T cells transfected with TMEM16b/anoctamin2 were observed with an inverted microscope (Olympus IX70, Milano, Italy) with an oil immersion ×100 objective (Zeiss, Milano, Italy).
Currents in the whole-cell voltage-clamp mode were recorded with an Axopatch 200B patch-clamp amplifier, controlled by Clampex 8 via a Digidata 1322A (Axon Instruments, Union City, CA, USA). Patch pipettes were made using borosilicate capillaries (WPI) and pulled with a Narishige PP83 puller (Narishige, Tokyo, Japan). Pipette resistances were 3–7 MΩ when filled with the standard intracellular solution. Currents were low-pass filtered at 1 kHz and acquired at 2 kHz for experiments with olfactory sensory neurons, or filtered at 5 kHz and sampled at 10 kHz for experiments with transfected HEK 293T cells. All experiments were carried out at room temperature (20–24°C).
Ionic solutions and perfusion system
The extracellular mammalian Ringer solution contained (in mm): 140 NaCl, 5 KCl, 1 CaCl2, 1 MgCl2, 10 Hepes, 10 glucose and 1 sodium pyruvate (pH 7.4). The pipette solution contained (in mm): 140 CsCl, 3 DMNP–EDTA, 1.5 CaCl2 and 10 Hepes (pH 7.4). The caged Ca2+ compound DMNP–EDTA was purchased from Molecular Probes–Invitrogen, and CaCl2 was adjusted with a 0.1 m standard solution from Fluka (Deisenhofen, Germany). Pipette solution aliquots were stored for a few days at −20°C and kept refrigerated in the dark during the experimental session. Caged Ca2+ was allowed to diffuse from the patch pipette into the cell cytoplasm for at least 2 min after establishment of the whole-cell configuration.
Niflumic acid (NFA) and 5-nitro-2-(3-phenylpropylamino)benzoic acid (NPPB, Tocris Bioscience, Bristol, UK) were prepared in dimethyl sulfoxide (DMSO) as stock solutions at 200 mm or 83 mm, respectively, and diluted to the final concentration of 400 μm and 100 μm, respectively, in the bathing solution (DMSO alone did not alter the currents); 4,4′-diisothiocyanatostilbene-2,2′-disulfonic acid (DIDS) was directly dissolved in the bathing solution to 1 mm.
Different bathing solutions were delivered by using a gravity-fed perfusion system. A slow flow rate was selected in such a way that the position of the cilia of the neurons was not perturbed. A complete solution change was obtained in about 10 s. To measure blocker effects, current recordings were obtained before blocker application (control), 1–2 min after delivery of the solution with the blocker, and 2–5 min after perfusion with Ringer solution without the blocker (washout).
For ionic selectivity experiments, Cl− was substituted with other anions by replacing NaCl on an equimolar basis with NaX, where X is the substituted anion, or NaCl was replaced with equimolar choline chloride.
The bath was grounded through a 1 m KCl agar bridge connected to a Ag–AgCl reference electrode. Liquid junction potentials were calculated using Clampex's Junction Potential Calculator, based on the JPCalc program developed by Barry (1994; see also http://web.med.unsw.edu.au/phbsoft/LJP_Calculator.htm). Applied membrane potentials were corrected off-line. The liquid junction potential between the pipette and the Ringer solution was calculated. Then, if the bathing solution was changed after reaching the whole-cell configuration, we calculated the additional liquid junction potential generated between the bathing solution and the 1 m KCl agar bridge. We corrected membrane potentials for the following calculated liquid junction potentials (in mV) in the indicated bathing solutions: −4.6 in Ringer solution, −4.0 in isothiocyanate Ringer solution, −4.7 in bromide Ringer solution, −4.6 in iodide Ringer solution, −4.3 in nitrate Ringer solution, −3.0 in methanesulfonate Ringer solution, −5.3 in Ringer solution with NaCl replaced with choline chloride.
Chemicals, unless otherwise stated, were purchased from Sigma.
Photolysis of caged Ca2+
For flash photolysis of caged Ca2+, we used a xenon flash-lamp JML-C2 system (Rapp OptoElectronic, Hamburg, Germany) coupled with the epifluorescence port of the microscope with a quartz light guide as previously described (Boccaccio et al. 2006; Boccaccio & Menini, 2007). The spot of light had a diameter of about 15 μm and was focused on the ciliary region of olfactory sensory neurons or to cover about 50% of the surface of HEK 293T cells. The flash duration was less than 1.5 ms and was kept constant during each experiment. At the beginning of each experiment, the stability of the response was checked by applying repetitive flashes at intervals of about 2 min. Neurons or cells that did not reach a stable response to two or three flashes were discarded.
Data analysis
Data analysis and figures were made with Igor software (Wavemetrics, Lake Oswego, OR, USA). A single exponential function was fitted to the rising phase for monophasic current responses. Current recordings at each holding potential were plotted by subtracting the value of the baseline.
Data are reported as mean ±s.e.m. and the total number of cells (n). Statistical significance was determined using unpaired t tests, or ANOVA, as appropriate. When a statistically significant difference was determined with ANOVA, a Tukey post hoc test was done to evaluate which data groups showed significant differences. P values < 0.05 were considered significant.
Results
Expression of TMEM16s/anoctamins in the olfactory epithelium
To analyse the expression of each TMEM16/anoctamin in the olfactory epithelium, we performed RT-PCR using intron-spanning primers for amplifying DNA encoding a fragment of the C-terminal intracellular domain of each family member (Fig. 1).
Figure 1. Expression of TMEM16s/anoctamins in the olfactory epithelium.

A, olfactory transcripts of the TMEM16/anoctamin isoforms 1–10 were detected by RT-PCR (35 cycles) and sequencing. Specificity was confirmed by negative (olfactory epithelium cDNA amplified with primer for vomeronasal receptors, V2R2s) and positive (olfactory epithelium cDNA amplified with primers for OMP) controls. All lanes were loaded with the same amount of reaction product (5 μl) to obtain a semiquantitative evaluation of the TMEM16/anoctamin expression as represented in D. B, TMEM16c/anoctamin3, d/4, e/5, g/7 and h/8 (apparently undetectable in A) were loaded in a much larger amount and showed a lower but positive expression of d/4 and g/7. C, primer specificity for TMEM16c/anoctamin3, e/5 and h/8 (not detected in the olfactory epithelium) was confirmed by RT-PCR on cDNA from the whole embryo (E16). D, semiquantitative analysis of the TMEM16/anoctamin expression in the olfactory epithelium for the experiment shown in A.
We found expression in the olfactory epithelium for TMEM16a/anoctamin1, b/2, f/6, j/9 and k/10 (Fig. 1A). To semiquantify the expression of the different TMEM16/anoctamin isotypes in the olfactory epithelium, we amplified the OMP sequence in the same reaction. Results indicated that TMEM16a/anoctamin1, b/2 and j/9 are abundantly expressed, and f/6 and k/10 are moderately expressed (Fig. 1D). To further investigate the expression of TMEM16c/anoctamin3, d/4, e/5, g/7 and h/8 (undetectable in Fig. 1A and D) we loaded them in a much larger amounts and found a positive expression of d/4 and g/7 (Fig. 1B). No expression could be detected for TMEM16c/anoctamin3, e/5 and h/8 (Fig. 1A and B) although they are abundantly expressed in the whole E16 embryo (Fig. 1C). To validate the PCR results, all amplicons were directly sequenced after purification from agarose gel.
To examine the localization of TMEM16b/anoctamin2 in the olfactory epithelium, we performed immunohistochemistry experiments on cryosections of the olfactory epithelium by using an anti-TMEM16b antibody (Stöhr et al. 2009). We found staining at the surface of the olfactory epithelium, where TMEM16b/anoctamin2 largely co-localized with adenylyl cyclase III (Fig. 2), a protein that is mainly expressed in the cilia of olfactory sensory neurons (Menco et al. 1992, 1994; reviewed by Menco, 1997). However, we cannot exclude the presence of TMEM16b/anoctamin2 also in the microvilli of sustentacular cells at the surface of the olfactory epithelium. Therefore, our experiments are in agreement with previous results, obtained with different antibodies, showing that TMEM16b/anoctamin2 is expressed at the site of olfactory transduction (Hengl et al. 2010; Rasche et al. 2010).
Figure 2. Localization of TMEM16b/anoctamin2 at the surface of the olfactory epithelium.
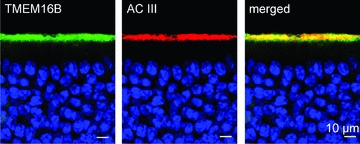
Immunostaining of sections of the olfactory epithelium. Confocal micrographs showing TMEM16b and adenylyl cyclase III (AC3) expression at the surface of the olfactory epithelium. Cell nuclei were stained by DAPI. The image on the right was obtained from the merge of the left and centre images. Scale bar is 10 μm in all panels.
Extracellular blockers of native Ca2+-activated currents in olfactory sensory neurons
The most commonly used extracellular blocker of Ca2+-activated Cl− current in intact olfactory sensory neurons is NFA at concentrations ranging between 300 and 500 μm (Kleene, 1993; Boccaccio et al. 2006; Boccaccio & Menini, 2007; Takeuchi et al. 2009), while the extracellular blocking potencies of several other compounds are still unknown. We measured the effect of adding 400 μm NFA, 100 μm NPPB or 1 mm DIDS at the extracellular side of olfactory sensory neurons, while activating the current by producing a sudden Ca2+ concentration increase by photorelease of caged Ca2+ in the ciliary region at the holding potential of −50 mV.
Figure 3A illustrates the typical NFA blockage of the current activated by a Ca2+ concentration jump produced by an ultraviolet flash applied at the time indicated in the upper panels. The maximal current amplitude was reduced to about 17% of its value before blocker application, and the effect was reversed after perfusion with Ringer solution without NFA (87% recovery), in agreement with previous data (Kleene, 1993; Boccaccio et al. 2006; Boccaccio & Menini, 2007; Takeuchi et al. 2009). To better illustrate the variability of results among neurons, we normalized the responses for each neuron in the presence and after washout of the blocker to the value measured before blocker application (Fig. 3, right panels). On average, the amplitude in the presence of 400 μm NFA was 13% of the control value. After perfusion with Ringer solution without the blocker, the current recovered on average to 63% of its control value.
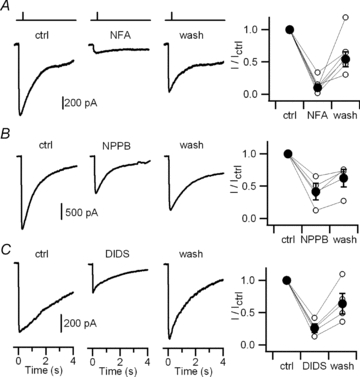
Figure 3. Olfactory sensory neurons: extracellular blockage of currents activated by photorelease of caged Ca2+ in the cilia.

Currents recorded in the whole-cell voltage-clamp configuration in response to sudden jumps in Ca2+ concentration obtained with photorelease of caged Ca2+. Ultraviolet light flashes were applied on the ciliary region at the times indicated by the vertical bars in the upper panels. The holding potential was −50 mV. The following blockers were used: A, 400 μm NFA; B, 100 μm NPPB; C, 1 mm DIDS. Current recordings were obtained before blocker application (control), 1–2 min after application of the indicated blockers, and 2–5 min after the removal of blockers (washout). Panels on the right show peak currents measured in the presence of each blocker and after washout, normalized to the control value before blocker application for each neuron (open circles). Average ratios are plotted as filled circles.
Figure 3B shows recordings from an olfactory sensory neuron in which the extracellular addition of 100 μm NPPB produced a strong block to 2% of its control value with an almost complete recovery after washout (79% recovery). In another neuron (Fig. 3C), 1 mm DIDS also blocked the Ca2+-activated current (2% of its control value) while the recovery was only partial (53% of control value).
On average, the current amplitude in the presence of 100 μm NPPB or 1 mm DIDS was, respectively, 16% or 20% of the control value (Fig. 3B and C, panels on the right). After washout of NPPB or DIDS, the current recovered on average to about 60% of its control value for both blockers (56% for NPPB and 65% for DIDS).
These results show that 100 μm NPPB and 1 mm DIDS may also be used as efficient blockers of the Ca2+-activated current in olfactory sensory neurons (see also Fig. 5).
Figure 5. Comparison of extracellular blockage of Ca2+-activated currents.
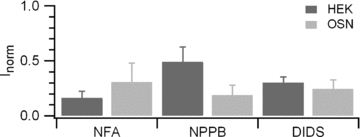
Average ratios of currents measured in the presence of each blocker normalized to the average between control and washout currents. Experiments were from olfactory sensory neurons (OSN, n = 3–8) or from HEK 293T cells transfected with TMEM16b/anoctamin2 (HEK, n = 4–6). The block efficacy of different compounds was not significantly different in olfactory sensory neurons (ANOVA, F = 0.33, P = 0.72). In contrast in HEK 293T cells, blockage by NFA was significantly bigger from NPPB block (ANOVA, Tukey test P < 0.05), but not different from DIDS block. However, current blockages in olfactory sensory neurons and in HEK 293T cells were not significantly different (unpaired t test).
Comparison of extracellular blockers of Ca2+-activated currents in HEK 293T cells expressing TMEM16b/anoctamin2 and in olfactory sensory neurons
To compare the pharmacological profile of the native olfactory Ca2+-activated current with that of the protein that is at present the best molecular candidate for being the olfactory channel, we used the same experimental conditions described in the previous section, uncaging caged Ca2+ in HEK 293T cells transfected with TMEM16b/anoctamin2.
As shown in Fig. 4A–C, each test compound partially blocked the Ca2+-activated current. On average, the current amplitude in the presence of 400 μm NFA, 100 μm NPPB or 1 mm DIDS was, respectively, 10%, 42% or 26% of the control value. After washout of the blockers, the current recovered on average to 54% (NFA), 62% (NPPB) or 64% (DIDS) of its control value.
Figure 4. TMEM16b-transfected HEK 293T cells: extracellular blockage of currents activated by photorelease of caged Ca2+.
Currents recorded in the whole-cell voltage-clamp configuration in response to photorelease of caged Ca2+. Ultraviolet light flashes were applied on HEK cells at the times indicated by the vertical bars in the upper panels. The holding potential was −50 mV. As in Fig. 3, the following blockers were used: A, 400 μm NFA; B, 100 μm NPPB; C, 1 mm DIDS. Current recordings were obtained before blocker application (control), 1–2 min after application of the indicated blockers, and 2–5 min after the removal of blockers (washout). Panels on the right show peak currents measured in the presence of each blocker and after washout, normalized to the control value before blocker application for each neuron (open circles). Average ratios are plotted as filled circles.
Since the current after washout from the blockers presented some variability, to better compare the blocking efficiencies for the native and the TMEM16b/anoctamin2-induced currents, we normalized the blocked current to the average between control and washout for each experiment (Fig. 5). Ca2+-activated currents were reduced on average to the following percentages: 69% for NFA, 81% for NPPB, 76% for DIDS in olfactory sensory neurons, to be compared with 84% for NFA, 51% for NPPB and 70% for DIDS in HEK 293T cells transfected with TMEM16b/anoctamin2.
The blocking potencies of the three test compounds (measured both with respect to control, Figs 3 and 4, or to the average between control and washout, Fig. 5), were not significantly different in olfactory sensory neurons, while in HEK 293T cells NFA blocked more potently than NPPB.
Anion selectivity of native Ca2+-activated currents in olfactory sensory neurons
To measure the ion selectivity of Ca2+-activated currents in the whole-cell configuration, we photoreleased caged Ca2+ in the ciliary region, and recorded the current at various holding potentials while changing the ion composition in the extracellular solution. To avoid contributions from Ca2+-activated K+ currents the intracellular monovalent cation was Cs+.
In a first set of experiments, the intracellular and extracellular Cl− concentrations were very similar ([Cl−]o = 149 mm, [Cl−]i = 143 mm) and the calculated equilibrium potential for Cl− was −1.0 mV. Figure 6A shows currents in response to Ca2+ concentration jumps obtained by photorelease of Ca2+ when an olfactory sensory neuron was held at the indicated holding potentials from −15 to +15 mV. The rise time of the response was fast and was fitted by a single exponential with τ = 27 ms at +5 mV and τ = 29 ms at −5 mV.
Figure 6. Olfactory sensory neurons: current responses induced by photorelease of Ca2+ in the presence of external Cl− or NO3−.
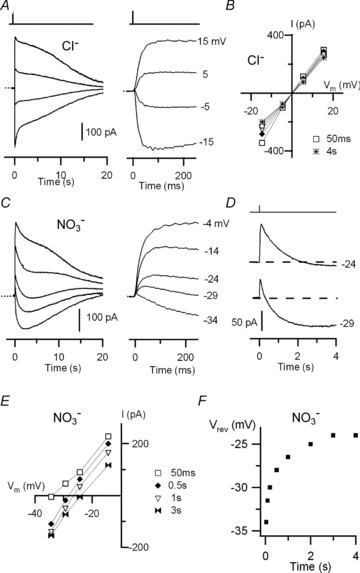
Currents recorded from isolated mouse olfactory sensory neurons in the whole-cell voltage-clamp configuration in response to photorelease of caged Ca2+ in the cilia at the time indicated by the vertical bars at the top. A, currents from an olfactory sensory neuron were recorded in almost symmetrical Cl− solutions at the indicated holding potentials and plotted on different time scales. The dotted line indicates the zero current level. B, current–voltage relations measured from recordings in A at different times from the flash: 50 ms square, 0.5 s diamond, 1 s triangle, 2 s circle, 3 s double triangle, 4 s asterisk. C, currents from another olfactory sensory neuron recorded in the presence of external NO3− at the indicated holding potentials and plotted on different time scales. The dotted line indicates the zero current level. D, recordings in external NO3− at −24 and −29 mV are shown on a different scale to better illustrate the time dependence of Vrev. E, current–voltage relations in external NO3− measured from recordings in C at different times from the flash: 50 ms open square, 0.5 s diamond, 1 s triangle, 3 s double triangle. F, Vrev as a function of time for external NO3− from recordings in C.
Figure 6B shows current–voltage relations measured at various times after Ca2+ photorelease. The Vrev extrapolated from each current–voltage relation did not significantly change with time and was 0.4 mV, close to the expected Cl− equilibrium potential (−1.0 mV). The average Vrev from several neurons was 1.0 ± 1.1 mV (n = 13).
Although Vrev was very close to the calculated equilibrium potential for Cl−, a non-selective cation current might also contribute to the Ca2+-activated current. If Ca2+-activated channels are permeable to cations, the replacement of Na+ by choline, a large organic cation that is usually impermeant in cation channels, should cause a large shift of the Vrev (Franciolini & Nonner, 1994; Qu & Hartzell, 2000; Hille, 2001). Instead, we found that the average Vrev measured in the presence of 140 mm choline chloride remained close to 0 mV, with an average value of 0.4 ± 0.6 mV (n = 3; data not shown), indicating that the Ca2+-activated current was indeed mainly carried by Cl−.
To measure the selectivity among anions we replaced 140 mm NaCl in the Ringer solution with NaNO3, NaI, NaSCN, NaBr or NaMeS and estimated the Vrev in the presence of each anion. After each anion substitution, the Ringer bathing solution still contained 9 mm Cl−, producing a calculated equilibrium potential for Cl− of +70.2 mV.
Figure 6C shows recordings in the presence of nitrate Ringer solution. Surprisingly, multiple current components were clearly evident at several holding potentials. At −29 mV, a fast outward current (τ = 15 ms) with a peak amplitude of +45 pA, was followed by a slower current component reaching a value of 0 pA about 250 ms after the flash and −75 pA at 2.5 s, as illustrated in Fig. 6D.
Current–voltage relations were measured at various times after Ca2+ photorelease (Fig. 6E) and the Vrev extrapolated from each current–voltage relation was plotted as a function of time in Fig. 6F. The Vrev in nitrate Ringer solution showed a time dependence with a gradual shift from a value of −34 mV at 50 ms, toward a less negative value of about −24 mV during the following 2–4 s.
In the presence of NaNO3, we measured a time-dependent shift of Vrev in each of four tested neurons. The average Vrev in the presence of NO3− was −28.6 ± 2.5 mV (n = 4) for the fast current component, and −17.3 ± 3.6 mV (n = 4) for the current component measured at 2–4 s. The shift of Vrev toward more negative values upon substitution of Cl− with NO3− indicates that NO3− was more permeant than Cl−.
Substitution of chloride Ringer with iodide Ringer solution also revealed the presence of multiple current components (Fig. 7A). At −25 mV a fast outward current with a peak amplitude of +270 pA 17 ms after the flash, was followed by a slower component reaching a value of −150 pA within 2 s from flash release. At −35 mV a fast inward current component with a value of −270 pA at 50 ms was followed by an additional slower component that reached −500 pA within 2 s (Fig. 7B). Thus, also in iodide Ringer solution, Vrev was time dependent, with a gradual shift from −30 mV at 50 ms, to −18 mV at 2–4 s (Fig. 7C).
Figure 7. Olfactory sensory neurons: current responses induced by photorelease of Ca2+ in external I−, SCN−, Br− or MeS−.
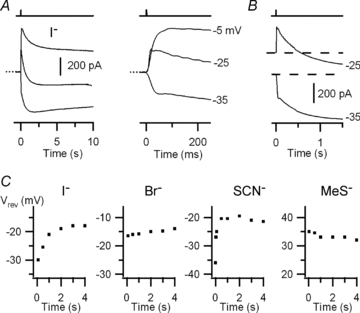
A, currents recorded at the indicated holding potentials from an olfactory sensory neuron bathed in external iodide Ringer solution. The dotted line indicates the zero current level. B, recordings in external I− at −25 and −35 mV are shown on a different scale to better illustrate the time dependence of Vrev. C, Vrev as a function of time for external I− (from the recordings in A), Br−, SCN− and MeS−, each from a different neuron.
A similar time dependence of Vrev was measured in isothiocyanate Ringer solution (from −36 to −21 mV for the experiment in Fig. 7C). In the presence of bromide Ringer solution, Vrev had a small time dependence (from −17 to −14 mV for the experiment in Fig. 7C), only in 2 out of 6 olfactory sensory neurons.
The average reversal potential of the fast component was −30.5 ± 3 mV (n = 6) in the presence of I−, −42 ± 5.5 mV (n = 4) in SCN− and −13.8 ± 2.2 mV (n = 6) for Br−.
When chloride Ringer was replaced by methanesulfonate Ringer solution, current recordings showed that MeS− was much less permeant than Cl−; indeed Vrev was +34 mV and remained fairly constant at different times (Fig. 7C). The average reversal potential was +31.6 ± 4.3 mV (n = 5). The selectivity sequence was SCN−≈ I−≈ NO3− > Br− > Cl− > MeS− (Fig. 10).
Figure 10. Comparison of anion selectivity for native and TMEM16b/anoctamin2-mediated current.

Average Vrev for the fast component measured in the presence of the indicated external anions. Experiments were from olfactory sensory neurons (OSN, n = 4–13) or from HEK 293T cells transfected with TMEM16b/anoctamin2 (HEK, n = 4–21). Vrev in olfactory sensory neurons and in HEK 293T cells were not significantly different (unpaired t test).
These results demonstrate that the current activated by Ca2+ photorelease in the ciliary region of olfactory sensory neurons is anion selective and that for some anions Vrev gradually shifted with time toward less negative values.
Anion selectivity of Ca2+-activated currents in HEK 293T cells expressing TMEM16b/anoctamin2
To investigate whether Ca2+-activated currents induced by TMEM16b/anoctamin2 in HEK 293T cells exhibits a time-dependent Vrev in the presence of some anions, we used the same experimental protocols as in olfactory sensory neurons.
Figure 8A shows recordings from a cell in chloride Ringer solution. As in olfactory sensory neurons, the rise time of the response to photorelease of Ca2+ in NaCl was fast and was well fitted by a single exponential with τ = 14 ms at +20 mV and τ = 4 ms at −20 mV. Current–voltage relations measured at various times (Fig. 8B) showed that the estimated Vrev was −0.2 mV and was not time dependent. Its average value was −0.7 ± 0.7 mV (n = 21). Moreover, when NaCl was replaced by choline chloride the average Vrev was −0.5 ± 0.6 mV, n = 4 (data not shown), similar to that in NaCl, indicating that the current was mainly carried by Cl−, as in olfactory sensory neurons.
Figure 8. Anion selectivity of the TMEM16b/anoctamin2-mediated current in external Cl− or NO3−.
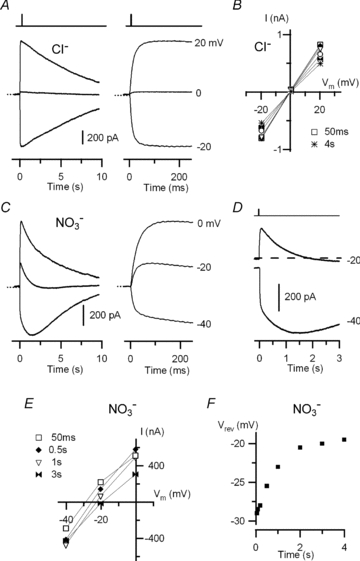
Currents recorded from HEK 293T cells expressing TMEM16b/anoctamin2 in the whole-cell voltage-clamp configuration in response to photorelease of caged Ca2+ at the time indicated by the vertical bars at the top. A, currents from a cell were recorded in almost symmetrical Cl− solutions at the indicated holding potentials and plotted on different time scales. The dotted line indicates the zero current level. B, current–voltage relations measured from recordings in A at different times from the flash: 50 ms square, 0.5 s diamond, 1 s triangle, 2 s circle, 3 s double triangle, 4 s asterisk. C, currents from another cell were recorded in the presence of external NO3− at the indicated holding potentials and plotted on different time scales. The dotted line indicates the zero current level. D, recordings in external NO3− at −40 and −20 mV are shown on a different scale to better illustrate the time dependence of Vrev. E, current–voltage relations in external NO3− measured from recordings in C at different times from the flash: 50 ms square, 0.5 s diamond, 1 s triangle, 3 s double triangle. F, Vrev as a function of time for external NO3− from the recordings in C.
In the presence of nitrate Ringer solution multiple current components were evident (Fig. 8C). The current amplitude at −20 mV was +230 pA 70 ms after the flash and −18 pA at 2.5 s (Fig. 8D). Current–voltage relations as a function of time (Fig. 8E) indicate that Vrev gradually shifted with time from −29 mV to about −20 mV at 2–4 s (Fig. 8F). On average, Vrev in the presence of NO3− was −26.8 ± 1.5 mV (n = 4) for the fast current component, and −19.5 ± 4.8 mV (n = 4) for the current component measured at 2–4 s.
Figure 9 shows a summary of results obtained with the other anions: in iodide Ringer solution (Fig. 9A and B), at −20 mV a fast current component of +140 pA was measured at 200 ms, followed by a slower component reaching −20 pA at 5 s. A fast and a slow component were also evident at −40 mV, with a value of −100 pA at 80 ms that reached −430 pA within 4 s. The time dependence of Vrev for I− is illustrated in Fig. 9C, where Vrev shifted from −26 to −18 mV at 2–4 s.
Figure 9. Anion selectivity of the TMEM16b/anoctamin2-mediated current in external I−, SCN−, Br− or MeS−.
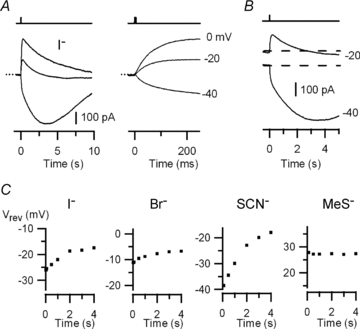
A, currents from a HEK 293T cell expressing TMEM16b/anoctamin2 were recorded in external iodide Ringer solution at the indicated holding potentials. The dotted line indicates the zero current level. B, recordings in external I− at −20 and −40 mV are shown on a different scale to better illustrate the time dependence of Vrev. C, Vrev as a function of time for external I− (from recordings in A), Br−, SCN− and MeS−, each from a different cell.
Vrev also had a significant time-dependent shift in isothyocianate Ringer solution (from −38.5 to −18 mV for the experiment in Fig. 9C), while the shift was smaller in bromide Ringer solution (from −11.2 to −7 mV for the experiment in Fig. 9C).
The average reversal potential of the fast component was −34.9 ± 1.8 mV (n = 4) in the presence of I−, −29.0 ± 4.0 mV (n = 5) in SCN− and −15.7 ± 0.4 mV (n = 5) in Br−.
Figure 9C shows that recordings in methanesulphonate Ringer solution exhibited a single current component with a time-independent Vrev of +27 mV. The average Vrev was +39.7 ± 4.6 mV (n = 6) confirming that MeS− is less permeant than Cl−.
Figure 10 summarizes the average Vrev of the fast component in olfactory sensory neurons and in HEK 293T cells expressing TMEM16b/anoctamin2. For both types of currents the selectivity sequence was the following: SCN−≈ I−≈ NO3− > Br− > Cl− > MeS−.
Furthermore, these results show that, similarly to olfactory sensory neurons, also in HEK 293T cells expressing TMEM16b/anoctamin2, the Vrev gradually shifted as a function of time toward less negative values in the presence of external NO3−, I−, SCN− and, to a lesser extent, in Br−, while it did not change with time in Cl− and in MeS−.
Discussion
Expression of TMEM16b/anoctamin2 in the ciliary layer
In this study, we show by RT-PCR that TMEM16b/anoctamin2 and some other members of the TMEM16/anoctamin family are expressed in the olfactory epithelium. Our results are in agreement with other reports showing the presence not only of TMEM16b/anoctamin2, but also of a/1 and k/10, whereas not all studies agree on other family members (Stephan et al. 2009; Rasche et al. 2010). Indeed, we identified also the presence of d/4, g/7 and j/9 that could not be detected in other reports (Rasche et al. 2010). Differences might be due to several reasons. The discrepancy for d/4 and g/7 might reflect a higher efficiency of our amplification reaction since both are likely to be poorly expressed in the olfactory epithelium. The different result for j/9 that, in our hands, appears abundantly expressed in the olfactory epithelium, is unlikely to be caused by the recognition of a different isoform, as oligonucleotide primers employed by Rasche and colleagues are internal to ours. It remains plausible that the modality for tissue collection may reveal an important variable to explain this inconsistency, although in our study, olfactory epithelia were isolated by distinct operators without appreciable differences in the final results.
Although not all studies agree on the specific family members, at present, only the mRNA of TMEM16b/anoctamin2 has been shown to be specific to mature olfactory sensory neurons by in situ hybridization (Yu et al. 2005), and proteomic screening of ciliary membranes (Mayer et al. 2009; Stephan et al. 2009) revealed only TMEM16b/anoctamin2 as a prominent protein in the olfactory cilia. Finally, the expression of TMEM16b/anoctamin2 in the ciliary layer of olfactory sensory neurons, has been independently confirmed by immunohistochemistry in our study, using the antibody developed by Stöhr et al. (2009), and in other recent reports using two other different antibodies (Hengl et al. 2010; Rasche et al. 2010).
Taken together, all these results indicate that TMEM16b/anoctamin2 is strongly expressed in the cilia of olfactory sensory neurons, where olfactory transduction takes place, while some other members of the family might be present at a lower level or in other cell types.
Extracellular blockers
In previous studies, the pharmacological profile of the native olfactory Ca2+-activated Cl− current has been investigated in detail only by applying Cl− channel inhibitors at the cytoplasmic side of isolated cilia from frog olfactory sensory neurons (Kleene & Gesteland, 1991; Kleene, 1993; reviewed by Frings et al. 2000). However, it is well known that some compounds have very different effects when applied to the extracellular or to the intracellular side of the membrane. The most commonly used extracellular blockers for Ca2+-activated Cl− currents in olfactory sensory neurons are NFA (Lowe & Gold, 1993; Reisert et al. 2005; Boccaccio et al. 2006; Boccaccio & Menini, 2007; Antolin et al. 2010), which blocks also from the intracellular side (Kleene & Gesteland, 1991; Kleene, 1993; Reisert et al. 2003; Pifferi et al. 2006b), and SITS (Kurahashi & Yau, 1993; Lowe & Gold, 1993), which is a much less effective blocker from the intracellular side (Kleene & Gesteland, 1991; Pifferi et al. 2006b). We determined that the blocking properties of two other compounds, NPPB and DIDS, are side-specific with extracellular inhibition of 85% for 100 μm NPPB and 76% for 1 mm DIDS, while Kleene and Gesteland (1991) measured a very poor intracellular inhibition: 32% for 300 μm NPPB, and 5% for 100 μm DIDS (see Table 2 of Frings et al. 2000).
Similar side-specific effects of NPPB and DIDS on TMEM16b-induced currents were obtained in this and in a previous study (Pifferi et al. 2009a). Moreover, we found that the average percentages of current inhibition of TMEM16b-induced currents were similar to those we measured in olfactory sensory neurons. Taken together, the results on intracellular (Kleene & Gesteland, 1991; Kleene, 1993; Pifferi et al. 2009a) and extracellular blockage of native olfactory and TMEM16b-induced currents indicate that NPPB and DIDS block the two currents in a similar side-specific manner.
It is of interest to note that in some neurons NPPB or DIDS blocked the current almost completely, while such a large inhibition was never observed in TMEM16b-induced currents in HEK cells. A small difference in results between native and expressed channels has also been pointed out by Saidu et al. (2010). In fact, in excised patches the native current slightly inactivates at positive membrane potentials (Reisert et al. 2003), whereas the TMEM16b/anoctamin2-induced current in HEK cells does not (Stephan et al. 2009; Saidu et al. 2010). These differences may point to the possibility that additional subunits and/or splice variants constitute the native channel, as recently suggested by Saidu et al. (2010).
Dynamic ion selectivity
Another important property of ion channels is ion selectivity. In previous reports, the ion selectivity of native olfactory Ca2+-activated Cl− currents has been measured only from inside-out membrane patches excised from the knob/ciliary region of olfactory sensory neurons, exchanging ions at the intracellular side of the membrane (Reisert et al. 2003; Pifferi et al. 2006b). The ion selectivity of native channels in isolated olfactory sensory neurons, replacing extracellular Cl− with other ions, has not been estimated yet with the exception of substitution of Cl− with the largely impermeant gluconate to demonstrate that the Ca2+-activated current was carried by Cl− (Takeuchi et al. 2009).
We found that some anions larger than Cl−, such as NO3−, I−, SCN− and Br−, were more permeant than Cl−, while MeS− was less permeant. Interestingly, in the presence of NO3−, SCN− and I−, a gradual time-dependent shift of Vrev was clearly evident. Indeed, Vrev in the presence of these anions changed with time, shifting about 10 mV toward less negative values over a few seconds after photorelease of Ca2+, indicating that channels became less permeant to some foreign anions. To the best of our knowledge, this is the first demonstration that the native olfactory Ca2+-activated Cl− current exhibits dynamic ion selectivity.
What is the origin of the dynamic ion selectivity? A possibility is that Vrev changes with time because of a restricted anion diffusion: if anions accumulate at the intracellular mouth of the channel, the local concentration gradient will change modifying Vrev. In the narrow ciliary compartment, restricted anion diffusion might cause the accumulation of anions flowing into the cilia near the intracellular mouth of the channel, therefore leading to a different concentration gradient and a modification of Vrev. However, it is unlikely that this effect is the origin of the time-dependent change in Vrev, because such an effect is expected to be present with all anions, whereas it was not observed in the presence of Cl− or of MeS−. Furthermore, in some experiments (Figs 6D and 7B) the current reversed direction, which should not result from restricted diffusion. In fact, if the initial NO3− or I− influx (outward current) causes an accumulation of NO3− or I− inside the cilium, this should only proceed until equilibrium (zero current) and it cannot account for the Cl− efflux (inward current) measured subsequently. Finally, an environmental-mediated restriction of anion diffusion, typical of the olfactory ciliary compartment, is unlikely to exist in TMEM16b/anoctamin2-transfected HEK 293T cells that, in turn, display a similar dynamic ion selectivity.
Since olfactory sensory neurons contain several types of channels, we cannot exclude that multiple current components might be due to the activation of different types of channels. Again, however, when the same experimental protocols were applied to HEK 293T cells expressing TMEM16b/anoctamin2, we obtained results very similar to those observed in the native olfactory channels. In HEK 293T cells, multiple current components were clearly evident in the presence of the same anions: NO3−, I− and SCN−, and absent with Cl− or MeS−. Moreover, the average Vrev for each anion was not significantly different between the two systems.
Our results have at least two important consequences: on one side they show that Ca2+-activated Cl− currents in olfactory sensory neurons have multiple components with different anion selectivity and, on the other side they show that heterologous expression of TMEM16b/anoctamin2 in HEK 293T cells reproduced similar results, indicating that time-dependent ion selectivity is not due to different types of channels.
The presence of multiple current components is not unique to the Ca2+-activated Cl− current present in olfactory sensory neurons since, for example, it has been found in Xenopus oocytes (Boton et al. 1989; Kuruma & Hartzell, 1999). More recently, Schroeder et al. (2008) clearly showed the presence of multiple current components with different anion selectivity, activating Ca2+-activated Cl− currents in Xenopus oocytes by photorelease of caged IP3. Moreover, Schroeder et al. (2008) demonstrated that the TMEM16a/anoctamin1 channel expressed in Axolotl oocytes, which do not have endogenous Ca2+-activated Cl− currents, also exhibited current components with different Vrev, suggesting that the multiple components originated from different states of the same channel.
Furthermore, it is of interest to note that dynamic changes in ion selectivity are not a peculiarity of anion channels, and they have been revealed in cation channels (Khakh & Lester, 1999). For example, the P2X receptor of mast cells allows a time-dependent membrane permeability to large molecules (Cockcroft & Gomperts, 1979), the transient receptor potential vanilloid 1 (TRPV1) channel shows a time- and concentration-dependent change in ion selectivity in the presence of prolonged exposure to chemical agonists (Chung et al. 2008), and a mutant N-methyl-d-aspartate (NMDA) channel exhibits multiple current components with time-dependent ion selectivity (Schneggenburger & Ascher, 1997). Single-channel analysis of the mutant NMDA channel revealed the existence of at least two subconductance states with different ion selectivity, indicating a strong coupling between permeation and gating (Schneggenburger & Ascher, 1997). Zheng and Sigworth (1997) also showed by single-channel analysis that a mutant Shaker K+ channel exhibits two subconductance states with different ion selectivity.
Another example of coupling between gating and permeation occurs in the cyclic nucleotide-gated channel in retinal rods. Indeed, it has been shown that in intact rod photoreceptors, selectivity among divalent cations changes with different levels of cGMP (Cervetto et al. 1988), and that in inside-out patches from photoreceptors, both the channel open probability and the selectivity of Ca2+ over Na+ increases with cGMP concentration (Hackos & Korenbrot, 1999). In addition, the linkage between selectivity and gating is specific for divalent cations, whereas it does not occur if only monovalent cations are present (Hackos & Korenbrot, 1999).
Previous studies on Ca2+-activated Cl− currents from various cell types showed that some foreign anions at the extracellular side affect gating by modifying channel kinetics (Evans & Marty, 1986; Greenwood & Large, 1999; Perez-Cornejo et al. 2004). Greenwood and Large (1999) suggested that some permeant anions might modulate the kinetics of Ca2+-activated Cl− channels in smooth muscle cells by binding to a site located on the external surface of the channel, which may be part of the channel representing the selectivity filter.
Our experiments were obtained by activating channels by a fast jump in Ca2+ concentration that decreased with time by diffusion and/or by active extrusion. In the presence of some anions, we observed a time-dependent shift of Vrev toward less negative values, corresponding to a decreased ion selectivity. A possible mechanism explaining the dynamic ion selectivity of native olfactory and TMEM16b/anoctamin2-induced Ca2+-activated Cl− currents is the presence of at least two open states with different ion selectivity and Ca2+-dependent open probability. Indeed, our results are consistent with a model in which the more selective open state is favoured by high Ca2+ concentrations and the less selective open state by low Ca2+ concentrations.
The understanding of this phenomenon at the molecular level by future mutational and structural analyses, will clarify the molecular mechanisms of gating and permeation of Ca2+-activated Cl− channels, contributing to increase the knowledge about their functioning in physiological and pathophysiological processes.
Conclusions
In conclusion, we confirmed by immunohistochemistry that TMEM16b/anoctamin2 is expressed in the ciliary layer, and showed that TMEM16b/anoctamin2 reproduced the phenotypes of the native olfactory Ca2+-activated Cl− currents, including the time-dependent change in selectivity. Taken together with previous studies on inside-out patches (Pifferi et al. 2009a; Stephan et al. 2009), these results contribute to strongly indicate that TMEM16b/anoctamin2 is likely to be the major subunit of the native olfactory Ca2+-activated Cl− current. Future studies should examine the presence of olfactory Ca2+-activated Cl− currents in mice in which the TMEM16b/anoctamin2 gene is deleted. Moreover, the combination of molecular biology studies and functional measurements will clarify if additional subunits and/or splice variants belonging to the TMEM16/anoctamin or to other protein families are also part of the native Ca2+-activated Cl− channel.
Acknowledgments
We thank H. Zhao (The Johns Hopkins University School of Medicine, Baltimore, MD, USA) for kindly providing the mouse olfactory TMEM16b/anoctamin2 DNA construct; H. Stöhr (Universitat Regensburg, Regensburg, Germany) for the gift of the TMEM16b monoclonal antibody; S. Pifferi, F. Celsi and all members of the laboratory for discussions. This study was supported by grants from the Italian Ministry of Education, University and Research (MIUR) and from the Italian Institute of Technology.
Glossary
Abbreviations
- DIDS
4,4′-diisothiocyanatostilbene-2,2′-disulfonic acid
- HEK
human embryonic kidney
- MeS−
methanesulfonate
- NFA
niflumic acid
- NPPB
5-nitro-2-(3-phenylpropylamino)benzoic acid
- SCN−
isothiocyanate
- TMEM16
transmembrane 16
Author contributions
All authors contributed to the conception and design of the experiments and approved the final version of the manuscript. RT-PCR experiments were performed by G.M. and R.T. at the University of Parma. Immunohistochemistry was done by M.D. and electrophysiological experiments were performed by C.S. and A.B. at SISSA, Trieste.
References
- Antolin S, Reisert J, Matthews HR. Olfactory response termination involves Ca2+-ATPase in vertebrate olfactory receptor neuron cilia. J Gen Physiol. 2010;135:367–378. doi: 10.1085/jgp.200910337. [DOI] [PMC free article] [PubMed] [Google Scholar]
- Bader CR, Bertrand D, Schwartz EA. Voltage-activated and calcium-activated currents studied in solitary rod inner segments from the salamander retina. J Physiol. 1982;331:253–284. doi: 10.1113/jphysiol.1982.sp014372. [DOI] [PMC free article] [PubMed] [Google Scholar]
- Barish ME. A transient calcium-dependent chloride current in the immature Xenopus oocyte. J Physiol. 1983;342:309–325. doi: 10.1113/jphysiol.1983.sp014852. [DOI] [PMC free article] [PubMed] [Google Scholar]
- Barry P. JPCalc, a software package for calculating liquid junction potential corrections in patch-clamp, intracellular, epithelial and bilayer measurements and for correcting junction potential measurements. J Neurosci Methods. 1994;51:107–116. doi: 10.1016/0165-0270(94)90031-0. [DOI] [PubMed] [Google Scholar]
- Boccaccio A, Lagostena L, Hagen V, Menini A. Fast adaptation in mouse olfactory sensory neurons does not require the activity of phosphodiesterase. J Gen Physiol. 2006;128:171–184. doi: 10.1085/jgp.200609555. [DOI] [PMC free article] [PubMed] [Google Scholar]
- Boccaccio A, Menini A. Temporal development of cyclic nucleotide-gated and Ca2+-activated Cl− currents in isolated mouse olfactory sensory neurons. J Neurophysiol. 2007;98:153–160. doi: 10.1152/jn.00270.2007. [DOI] [PubMed] [Google Scholar]
- Boton R, Dascal N, Gillo B, Lass Y. Two calcium-activated chloride conductances in Xenopus laevis oocytes permeabilized with the ionophore A23187. J Physiol. 1989;408:511–534. doi: 10.1113/jphysiol.1989.sp017473. [DOI] [PMC free article] [PubMed] [Google Scholar]
- Caputo A, Caci E, Ferrera L, Pedemonte N, Barsanti C, Sondo E, Pfeffer U, Ravazzolo R, Zegarra-Moran O, Galietta LJV. TMEM16A, a membrane protein associated with calcium-dependent chloride channel activity. Science. 2008;322:590–594. doi: 10.1126/science.1163518. [DOI] [PubMed] [Google Scholar]
- Cervetto L, Menini A, Rispoli G, Torre V. The modulation of the ionic selectivity of the light-sensitive current in isolated rods of the tiger salamander. J Physiol. 1988;406:181–198. doi: 10.1113/jphysiol.1988.sp017375. [DOI] [PMC free article] [PubMed] [Google Scholar]
- Chung M, Güler AD, Caterina MJ. TRPV1 shows dynamic ionic selectivity during agonist stimulation. Nat Neurosci. 2008;11:555–564. doi: 10.1038/nn.2102. [DOI] [PubMed] [Google Scholar]
- Cockcroft S, Gomperts BD. Activation and inhibition of calcium-dependent histamine secretion by ATP ions applied to rat mast cells. J Physiol. 1979;296:229–243. doi: 10.1113/jphysiol.1979.sp013002. [DOI] [PMC free article] [PubMed] [Google Scholar]
- Duran C, Thompson CH, Xiao Q, Hartzell HC. Chloride channels: often enigmatic, rarely predictable. Annu Rev Physiol. 2010;72:95–121. doi: 10.1146/annurev-physiol-021909-135811. [DOI] [PMC free article] [PubMed] [Google Scholar]
- Evans MG, Marty A. Calcium-dependent chloride currents in isolated cells from rat lacrimal glands. J Physiol. 1986;378:437–460. doi: 10.1113/jphysiol.1986.sp016229. [DOI] [PMC free article] [PubMed] [Google Scholar]
- Flores CA, Cid LP, Sepúlveda FV, Niemeyer MI. TMEM16 proteins: the long awaited calcium-activated chloride channels? Braz J Med Biol Res. 2009;42:993–1001. doi: 10.1590/s0100-879x2009005000028. [DOI] [PubMed] [Google Scholar]
- Franciolini F, Nonner W. A multi-ion permeation mechanism in neuronal background chloride channels. J Gen Physiol. 1994;104:725–746. doi: 10.1085/jgp.104.4.725. [DOI] [PMC free article] [PubMed] [Google Scholar]
- Frings S. Chloride-based signal amplification in olfactory sensory neurons. In: Alvarez-Leefmans FJ, Delpire E, editors. Physiology and Pathology of Chloride Transporters and Channels in the Nervous System. From Molecules to Diseases. San Diego, CA: Elsevier-Academic Press; 2009a. [Google Scholar]
- Frings S. Primary processes in sensory cells: current advances. J Comp Physiol A Neuroethol Sens Neural Behav Physiol. 2009b;195:1–19. doi: 10.1007/s00359-008-0389-0. [DOI] [PubMed] [Google Scholar]
- Frings S, Reuter D, Kleene SJ. Neuronal Ca2+-activated Cl− channels–homing in on an elusive channel species. Prog Neurobiol. 2000;60:247–289. doi: 10.1016/s0301-0082(99)00027-1. [DOI] [PubMed] [Google Scholar]
- Galietta LJV. The TMEM16 protein family: a new class of chloride channels? Biophys J. 2009;97:3047–3053. doi: 10.1016/j.bpj.2009.09.024. [DOI] [PMC free article] [PubMed] [Google Scholar]
- Greenwood IA, Large WA. Modulation of the decay of Ca2+-activated Cl− currents in rabbit portal vein smooth muscle cells by external anions. J Physiol. 1999;516:365–376. doi: 10.1111/j.1469-7793.1999.0365v.x. [DOI] [PMC free article] [PubMed] [Google Scholar]
- Hackos DH, Korenbrot JI. Divalent cation selectivity is a function of gating in native and recombinant cyclic nucleotide-gated ion channels from retinal photoreceptors. J Gen Physiol. 1999;113:799–818. doi: 10.1085/jgp.113.6.799. [DOI] [PMC free article] [PubMed] [Google Scholar]
- Hartzell C, Putzier I, Arreola J. Calcium-activated chloride channels. Annu Rev Physiol. 2005;67:719–758. doi: 10.1146/annurev.physiol.67.032003.154341. [DOI] [PubMed] [Google Scholar]
- Hartzell HC, Yu K, Xiao Q, Chien L, Qu Z. Anoctamin/TMEM16 family members are Ca2+-activated Cl−channels. J Physiol. 2009;587:2127–2139. doi: 10.1113/jphysiol.2008.163709. [DOI] [PMC free article] [PubMed] [Google Scholar]
- Hengl T, Kaneko H, Dauner K, Vocke K, Frings S, Möhrlen F. Molecular components of signal amplification in olfactory sensory cilia. Proc Natl Acad Sci U S A. 2010;107:6052–6057. doi: 10.1073/pnas.0909032107. [DOI] [PMC free article] [PubMed] [Google Scholar]
- Hille B. Ionic Channels of Excitable Membranes. Sunderland, MD: Sinauer Associates, Inc.; 2001. [Google Scholar]
- Kaneko H, Nakamura T, Lindemann B. Noninvasive measurement of chloride concentration in rat olfactory receptor cells with use of a fluorescent dye. Am J Physiol Cell Physiol. 2001;280:C1387–C1393. doi: 10.1152/ajpcell.2001.280.6.C1387. [DOI] [PubMed] [Google Scholar]
- Kaneko H, Putzier I, Frings S, Kaupp UB, Gensch T. Chloride accumulation in mammalian olfactory sensory neurons. J Neurosci. 2004;24:7931–7938. doi: 10.1523/JNEUROSCI.2115-04.2004. [DOI] [PMC free article] [PubMed] [Google Scholar]
- Khakh BS, Lester HA. Dynamic selectivity filters in ion channels. Neuron. 1999;23:653–658. doi: 10.1016/s0896-6273(01)80025-8. [DOI] [PubMed] [Google Scholar]
- Kleene SJ. Origin of the chloride current in olfactory transduction. Neuron. 1993;11:123–132. doi: 10.1016/0896-6273(93)90276-w. [DOI] [PubMed] [Google Scholar]
- Kleene SJ. High-gain, low-noise amplification in olfactory transduction. Biophys J. 1997;73:1110–1117. doi: 10.1016/S0006-3495(97)78143-8. [DOI] [PMC free article] [PubMed] [Google Scholar]
- Kleene SJ. The electrochemical basis of odor transduction in vertebrate olfactory cilia. Chem Senses. 2008;33:839–859. doi: 10.1093/chemse/bjn048. [DOI] [PubMed] [Google Scholar]
- Kleene SJ, Gesteland RC. Calcium-activated chloride conductance in frog olfactory cilia. J Neurosci. 1991;11:3624–3629. doi: 10.1523/JNEUROSCI.11-11-03624.1991. [DOI] [PMC free article] [PubMed] [Google Scholar]
- Kunzelmann K, Kongsuphol P, Aldehni F, Tian Y, Ousingsawat J, Warth R, Schreiber R. Bestrophin and TMEM16-Ca2+ activated Cl− channels with different functions. Cell Calcium. 2009;46:233–241. doi: 10.1016/j.ceca.2009.09.003. [DOI] [PubMed] [Google Scholar]
- Kurahashi T, Yau KW. Co-existence of cationic and chloride components in odorant-induced current of vertebrate olfactory receptor cells. Nature. 1993;363:71–74. doi: 10.1038/363071a0. [DOI] [PubMed] [Google Scholar]
- Kuruma A, Hartzell HC. Dynamics of calcium regulation of chloride currents in Xenopus oocytes. Am J Physiol Cell Physiol. 1999;276:C161–C175. doi: 10.1152/ajpcell.1999.276.1.C161. [DOI] [PubMed] [Google Scholar]
- Lagostena L, Menini A. Whole-cell recordings and photolysis of caged compounds in olfactory sensory neurons isolated from the mouse. Chem Senses. 2003;28:705–716. doi: 10.1093/chemse/bjg063. [DOI] [PubMed] [Google Scholar]
- Lowe G, Gold GH. Nonlinear amplification by calcium-dependent chloride channels in olfactory receptor cells. Nature. 1993;366:283–286. doi: 10.1038/366283a0. [DOI] [PubMed] [Google Scholar]
- Matthews HR, Reisert J. Calcium, the two-faced messenger of olfactory transduction and adaptation. Curr Opin Neurobiol. 2003;13:469–475. doi: 10.1016/s0959-4388(03)00097-7. [DOI] [PubMed] [Google Scholar]
- Mayer U, Küller A, Daiber PC, Neudorf I, Warnken U, Schnölzer M, Frings S, Möhrlen F. The proteome of rat olfactory sensory cilia. Proteomics. 2009;9:322–334. doi: 10.1002/pmic.200800149. [DOI] [PubMed] [Google Scholar]
- Menco BP. Ultrastructural aspects of olfactory signaling. Chem Senses. 1997;22:295–311. doi: 10.1093/chemse/22.3.295. [DOI] [PubMed] [Google Scholar]
- Menco BP, Bruch RC, Dau B, Danho W. Ultrastructural localization of olfactory transduction components: the G protein subunit Golfα and type III adenylyl cyclase. Neuron. 1992;8:441–453. doi: 10.1016/0896-6273(92)90272-f. [DOI] [PubMed] [Google Scholar]
- Menco BP, Tekula FD, Farbman AI, Danho W. Developmental expression of G-proteins and adenylyl cyclase in peripheral olfactory systems. Light microscopic and freeze-substitution electron microscopic immunocytochemistry. J Neurocytol. 1994;23:708–727. doi: 10.1007/BF01181645. [DOI] [PubMed] [Google Scholar]
- Menini A. Calcium signalling and regulation in olfactory neurons. Curr Opin Neurobiol. 1999;9:419–426. doi: 10.1016/S0959-4388(99)80063-4. [DOI] [PubMed] [Google Scholar]
- Menini A, Lagostena L, Boccaccio A. Olfaction: from odorant molecules to the olfactory cortex. News Physiol Sci. 2004;19:101–104. doi: 10.1152/nips.1507.2003. [DOI] [PubMed] [Google Scholar]
- Miledi R. A calcium-dependent transient outward current in Xenopus laevis oocytes. Proc R Soc Lond B Biol Sci. 1982;215:491–497. doi: 10.1098/rspb.1982.0056. [DOI] [PubMed] [Google Scholar]
- Perez-Cornejo P, De Santiago JA, Arreola J. Permeant anions control gating of calcium-dependent chloride channels. J Membr Biol. 2004;198:125–133. doi: 10.1007/s00232-004-0659-x. [DOI] [PubMed] [Google Scholar]
- Pifferi S, Boccaccio A, Menini A. Cyclic nucleotide-gated ion channels in sensory transduction. FEBS Lett. 2006a;580:2853–2859. doi: 10.1016/j.febslet.2006.03.086. [DOI] [PubMed] [Google Scholar]
- Pifferi S, Dibattista M, Menini A. TMEM16B induces chloride currents activated by calcium in mammalian cells. Pflugers Arch. 2009a;458:1023–1038. doi: 10.1007/s00424-009-0684-9. [DOI] [PubMed] [Google Scholar]
- Pifferi S, Dibattista M, Sagheddu C, Boccaccio A, Al Qteishat A, Ghirardi F, Tirindelli R, Menini A. Calcium-activated chloride currents in olfactory sensory neurons from mice lacking bestrophin-2. J Physiol. 2009b;587:4265–4279. doi: 10.1113/jphysiol.2009.176131. [DOI] [PMC free article] [PubMed] [Google Scholar]
- Pifferi S, Menini A, Kurahashi T. Signal transduction in vertebrate olfactory cilia. In: Menini A, editor. The Neurobiology of Olfaction. Boca Raton, FL: CRC Press, Taylor & Francis Group; 2009c. pp. 203–224. [PubMed] [Google Scholar]
- Pifferi S, Pascarella G, Boccaccio A, Mazzatenta A, Gustincich S, Menini A, Zucchelli S. Bestrophin-2 is a candidate calcium-activated chloride channel involved in olfactory transduction. Proc Natl Acad Sci U S A. 2006b;103:12929–12934. doi: 10.1073/pnas.0604505103. [DOI] [PMC free article] [PubMed] [Google Scholar]
- Qu Z, Hartzell HC. Anion permeation in Ca2+-activated Cl− channels. J Gen Physiol. 2000;116:825–844. doi: 10.1085/jgp.116.6.825. [DOI] [PMC free article] [PubMed] [Google Scholar]
- Rasche S, Toetter B, Adler J, Tschapek A, Doerner JF, Kurtenbach S, Hatt H, Meyer H, Warscheid B, Neuhaus EM. Tmem16b is specifically expressed in the cilia of olfactory sensory neurons. Chem Senses. 2010;35:239–245. doi: 10.1093/chemse/bjq007. [DOI] [PubMed] [Google Scholar]
- Reisert J, Bauer PJ, Yau K, Frings S. The Ca-activated Cl channel and its control in rat olfactory receptor neurons. J Gen Physiol. 2003;122:349–363. doi: 10.1085/jgp.200308888. [DOI] [PMC free article] [PubMed] [Google Scholar]
- Reisert J, Lai J, Yau K, Bradley J. Mechanism of the excitatory Cl− response in mouse olfactory receptor neurons. Neuron. 2005;45:553–561. doi: 10.1016/j.neuron.2005.01.012. [DOI] [PMC free article] [PubMed] [Google Scholar]
- Reuter D, Zierold K, Schröder WH, Frings S. A depolarizing chloride current contributes to chemoelectrical transduction in olfactory sensory neurons in situ. J Neurosci. 1998;18:6623–6630. doi: 10.1523/JNEUROSCI.18-17-06623.1998. [DOI] [PMC free article] [PubMed] [Google Scholar]
- Saidu SP, Stephan AB, Caraballo SM, Zhao H, Reisert J. Splice variants of the Ca2+-activated Cl− channel anoctamin 2. 2010. Association for Chemoreception Sciences Meeting 2010, abstract P68.
- Schild D, Restrepo D. Transduction mechanisms in vertebrate olfactory receptor cells. Physiol Rev. 1998;78:429–466. doi: 10.1152/physrev.1998.78.2.429. [DOI] [PubMed] [Google Scholar]
- Schneggenburger R, Ascher P. Coupling of permeation and gating in an NMDA-channel pore mutant. Neuron. 1997;18:167–177. doi: 10.1016/s0896-6273(01)80055-6. [DOI] [PubMed] [Google Scholar]
- Schroeder BC, Cheng T, Jan YN, Jan LY. Expression cloning of TMEM16A as a calcium-activated chloride channel subunit. Cell. 2008;134:1019–1029. doi: 10.1016/j.cell.2008.09.003. [DOI] [PMC free article] [PubMed] [Google Scholar]
- Stephan AB, Shum EY, Hirsh S, Cygnar KD, Reisert J, Zhao H. ANO2 is the cilial calcium-activated chloride channel that may mediate olfactory amplification. Proc Natl Acad Sci U S A. 2009;106:11776–11781. doi: 10.1073/pnas.0903304106. [DOI] [PMC free article] [PubMed] [Google Scholar]
- Stöhr H, Heisig JB, Benz PM, Schöberl S, Milenkovic VM, Strauss O, Aartsen WM, Wijnholds J, Weber BHF, Schulz HL. TMEM16B, a novel protein with calcium-dependent chloride channel activity, associates with a presynaptic protein complex in photoreceptor terminals. J Neurosci. 2009;29:6809–6818. doi: 10.1523/JNEUROSCI.5546-08.2009. [DOI] [PMC free article] [PubMed] [Google Scholar]
- Takeuchi H, Ishida H, Hikichi S, Kurahashi T. Mechanism of olfactory masking in the sensory cilia. J Gen Physiol. 2009;133:583–601. doi: 10.1085/jgp.200810085. [DOI] [PMC free article] [PubMed] [Google Scholar]
- Tirindelli R, Dibattista M, Pifferi S, Menini A. From pheromones to behavior. Physiol Rev. 2009;89:921–956. doi: 10.1152/physrev.00037.2008. [DOI] [PubMed] [Google Scholar]
- Yang YD, Cho H, Koo JY, Tak MH, Cho Y, Shim W, Park SP, Lee J, Lee B, Kim B, Raouf R, Shin YK, Oh U. TMEM16A confers receptor-activated calcium-dependent chloride conductance. Nature. 2008;455:1210–1215. doi: 10.1038/nature07313. [DOI] [PubMed] [Google Scholar]
- Yu T, McIntyre JC, Bose SC, Hardin D, Owen MC, McClintock TS. Differentially expressed transcripts from phenotypically identified olfactory sensory neurons. J Comp Neurol. 2005;483:251–262. doi: 10.1002/cne.20429. [DOI] [PMC free article] [PubMed] [Google Scholar]
- Zheng J, Sigworth FJ. Selectivity changes during activation of mutant Shaker potassium channels. J Gen Physiol. 1997;110:101–117. doi: 10.1085/jgp.110.2.101. [DOI] [PMC free article] [PubMed] [Google Scholar]