

Abstract
Ca2+ transients were activated in rabbit ventricular cells by a sequence of action potential shaped voltage clamps. After activating a series of control transients, Na+ currents (INa) were inactivated with a ramp from −80 to −40 mV (1.5 s) prior to the action potential clamp. The transients were detected with the calcium indicator Fluo-4 and an epifluorescence system. With zero Na+ in the pipette INa inactivation produced a decline in the SR Ca2+ release flux (measured as the maximum rate of rise of the transient) of 27 ± 4% (n = 9, P < 0.001) and a peak amplitude reduction of 10 ± 3% (n = 9, P < 0.05). With 5 mm Na+ in the pipette the reduction in release flux was greater (34 ± 4%, n = 4, P < 0.05). The ramp effectively inactivates INa without changing ICa, and there was no significant change in the transmembrane Ca2+ flux after the inactivation of INa. We next evoked action potentials under current clamp. TTX at 100 nm, which selectively blocks neuronal isoforms of Na+ channels, produced a decline in SR Ca2+ release flux of 35 ± 3% (n = 6, P < 0.001) and transient amplitude of 12 ± 2% (n = 6, P < 0.05). This effect was similar to the effect of INa inactivation on release flux. We conclude that a TTX-sensitive INa is essential for efficient triggering of SR Ca2+ release. We propose that neuronal Na+ channels residing within couplons activate sufficient reverse Na+–Ca2+ exchanger (NCX) to prime the junctional cleft with Ca2+. The results can be explained if non-linearities in excitation–contraction coupling mechanisms modify the coupling fidelity of ICa, which is known to be low at positive potentials.
Introduction
The microscopic theory of excitation–contraction coupling (ECC) in cardiomyocytes is organized around the concept of the couplon (Stern et al. 1997; Franzini-Armstrong et al. 1999), which is viewed as the functional unit that produces a Ca2+ spark. Within a single couplon, sarcolemmal L-type Ca2+ channels (LCCs) admit Ca2+ into a restricted junctional region (the diadic cleft), leading to a significant rise in Ca2+ concentration (Peskoff & Langer, 1998). This Ca2+ gates a cluster of ryanodine receptors (RyRs) on the apposing membrane of the junctional sarcoplasmic reticulum (SR), allowing Ca2+ release from the SR to generate a single Ca2+ spark. The spatial separation between couplons is sufficient to permit their local control (Stern, 1992), which explains the graded response of Ca2+ transients under voltage clamp by their voltage dependent stochastic recruitment. This embodies the classical ideas of Ca2+-induced Ca2+ release proposed by Fabiato (1983), as well as the original evidence by London & Krueger (1986) that Ca2+ currents (ICa) are responsible for triggering Ca2+ release from the terminal cisternae of the SR. Although it is widely held that ICa is the principal trigger for SR Ca2+ release in cardiac cells, there are studies suggesting that the Na+–Ca2+ exchanger (NCX) may also be involved in this process (Haworth et al. 1991; Nuss & Houser, 1992; Kohomoto et al. 1994; Levi et al. 1994b; Vites & Wasserstrom, 1996a,b; Wasserstrom & Vites, 1996; Litwin et al. 1998).
Recently Inoue & Bridge (2003) established in patch clamped rabbit ventricular myocytes that when action potentials (APs) are used to repetitively stimulate a cell, in those locations where sparks are present, they occur with a probability approaching 100%. This, despite (1) the inherent low open probability (Po) of LCCs, which is less than spark probability (Ps), and (2) their low coupling fidelity (PCpl) (Zhou et al. 1999; Polakova et al. 2008; Sobie & Ramay, 2009). Preliminary data show that when the magnitude of the trigger is increased spikes are not induced at new locations (Tsujii et al. 2005). This suggests that, at least in rabbit, APs activate all couplons. However SR Ca2+ release is graded with voltage clamp pulses from −40 to +50 mV by voltage-dependent local recruitment of Ca2+ sparks which are under local control (Lopez-Lopez et al. 1995). This indicates that unlike recruitment of couplons by an AP, recruitment by a voltage clamp is not 100% at many potentials including those corresponding to the peak of an AP. How can these apparently contradictory findings be resolved? The obvious difference between voltage clamp pulses from −40 mV and APs is that in the latter there is a Na+ current (INa). That the extent of triggering seems to differ in the presence and absence of INa requires explanation. Leblanc & Hume (1990) suggested that reversal of NCX by INa could trigger SR Ca2+ release directly. However, it is also plausible that in rabbit the main effect of NCX is to raise PCpl of the ICa by priming the junctional cleft with Ca2+. This would not require a large quantity of Ca2+ but could, in principle, produce a disproportionately large effect on triggering (see Discussion).
In view of these rather paradoxical results we used AP clamps both with and without a preceding ramp to inactivate INa to investigate two issues. First, the possibility that an INa makes a significant contribution to triggering SR Ca2+ release in rabbit ventricular cells by activating reverse NCX. Second, that this significant contribution originates from a modest reverse NCX. Finally, we investigated the hypothesis that a neuronal Na+ channel is responsible for mediating at least part of the foregoing effects in rabbit.
Methods
Isolation of rabbit ventricular myocytes
We isolated ventricular myocytes from adult New Zealand White rabbits (2.5 kg). The animals were anaesthetized with an intravenous administration of sodium pentobarbital (50 mg ml−1). The heart was quickly excised and the aorta cannulated. The cells were obtained by retrograde perfusion of the heart with Collagenase P (Roche) and protease XIV (Sigma) as previously described (Litwin et al. 1998). Following isolation, we stored the cells for up to 8 h in a 1 mm Ca2+-Hepes-buffered saline solution. All procedures were in accordance with the NIH Guide for the Care and Use of Laboratory Animals and animal protection guidelines of the University of Utah.
Electrophysiological recordings
We placed isolated myocytes in a recording chamber coated with mouse laminin (BD Biosciences, Franklin Lakes, NJ, USA) mounted on the stage of an inverted microscope (Nikon Diaphot, Nikon Instruments). The bath was continuously superfused with a modified Tyrode solution containing (in mm): 4.4 KCl, 138 NaCl, 1 MgCl2, 2 CaCl2, 11 dextrose, 24 Hepes, 0.5 probenecid (pH 7.4 adjusted with NaOH). Individual cells were voltage clamped (Axopatch 200; Molecular Devices, Sunnyvale, CA, USA) with a pipette of 1–2 MΩ resistance when filled with a solution containing (in mm): 128 KCl, 4.5 MgCl2, 5.5 dextrose, 10 Hepes, 0.02 EGTA, 5 K2ATP (pH 7.1 adjusted with KOH) (in some experiments 5 mm Na+ was added to this solution). An AP waveform template was first recorded from a cell under the conditions of interest and the stimulus artifact was removed by subtraction (Arreola et al. 1991; Bouchard et al. 1995; Grantham & Cannell, 1996). Five AP clamps were applied from a holding potential of −80 mV at a frequency of 0.2 Hz, followed by an AP waveform clamp with an initial voltage ramp from −80 to −40 mV (1.5 s) to inactivate the INa (Fig. 1A).
Figure 1. Effect of the INa inactivation on the Ca2+ transient.
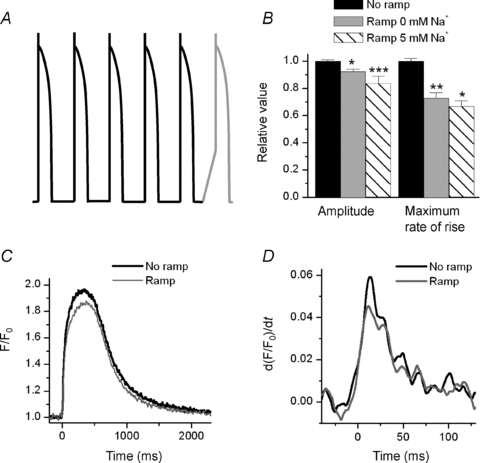
A, graphic representation of the voltage protocol used to record the associated transients. B, summary of the effect of the ramp on the amplitude and maximum rate of rise of the transient with two different dialysing [Na+] (0 and 5 mm). The relative values of the amplitude of the transients were: 90 ± 3% (0 mm Na+, n = 9) and 84 ± 5% (5 mm Na+, n = 4), and the values of the maximum rate of rise were 73 ± 4% (0 mm Na+, n = 9) and 67 ± 4% (5 mm Na+, n = 4). *P < 0.05, **P < 0.001, ***P < 0.07. C, representative Ca2+ transient obtained with 0 mm Na+ in the pipette when applying an AP waveform with and without a ramp. D, a 27% difference in a slope is easier to appreciate in the derivative of the signal. Thus, we show the derivative of the first 120 ms of the transients presented in (C).
We measured ICa using a pipette solution containing (in mm): 128 CsCl, 4.5 MgCl2, 5.5 dextrose, 10 Hepes, 5 BAPTA, 5 MgATP, 10 TEA-Cl (pH 7.2 adjusted with CsOH). After breaking into the cell, the external solution was replaced with a solution containing (in mm): 2 CaCl2, 4.4 CsCl, 128 TEA-Cl, 1 MgCl2, 11 dextrose, 24 Hepes, 0.5 probenecid (pH 7.4 adjusted with TEA-OH). ICa was measured with square clamp pulses generated by pCLAMP software or with AP waveform clamps, preceded by a ramp when necessary. ICa was calculated as the difference between the peak inward current and the value before the change in voltage. Background current was corrected using a solution containing 300 μm Cd2+ and 10 μm of nifedipine.
INa was measured using a pipette solution with the following composition (in mm): 120 CsCl, 4.5 MgCl2, 5.5 dextrose, 10 Hepes, 0.02 EGTA, 5 MgATP, 10 TEA-Cl (pH 7.2 adjusted with CsOH). After breaking into the cell, the external solution was replaced with a solution containing (in mm): 4.4 CsCl, 128 NaCl, 1 MgCl2, 11 dextrose, 24 Hepes, 0.5 probenecid (pH 7.4 adjusted with NaOH).
To measure the loss of voltage control during the AP clamp with a physiological [Na+]0, we recorded the membrane potential in the cell using discontinuous single-electrode voltage clamp (dSEVC, Axoclamp-2B, Molecular Devices). The external solution was the modified Tyrode solution, and the pipette was filled with the 0 mm Na+ pipette solution.
In the experiments with 100 nm TTX, APs were evoked at a frequency of 0.2 Hz with current steps delivered by an Axoclamp-2B operating in bridge mode. We recorded steady state APs before and after the application of 100 nm TTX, which blocks TTX-sensitive Na+ channels.
All experiments were performed at room temperature (22–24°C).
[Ca2+]i measurements
To record intracellular free Ca2+, we loaded the cells with 12.5 μm of fluo-4 AM (Molecular Probes/Invitrogen, Carlsbad, CA, USA) for 15 min at room temperature. Fluorescence transients were obtained in voltage clamped cells using a custom-designed epifluorescence system. We reported self-ratioed transients obtained after background subtraction. We calculated the maximum rate of rise of the transient, which provides a measurement of the release flux.
Expression of results and statistical analysis
All data are presented as means ±s.e.m. When comparing two conditions, we used Student's two-tailed unpaired t test. A P < 0.05 was considered to be significant.
Results
Inactivation of Na+ channels reduces the rate of rise and amplitude of the Ca2+ transient
To investigate the contribution of INa to the Ca2+ transient we compared transients evoked by an AP waveform before and after inactivating INa with a ramp. In each cell, we measured the average peak and maximum rate of rise of five transients and then compared these with the Ca2+ transient that was produced after inactivating INa with the ramp. We first established whether INa alone contributed to triggering Ca2+ release. To accomplish this we clamped a cell with zero Na+ in the pipette. Under these conditions inactivation of INa reduced the maximum rate of rise of the Ca2+ transient by 27 ± 4% (n = 9, P < 0.001) (Fig. 1C and D). Even with this large reduction of SR Ca2+ release flux, the peak amplitude of the transient was only diminished by 10 ± 3% (n = 9, P < 0.05). With 5 mm Na+ in the pipette, the reduction of the maximum rate of rise of Ca2+ released upon inactivation of INa was greater than the rise with no Na+ in the pipette (33 ± 4%, n = 4, P < 0.05) (Fig. 1B). There was little difference between the reduction in transient amplitude at the two [Na+]i after INa was inactivated (Fig. 1B). The slow phase of relaxation of the transients was not altered and the effect of the ramp on the AP waveform clamp was completely reversible in the majority of the cells. The inactivation of INa was sufficiently rapid that these results cannot be explained by changes in SR Ca2+ content. It appears therefore that INa is critically important for producing optimum SR Ca2+ release flux.
Inactivation of INa has a small effect on reducing transmembrane Ca2+ flux
We used the same voltage clamp protocols to investigate the effect of inactivation of INa on transmembrane Ca2+ flux in the absence of SR function. For these experiments, we depleted SR Ca2+ by incubating the cells in 1 μm of thapsigargin and 1 μm ryanodine for 30 min. The cells exhibited a slower maximum rate of rise and a prolonged time to peak of the Ca2+ transient, as well as a prolonged time constants of Ca2+ decline when compared with control solution (0.009 ± 0.005 vs. 0.009 ± 0.001, 380 ± 2 vs. 264 ± 9 ms, and 486 ± 19 vs. 1252 ± 55 ms respectively). These findings are in agreement with others (Lewartowski et al. 1994). We assumed that, at least in part, this transmembrane flux can trigger SR Ca2+ release. We found that in the absence of internal Na+, regardless of whether or not INa is inactivated, the transients are virtually superimposable (Fig. 2A). Moreover, the maximum rate of rise of the Ca2+ transient is almost identical in both cases (Fig. 2B). With INa inactivated the maximum rate of rise was 97 ± 2% (n = 3, P > 0.05) of the control value. We infer that any reverse NCX flux activated by INa is extremely small when compared with the movement of Ca2+ across the membrane through LCCs. This suggests that a very small NCX flux in conjunction with the Ca2+ flux through LCCs can significantly affect triggering. This latter effect is consistent with the findings of others that isolated NCX is a small and rather ineffective trigger (Sipido et al. 1997) unless [Na+]i is extremely high (Kohomoto et al. 1994). When we repeated this experiment with a more physiological [Na+] in the pipette (Levi et al. 1994a) (5 mm) we observed only modest differences in transmembrane flux with or without inactivated INa (Fig. 2C). In the absence of INa the maximum rate of rise of the transient and its amplitude were only slightly smaller than the control (94 ± 2%, n = 4, P < 0.1 and 93 ± 3%, n = 4, P > 0.05 respectively). Thus, an extremely small difference in transmembrane Ca2+ flux (cause by INa inactivation) must explain a significantly larger difference in SR Ca2+ release flux. We believe that this is a consequence of the structure of couplons, a topic we will fully discuss later.
Figure 2. Effect of the inactivation of INa on transmembrane Ca2+ flux.
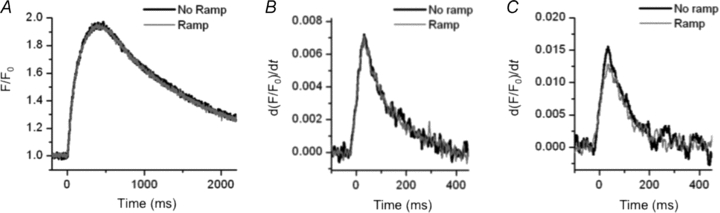
A and B, when we used 1 μm thapsigargin and 1 μm ryanodine to disable SR Ca2+ content, the Ca2+ transient (A) and its maximum rate of rise (B) (a measurement of transmembrane Ca2+ flux) obtained in both conditions (with and without the ramp) were virtually identical with 0 mm Na+ in the pipette. C, with 5 mm Na+ in the pipette, the maximum rate of rise of the transients was slightly smaller than in control condition (94 ± 2%, n = 4, P < 0.1) (only the derivative of the Ca2+ transient is shown). Note that in both dialysing [Na+] the peak of the derivative of F/F0 is smaller and occurred at later times when compared to a transient with the SR intact (Fig. 1D).
The ramp that precedes the AP waveform clamp effectively inactivates INa
To ensure that INa was inactivated after the ramp, we recorded the inward current generated with an AP waveform clamp. To prevent Ca2+ and K+ currents from interfering with our measurements, we removed them from the solutions. It is well known that during an AP waveform clamp INa cannot be controlled; therefore we cannot reliably measure its kinetics. However, we can establish whether or not INa is inactivated. Our results indicated that this ramp preceding the AP clamp does completely inactivate INa (Fig. 3A). It is possible that an undetectable INa was still present; however, if this was the case it is unlikely to contribute to the trigger. Since it is important that during the AP waveform clamp there is no significant loss of voltage control, we used dSEVC to demonstrate the extent to which we maintained voltage control while applying an AP waveform. To illustrate how severe loss of control can be when attempting to clamp INa, we depolarized the cell with a step pulse from a holding potential of −80 mV to −40 mV (the voltage in which INa reaches its peak value). With this step pulse we initially lost all voltage control, as expected (Fig. 3B). When we applied the AP waveform, the loss of control was dramatically reduced, and was confined to the first few milliseconds of the AP (Fig. 3C). The peak of the AP was hardly affected. Moreover, the form of the APs was similar with and without ramps, and therefore with and without INa (Fig. 3D). This suggests that there is a relatively small loss of voltage control during the peak of the AP waveform clamp. This is presumably because the peak of the AP corresponds closely to the reverse potential of INa. Although we cannot measure the kinetics of INa, it seems unlikely that during an AP clamp the amplitude of INa is greatly altered.
Figure 3. Effect of the ramp on INa and voltage control during a voltage clamp with normal [Na+]o.
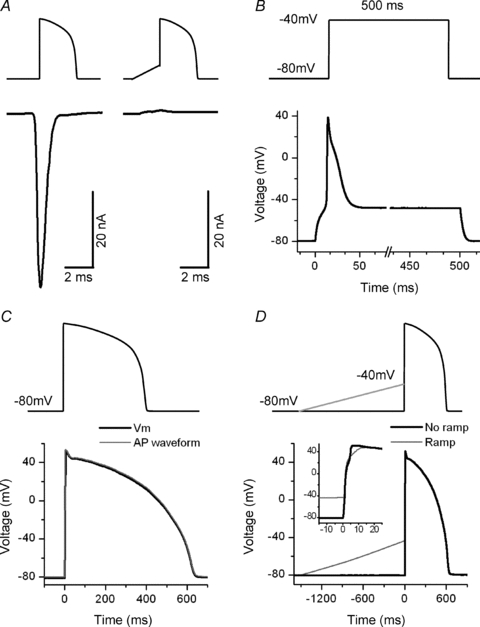
A, graphic representation of the voltage protocol used (upper traces) and representative INa traces (lower traces) evoked by an AP waveform clamp with (left) and without (right) the ramp preceding it. The ramp inactivates INa. This result was obtained in 8 cells. B, record of the membrane voltage while imposing a step pulse from a holding potential of −80 mV to −40 mV. As expected, initially there was a complete loss of voltage control. C, record of the membrane voltage while imposing an AP waveform clamp. The loss of control was reduced and was confined to the first few milliseconds of the AP. D, representative traces of the APs recorded while imposing AP waveform clamps with and without a ramp. The forms of the APs were similar in both conditions.
The ramp that precedes the AP waveform clamp does not affect ICa
The ramp that we used to inactivate INa could also influence ICa, which might, in turn, change the characteristics of the Ca2+ transient. For example, if ICa is present between −80 and −40 mV and is partially inactivated during the ramp, this could reduce the release flux by reducing Ca2+ triggering. We therefore investigated ICa with voltage clamp steps in 10 mV increments from −80 to +70 mV. For these experiments we replace K+ with Cs+, and Na+ with TEA-Cl in the bath and internal solution. We could not detect activation of ICa between −80 and −40 mV (n = 7 cells) (Fig. 4A). These data are in agreement with other studies that at least partially cover this range of voltage (Osaka & Joyner, 1991; Yuan et al. 1996). To demonstrate that ICa is not affected by the ramp, we also measured ICa during a series of 10 mV steps from a holding potential of −80 mV to +70 mV, with and without ramps imposed prior to each step. To avoid ICa rundown we applied the protocol displayed in Fig. 4B, top panel. After calculating the average ICa under the two conditions, we found no difference in the ICa density–voltage relationship with and without the ramp (n = 8 cells) (Fig. 4B, lower panel). Finally, we measured ICa during an AP waveform clamp with and without a ramp. There was no significant difference in the peak, time to peak or inactivation of ICa under the two conditions (n = 9 cells) (Fig. 4C). Note that the ICa we obtained has the shape that is usually associated with an AP waveform clamp (Arreola et al. 1991; Grantham & Cannell, 1996). Therefore it seems that there is a genuine effect of INa inactivation on the release flux that is not related to a modification of ICa.
Figure 4. Effect of the ramp on ICa.
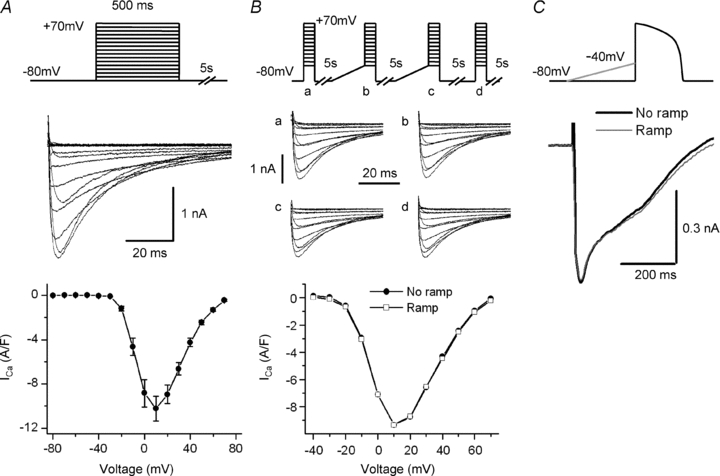
A, representative ICa (middle panel) evoked by the applied protocol (upper panel). In the lower panel the average current density–voltage relationship between −80 and +70 mV is shown. There was no detectable ICa activation over the range of voltage covered by the ramp (−80 to −40 mV). Symbols represent means ±s.e.m. for 6 cells. B, representative ICa (middle panel) evoked by voltage steps in each of the sections (a–d) of the applied protocol (upper panel). In the lower panels are the representative current density–voltage relationships with ramps (empty squares) and without ramps (filled circles). We found no difference in the ICa density–voltage relationships under the two conditions. C, ICa recordings during an AP waveform clamp with ramp (grey) and without ramp (black). There is no difference in the traces obtained under both conditions.
The effect of 100 nm TTX on SR Ca2+ release is similar to the effect of inactivating INa
We tested the effect of 100 nm TTX on the Ca2+ transient. It is known that neuronal Na+ channels (e.g. Nav1.1, Nav1.2, Nav1.3 and Nav1.6) are inhibited by nanomolar concentrations of TTX (Goldin, 2001; Catterall et al. 2005). Indeed, 100 nm TTX provides a way of defining the existence of these channels, which have been identified in heart in different species (Rogart et al. 1989; Haufe et al. 2005). The heart isoform Nav1.5 is, however, not affected by this concentration of TTX (Cribbs et al. 1990; Goldin, 2001; Catterall et al. 2005). We evoked APs with current pulses and recorded these and the transients that they produced in both control and 100 nm TTX. Initially, the APs in both conditions were identical. As with the ramp, neuronal INa inactivation by 100 nm TTX produced a similar though somewhat larger decline in both the maximum rate of rise and the amplitude of the Ca2+ transient (reduction by 35 ± 3%, n = 6, P < 0.001 and by 12 ± 2%, n = 6, P < 0.05 respectively) (Fig. 5A and B). This suggests that neuronal Na+ channels influence SR Ca2+ release. After continued APs in the presence of 100 nm TTX, in the three cells in which the transient did not deteriorate, there was a further reduction in peak amplitude and in release flux, which were subsequently restored to some extent (Fig. 5C). We will discuss this later. However, it appears consistent with the homeostatic mechanisms that control SR Ca2+ content and release. These mechanisms have been extensively investigated and described elsewhere (Diaz et al. 2005).
Figure 5. Effect of 100 nm TTX on the Ca2+ transient.
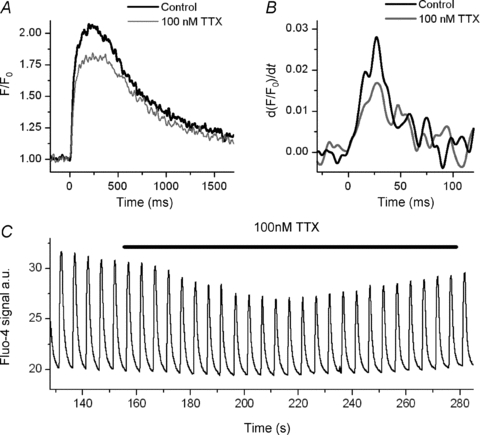
A, representative trace of Ca2+ transients during evoked APs in control Tyrode solution and in presence of 100 nm TTX. With 0 mm Na+ in the pipette, the effect of 100 nm TTX is comparable to the effect of inactivation of INa. B, derivative of the first 120 ms of the transient presented in A. C, a sequence of Ca2+ transients. In 100 nm TTX, there is an initial decline and a subsequently partial restoration of transient amplitude.
Discussion
Controversy surrounds the question of whether or not reverse Na+–Ca2+ exchange activated by INa makes a contribution to the trigger mechanism (Leblanc & Hume, 1990; Sipido et al. 1995). Nevertheless several reports have supported this hypothesis. The first clear demonstration of NCX involvement in triggering by Nuss & Houser (1992) indicated that when intracellular Na+ was high in voltage clamped isolated ventricular cells the magnitude of the Ca2+ transient was higher at positive potentials than one could attribute to triggering by ICa alone. These authors therefore suggested that reverse mode NCX could contribute to triggering SR Ca2+ release. Other investigators showed that when voltage clamped ventricular myocytes were dialysed with 20 mm Na+, in the presence of a Ca2+ channel blocker transients or shortening were far larger than one could expect from the residual ICa, again suggesting the involvement of NCX in triggering (Kohomoto et al. 1994). Additional studies obtained by a number of authors further suggested that NCX could be involved in triggering SR Ca2+ release (Haworth et al. 1991; Nuss & Houser, 1992; Kohomoto et al. 1994; Levi et al. 1994b; Vites & Wasserstrom, 1996a,b; Wasserstrom & Vites, 1996; Litwin et al. 1998; Sobie et al. 2008). Under voltage clamp exchange current is quite small even at positive potentials but makes what appears to be a significant contribution to triggering. To explain this, Litwin et al. (1998) proposed that NCX acted synergistically with the ICa. Recently Sobie et al. (2008) proposed an explanation for this synergism by suggesting that ICa could activate the regulatory site on the exchanger, which would increase its activity and therefore explain its significant contribution to triggering. While this indicates that reverse NCX can function as a trigger, it provides little information on whether or not during an action potential with normal cellular Na+, triggering by reverse NCX is significant. This issue was further clouded by the finding of Sipido et al. (1997) that in the absence of INa the exchanger produced little triggering or did so very slowly. This led to the view that NCX was unimportant in triggering (Bers et al. 1990; Lopez-Lopez et al. 1995; Sipido et al. 1997). These authors did not take into consideration the possibility that the ICa and NCX could sum their effects in a non-linear fashion. Weber et al. (2003) have suggested that exchange cannot function as a trigger because entry of ICa into a restricted domain would prevent the exchanger from reversing. However, we must consider the possibility that during the 4 ms or so required for triggering, early exchange activity could prime a restricted domain with Ca2+ prior to activation of ICa (Cannell & Soeller, 1997). Weber et al. considered the effect of INa on the exchanger 5 ms after its activation. It is likely that this is far too late to draw any useful conclusions.
There are far fewer studies designed to test the involvement of INa in ECC. Leblanc & Hume (1990) produced the first evidence (although the result has been controversial) that an INa could produce reverse NCX that would contribute significantly to triggering. Additional voltage clamp experiments by Lipp & Niggli (1994) supported this result, but experiments by Sipido et al. (1995) dampened enthusiasm for this hypothesis. More recently, other investigators have obtained evidence that a TTX-sensitive neuronal INa could be involved in the triggering process (Maier et al. 2002; Lines et al. 2006). This too has proved controversial. For example, Brette & Orchard (2006) found that while in rat ventricular cells contained TTX-sensitive Na+ channels, blockade of these did not affect SR Ca2+ release. Thus it seems clear that the mechanism that triggers SR Ca2+ release in ventricular cells is incompletely understood.
In view of these rather contradictory results we undertook a study to determine the contribution of INa to triggering SR Ca2+ release in rabbit ventricular cells. We adopted an approach that has not been attempted before. We measured SR Ca2+ released during AP shaped voltage clamps with and without voltage-dependent inactivation of INa. Inactivation of INa in such a way that SR content is unaffected produced a significant decline in SR Ca2+ release flux (Fig. 1). In addition, we found that a similar decline in release flux was produced by low doses of TTX (Fig. 5A and B), thus implicating the involvement of a neuronal (TTX-sensitive) Na+ channel in ECC. Some of these results are supported by a study in mice (Larbig et al. 2010) indicating that inactivation of INa, while significantly reducing SR Ca2+ release flux in wild-type mice, has no effect on release flux in cardiac specific NCX knock-out mice.
We employed AP shaped voltage clamps to investigate the effect of inactivating INa on SR Ca2+ release because these are more likely to represent ECC under ‘physiological’ conditions. We inactivated INa with a ramp because the significant loss of voltage control during a square pulse (Fig. 3B) can activate ICa (data not shown) and confound the interpretation of our results. Control is also lost on the upstroke of the AP, and for this reason even when other currents are removed we cannot reliably measure the time course of INa because the measurement would be distorted. However we can decide whether or not INa is present or absent after inactivation (Fig. 3A), which is what is required if we are to draw conclusions about the contribution of the INa to ECC. We should be clear that during our AP clamps the amplitude of INa is unlikely to be significantly distorted. It is our ability to measure its kinetics that is compromised. There appears to be no difference in the ICa density–voltage relationship obtained with square voltage clamp pulses from −80 or −40 mV to +70 mV (Fig. 4B), provided the voltage pulses from −40 mV were preceded by a ramp. We were also able to demonstrate that no ICa is generated between −80 and −40 mV (Fig. 4A) and that the ramp does not alter the ICa when measured with an AP clamp (Fig. 4C).
It is clear that in the absence of INa the SR Ca2+ release flux is significantly reduced. This result was obtained with no Na+ in the pipette. Since we assumed that intracellular Na+ is very low, the result indicates that it is the INa alone that can produce a sufficient Na+ accumulation in the vicinity of the NCX to promote its reversal and contribute to triggering release flux. As one may expect, with 5 mm Na+ in the pipette the loss of release flux is increased. It is perhaps surprising in view of the large alterations in release flux that the peak of the Ca2+ transient is only 10% smaller than when the INa is inactivated. These experiments were conducted at room temperature so the APs were prolonged. Presumably when the AP is prolonged, the transient is also prolonged until NCX contributes to its reduction. It is likely that at physiological temperatures the shorter AP will terminate the release flux earlier. In the mouse where APs repolarize early, the peak of the Ca2+ transient is much smaller after inactivation of INa (Larbig et al. 2010). Although these results were produced by a different approach to that used by Leblanc & Hume (1990) they still are consistent with their results. Moreover, the result is qualitatively similar to that obtained by Larbig et al. (2010) who showed that inactivation of INa in wild-type mice also led to a significant reduction in release flux.
By eliminating the contribution of the SR to Ca2+ release we could measure the transmembrane Ca2+ flux as the maximum rate of rise of the Ca2+ transient. This is clearly displayed in plots of the derivative of the time course of the Ca2+ transient (Fig. 2B and C). There is no observable difference in this flux in the presence or absence of INa. We infer from this that the NCX contributes very little during an AP to the total transmembrane Ca2+ flux, which we assume is largely mediated by Ca2+ flux through LCCs. We cannot conclude that this is also true locally in couplons because we do not know the ratio of NCX to LCCs in these structures. However, without evidence to the contrary, we assume that the extent of NCX mediated transmembrane Ca2+ flux is smaller than that mediated by LCCs in couplons. Since the junction is extremely small this does not preclude the possibility that a very small reverse NCX will produce a significant increase in junctional Ca2+. Despite this, triggering by NCX in isolation is insufficient for significant triggering (Sipido et al. 1997).
It therefore appears that we confront a paradox. On the one hand NCX stimulated by INa is likely to be very small, but on the other hand, its effect on triggering is large. This must stem from non-linear processes that exist in the ECC mechanism. We will attempt to provide a resolution to this paradox. However before discussing a mechanism that can explain this non-linearity we must first consider some properties of the coupling fidelity (PCpl) of ICa. PCpl is defined as the ‘the ratio of the number of L-type channel openings to the number of Ca2+ sparks activated’ (Zhou et al. 1999). We could also define this quantity as the probability that ICa will activate one or a cluster of RyRs in a couplon. For any given channel there will be a distribution of PCpl that will depend upon, among other things, the open time distribution of the channel. Recently Polakova et al. (2008) have demonstrated that in rats this quantity must be small, for example around 0.15 at −80 mV (see their Fig. 5). This quantity tends to become even smaller at positive potentials (Sobie & Ramay, 2009). We assume without evidence to the contrary that this is also true in rabbits. To explain the high probability of couplon activation in rats after repolarization to negative potentials, Polakova et al. (2008) deduced that in rats there would have to be a substantial number of LCCs available for triggering. We will present an alternative to this to explain the high probability of couplon activation in rabbits although this does not rule out the possibility that numerous DHPRs must be available for couplon activation in rabbit.
We can write the following equation derived by Polakova et al. (2008):
| (1) |
where Ps is the probability that any DHPR opening activates a spark, nDHPR is the total number of DHPRs in a couplon and Po is the DHPR open probability. This equation does not for example describe the way that PCpl could depend on voltage, or take into consideration the effect of sequential openings of DHPRs on couplon activation. However, it is useful to illustrate a possible mechanism that can explain our result. During an AP in rabbits, couplons are activated with a probability of 1. If the maximum transient that we observe represents a Ps of roughly 1, then removing INa reduces Ps to 0.7. It is unlikely that removing INa will reduce nDHPR or Po. We need to account for an approximately 30% change of SR release flux and hence of Ps simply as a result of removing INa and presumably reverse exchange. Therefore we propose that PCpl is modified. How can this occur? If priming the dyadic cleft with Ca2+ increases PCpl this would explain why removing the priming by elimination of reverse exchange could reduce PCpl and therefore Ps and the SR release flux as observed. Neuronal Na+ channels which, as our results suggest seem to be involved in ECC in rabbit, activate rapidly (Fozzard & Hanck, 1996). With a sufficient number of these we hypothesize that early during an AP Na+ is significantly elevated in the junctional region, which is very small. We suggest that this takes place before ICa is activated. We assume, as have others, that this Na+ causes reversal of NCX, which must also elevate Ca2+ significantly in the junction prior to activation of one or a number of available DHPRs. At least in rat, 27% of NCX molecules co-localized with RyRs (Jayasinghe et al. 2009). Even with fewer NCX molecules per couplon in rabbits, this might be sufficient to prime the diadic cleft prior to activation of available DHPRs. We know that the relationship between RyR open probability (PRyR) and Ca2+ in the cleft is sigmoid (Copello et al. 1997). This could be one source of the non-linearity that is required to increase PCpl so that NCX sums in a non-linear fashion with ICa to produce triggering. The early priming of the junction with Ca2+ may for example move Ca2+ concentration along the foot of this sigmoid curve without significantly increasing PRyR. Any subsequent ICa will then further increase junctional Ca2+ in a concentration range where it is steeply related to PRyR. If the junction had not first been primed with Ca2+, the ICa would be required to supply additional Ca2+ to bring its value in the cleft to a point on the sigmoid curve where it is steeply related PRyR. This will increase the likelihood that a DHPR opening will activate a RyR, i.e. it will increase PCpl. Thus junctional priming by reverse NCX could in principle increase PCpl sufficiently to account for at least 30% of the release flux. At this stage it is only possible to propose this as a plausible mechanism in which NCX sums in a non-linear fashion with ICa to modulate Ps. We require extensive modelling and additional information on the number of neuronal Na+ channels, DHPRs and NCX molecules in a couplon, and their localization within the couplon to extend our investigations.
There have been contradictory reports on whether or not neuronal Na+ currents are involved in triggering by reverse NCX (Maier et al. 2002; Brette & Orchard, 2006; Lines et al. 2006). We therefore tested the effect of 100 nm TTX on SR Ca2+ release in rabbit ventricular cells. TTX at 100 nm blocks neuronal Na+ channels without affecting cardiac Na+ channels. The IC50 for neuronal Na+ channels is around 10 nm depending on species and isoform, while for Nav1.5 (cardiac Na+ channel) it is in the micromolar range (Cribbs et al. 1990; Goldin, 2001; Catterall et al. 2005). We applied 100 nm TTX to a ventricular cell in which we evoked an AP while the cell was dialysed with a pipette containing no Na+. The cell interior was therefore nominally Na+ free. However, since Nav1.5 was not blocked Na+ continued to enter the cell with each AP. We therefore do not know exactly what the internal [Na+] was, but we speculate that is probably quite low. The effect of applying 100 nm TTX was a decline of approximately 35% in release flux. This value is similar to the effect of inactivating INa. We conclude that the decline in release flux is attributable to the blockade of a neuronal TTX-sensitive Na+ channels. The result is consistent with work by Maier et al. on Guinea pigs, and Lines et al. who worked on rats but is inconsistent with the results of Brette and Orchard who also worked on rats (Brette & Orchard, 2006). We have no explanation for this discrepancy. However we infer that at least in rabbit a neuronal INa activates a small reverse exchange, which produces a large effect on release. Our experiments with AP voltage clamp only inform us that a INa is involved in some manner in triggering SR Ca2+ release. Our result with TTX suggests that one of these currents is one or several isoforms of the neuronal INa. However, a large part of the cardiac INa is mediated by Nav1.5. Although we have argued that neuronal Na+ channels are important in triggering SR Ca2+ release, this does not exclude the possibility that there is a significant contribution from Nav1.5 to this process. There are a number of mechanisms by which Nav1.5 could influence triggering, e.g. setting the level of cytosolic Na+. Our results (see Fig. 1B) suggest the concentration of dialysing Na+ influences the extent to which inactivation of INa reduces SR Ca2+ release. Before we can understand the contribution of various types of INa on triggering we need more information on, for example, the cellular distribution of Na+ channels.
The response of the Ca2+ transient to TTX is biphasic. There is a secondary increase in release flux after application of TTX (Fig. 5C) which can be explained in terms of theories of Ca2+ homeostasis developed by others (Diaz et al. 2005). If the initial effect of TTX is to reduce release flux then NCX will extrude less Ca2+ from the cell by forward NCX. However, because reverse NCX is likely to be small Ca2+ influx is slightly affected. Thus, after TTX treatment we expect influx into to exceed efflux out of the cell. This means that the Ca2+ content of the cell will increase, which will tend to increase SR content until the release flux is sufficient to produce a forward exchange that results in efflux balancing influx. This can explain the biphasic effect of TTX.
In summary, we proposed that a rapidly activated neuronal Na+ channel causes immediate reverse of NCX, which primes the junctional cleft with Ca2+ and increases the PCpl of the ICa. We believe that an attractive feature of our proposal is that during the diastolic interval coupling fidelity is low. Any spontaneous openings of LCC are unlikely to activate couplons at times when this might be deleterious. The coupling fidelity of ICa would only be elevated early during the AP. Our results, together with those of Larbig et al. (2010), support the idea that in at least two species (mouse and rabbit) a INa is an essential part of the trigger mechanism in ECC.
Acknowledgments
The Nora Eccles Treadwell Foundation, and NIH research grants HL62690 and HL70828 supported this work. We thank Dr Ken Spitzer and Dr Noriko Saegusa for their technical help and advice.
Glossary
Abbreviations
- AP
action potential
- DHPR
dihydropyridine receptor
- ECC
excitation–contraction coupling
- ICa
L-type Ca2+ current
- INa
Na+ current
- LCC
L-type Ca2+ channel
- dSEVC
discontinuous single electrode voltage clamp
- NCX
Na+–Ca2+ exchanger
- nDHPR
number of DHPRs
- PCpl
coupling fidelity
- Po
open probability
- PRyR
RyR open probability
- Ps
probability of spark occurrence
- RyR
ryanodine receptor
- SR
sarcoplasmic reticulum
Author contribution
N.T., J.B.: conception and design of experiments; N.T., A.R., R.L., J.G., J.B.: collection, analysis, and interpretation of data; N.T., A.R., J.G., J.B.: drafting the article or revising it critically for important intellectual content. All authors approved the final manuscript. The experiments were conducted at the University of Utah.
References
- Arreola J, Dirksen RT, Shieh RC, Williford DJ, Sheu SS. Ca2+ current and Ca2+ transients under action potential clamp in guinea pig ventricular myocytes. Am J Physiol Cell Physiol. 1991;261:C393–397. doi: 10.1152/ajpcell.1991.261.2.C393. [DOI] [PubMed] [Google Scholar]
- Bers DM, Lederer WJ, Berlin JR. Intracellular Ca transients in rat cardiac myocytes: role of Na-Ca exchange in excitation-contraction coupling. Am J Physiol Cell Physiol. 1990;258:C944–954. doi: 10.1152/ajpcell.1990.258.5.C944. [DOI] [PubMed] [Google Scholar]
- Bouchard RA, Clark RB, Giles WR. Effects of action potential duration on excitation-contraction coupling in rat ventricular myocytesAction potential voltage-clamp measurements. Circ Res. 1995;76:790–801. doi: 10.1161/01.res.76.5.790. [DOI] [PubMed] [Google Scholar]
- Brette F, Orchard CH. No apparent requirement for neuronal sodium channels in excitation-contraction coupling in rat ventricular myocytes. Circ Res. 2006;98:667–674. doi: 10.1161/01.RES.0000209963.02720.70. [DOI] [PubMed] [Google Scholar]
- Cannell MB, Soeller C. Numerical analysis of ryanodine receptor activation by L-type channel activity in the cardiac muscle diad. Biophys J. 1997;73:112–122. doi: 10.1016/S0006-3495(97)78052-4. [DOI] [PMC free article] [PubMed] [Google Scholar]
- Catterall WA, Goldin AL, Waxman SG. International Union of Pharmacology. XLVII. Nomenclature and structure-function relationships of voltage-gated sodium channels. Pharmacol Rev. 2005;57:397–409. doi: 10.1124/pr.57.4.4. [DOI] [PubMed] [Google Scholar]
- Copello JA, Barg S, Onoue H, Fleischer S. Heterogeneity of Ca2+ gating of skeletal muscle and cardiac ryanodine receptors. Biophys J. 1997;73:141–156. doi: 10.1016/S0006-3495(97)78055-X. [DOI] [PMC free article] [PubMed] [Google Scholar]
- Cribbs LL, Satin J, Fozzard HA, Rogart RB. Functional expression of the rat heart I Na+ channel isoform. Demonstration of properties characteristic of native cardiac Na+ channels. FEBS Lett. 1990;275:195–200. doi: 10.1016/0014-5793(90)81470-9. [DOI] [PubMed] [Google Scholar]
- Diaz ME, Graham HK, O’Neill SC, Trafford AW, Eisner DA. The control of sarcoplasmic reticulum Ca content in cardiac muscle. Cell Calcium. 2005;38:391–396. doi: 10.1016/j.ceca.2005.06.017. [DOI] [PubMed] [Google Scholar]
- Fabiato A. Calcium-induced release of calcium from the cardiac sarcoplasmic reticulum. Am J Physiol Cell Physiol. 1983;245:C1–14. doi: 10.1152/ajpcell.1983.245.1.C1. [DOI] [PubMed] [Google Scholar]
- Fozzard HA, Hanck DA. Structure and function of voltage-dependent sodium channels: comparison of brain II and cardiac isoforms. Physiol Rev. 1996;76:887–926. doi: 10.1152/physrev.1996.76.3.887. [DOI] [PubMed] [Google Scholar]
- Franzini-Armstrong C, Protasi F, Ramesh V. Shape, size, and distribution of Ca2+ release units and couplons in skeletal and cardiac muscles. Biophys J. 1999;77:1528–1539. doi: 10.1016/S0006-3495(99)77000-1. [DOI] [PMC free article] [PubMed] [Google Scholar]
- Goldin AL. Resurgence of sodium channel research. Annu Rev Physiol. 2001;63:871–894. doi: 10.1146/annurev.physiol.63.1.871. [DOI] [PubMed] [Google Scholar]
- Grantham CJ, Cannell MB. Ca2+ influx during the cardiac action potential in guinea pig ventricular myocytes. Circ Res. 1996;79:194–200. doi: 10.1161/01.res.79.2.194. [DOI] [PubMed] [Google Scholar]
- Haufe V, Cordeiro JM, Zimmer T, Wu YS, Schiccitano S, Benndorf K, Dumaine R. Contribution of neuronal sodium channels to the cardiac fast sodium current INa is greater in dog heart Purkinje fibers than in ventricles. Cardiovasc Res. 2005;65:117–127. doi: 10.1016/j.cardiores.2004.08.017. [DOI] [PubMed] [Google Scholar]
- Haworth RA, Goknur AB, Hunter DR. Control of the Na-Ca exchanger in isolated heart cells. I. Induction of Na-Na exchange in sodium-loaded cells by intracellular calcium. Circ Res. 1991;69:1506–1513. doi: 10.1161/01.res.69.6.1506. [DOI] [PubMed] [Google Scholar]
- Inoue M, Bridge JHB. Ca2+ sparks in rabbit ventricular myocytes evoked by action potentials: involvement of clusters of L-type Ca2+ channels. Circ Res. 2003;92:532–538. doi: 10.1161/01.RES.0000064175.70693.EC. [DOI] [PubMed] [Google Scholar]
- Jayasinghe ID, Cannell MB, Soeller C. Organization of ryanodine receptors, transverse tubules, and sodium-calcium exchanger in rat myocytes. Biophys J. 2009;97:2664–2673. doi: 10.1016/j.bpj.2009.08.036. [DOI] [PMC free article] [PubMed] [Google Scholar]
- Kohomoto O, Levi AJ, Bridge JH. Relation between reverse sodium-calcium exchange and sarcoplasmic reticulum calcium release in guinea pig ventricular cells. Circ Res. 1994;74:550–554. doi: 10.1161/01.res.74.3.550. [DOI] [PubMed] [Google Scholar]
- Larbig R, Torres N, Bridge JH, Goldhaber JI, Philipson KD. Activation of reverse Na+-Ca2+ exchange by the Na+ current augments the cardiac Ca2+ transient: Evidence from NCX knockout mice. J Physiol. 2010;588:3267–3276. doi: 10.1113/jphysiol.2010.187708. [DOI] [PMC free article] [PubMed] [Google Scholar]
- Leblanc N, Hume JR. Sodium current-induced release of calcium from cardiac sarcoplasmic reticulum. Science. 1990;248:372–376. doi: 10.1126/science.2158146. [DOI] [PubMed] [Google Scholar]
- Levi AJ, Lee CO, Brooksby P. Properties of the fluorescent sodium indicator “SBFI” in rat and rabbit cardiac myocytes. J Cardiovasc Electrophysiol. 1994a;5:241–257. doi: 10.1111/j.1540-8167.1994.tb01161.x. [DOI] [PubMed] [Google Scholar]
- Levi AJ, Spitzer KW, Kohmoto O, Bridge JH. Depolarization-induced Ca entry via Na-Ca exchange triggers SR release in guinea pig cardiac myocytes. Am J Physiol Heart Circ Physiol. 1994b;266:H1422–1433. doi: 10.1152/ajpheart.1994.266.4.H1422. [DOI] [PubMed] [Google Scholar]
- Lewartowski B, Rozycka M, Janiak R. Effects of thapsigargin in normal and pretreated with ryanodine guinea pig cardiomyocytes. Am J Physiol Heart Circ Physiol. 1994;266:H1829–1839. doi: 10.1152/ajpheart.1994.266.5.H1829. [DOI] [PubMed] [Google Scholar]
- Lines GT, Sande JB, Louch WE, Mork HK, Grottum P, Sejersted OM. Contribution of the Na+/Ca2+ exchanger to rapid Ca2+ release in cardiomyocytes. Biophys J. 2006;91:779–792. doi: 10.1529/biophysj.105.072447. [DOI] [PMC free article] [PubMed] [Google Scholar]
- Lipp P, Niggli E. Sodium current-induced calcium signals in isolated guinea-pig ventricular myocytes. J Physiol. 1994;474:439–446. doi: 10.1113/jphysiol.1994.sp020035. [DOI] [PMC free article] [PubMed] [Google Scholar]
- Litwin SE, Li J, Bridge JH. Na-Ca exchange and the trigger for sarcoplasmic reticulum Ca release: studies in adult rabbit ventricular myocytes. Biophys J. 1998;75:359–371. doi: 10.1016/S0006-3495(98)77520-4. [DOI] [PMC free article] [PubMed] [Google Scholar]
- London B, Krueger JW. Contraction in voltage-clamped, internally perfused single heart cells. J Gen Physiol. 1986;88:475–505. doi: 10.1085/jgp.88.4.475. [DOI] [PMC free article] [PubMed] [Google Scholar]
- Lopez-Lopez JR, Shacklock PS, Balke CW, Wier W. Local calcium transients triggered by single L-type calcium channel currents in cardiac cells. Science. 1995;268:1042–1045. doi: 10.1126/science.7754383. [DOI] [PubMed] [Google Scholar]
- Maier SK, Westenbroek RE, Schenkman KA, Feigl EO, Scheuer T, Catterall WA. An unexpected role for brain-type sodium channels in coupling of cell surface depolarization to contraction in the heart. Proc Natl Acad Sci U S A. 2002;99:4073–4078. doi: 10.1073/pnas.261705699. [DOI] [PMC free article] [PubMed] [Google Scholar]
- Nuss HB, Houser SR. Sodium-calcium exchange-mediated contractions in feline ventricular myocytes. Am J Physiol Heart Circ Physiol. 1992;263:H1161–1169. doi: 10.1152/ajpheart.1992.263.4.H1161. [DOI] [PubMed] [Google Scholar]
- Osaka T, Joyner RW. Developmental changes in calcium currents of rabbit ventricular cells. Circ Res. 1991;68:788–796. doi: 10.1161/01.res.68.3.788. [DOI] [PubMed] [Google Scholar]
- Peskoff A, Langer GA. Calcium concentration and movement in the ventricular cardiac cell during an excitation-contraction cycle. Biophys J. 1998;74:153–174. doi: 10.1016/S0006-3495(98)77776-8. [DOI] [PMC free article] [PubMed] [Google Scholar]
- Polakova E, Zahradnikova A, Jr, Pavelkova J, Zahradnik I, Zahradnikova A. Local calcium release activation by DHPR calcium channel openings in rat cardiac myocytes. J Physiol. 2008;586:3839–3854. doi: 10.1113/jphysiol.2007.149989. [DOI] [PMC free article] [PubMed] [Google Scholar]
- Rogart RB, Cribbs LL, Muglia LK, Kephart DD, Kaiser MW. Molecular cloning of a putative tetrodotoxin-resistant rat heart Na+ channel isoform. Proc Natl Acad Sci U S A. 1989;86:8170–8174. doi: 10.1073/pnas.86.20.8170. [DOI] [PMC free article] [PubMed] [Google Scholar]
- Sipido KR, Carmeliet E, Pappano A. Na+ current and Ca2+ release from the sarcoplasmic reticulum during action potentials in guinea-pig ventricular myocytes. J Physiol. 1995;489:1–17. doi: 10.1113/jphysiol.1995.sp021025. [DOI] [PMC free article] [PubMed] [Google Scholar]
- Sipido KR, Maes M, Van de Werf F. Low efficiency of Ca2+ entry through the Na+-Ca2+ exchanger as trigger for Ca2+ release from the sarcoplasmic reticulum. A comparison between L-type Ca2+ current and reverse-mode Na+-Ca2+ exchange. Circ Res. 1997;81:1034–1044. doi: 10.1161/01.res.81.6.1034. [DOI] [PubMed] [Google Scholar]
- Sobie EA, Cannell MB, Bridge JH. Allosteric activation of Na+-Ca2+ exchange by L-type Ca2+ current augments the trigger flux for SR Ca2+ release in ventricular myocytes. Biophys J. 2008;94:L54–56. doi: 10.1529/biophysj.107.127878. [DOI] [PMC free article] [PubMed] [Google Scholar]
- Sobie EA, Ramay HR. Excitation-contraction coupling gain in ventricular myocytes: insights from a parsimonious model. J Physiol. 2009;587:1293–1299. doi: 10.1113/jphysiol.2008.163915. [DOI] [PMC free article] [PubMed] [Google Scholar]
- Stern MD. Theory of excitation-contraction coupling in cardiac muscle. Biophys J. 1992;63:497–517. doi: 10.1016/S0006-3495(92)81615-6. [DOI] [PMC free article] [PubMed] [Google Scholar]
- Stern MD, Pizarro G, Rios E. Local control model of excitation-contraction coupling in skeletal muscle. J Gen Physiol. 1997;110:415–440. doi: 10.1085/jgp.110.4.415. [DOI] [PMC free article] [PubMed] [Google Scholar]
- Tsujii E, Inoue M, Goldhaber JI, Bridge JH. During action potentials (APs) the Ca2+ transient is modulated not by changes in spark probability (Ps) but by the sarcoplasmic reticulum (SR) Biophys J. 2005;(2005 Abstract Issue):3117-Pos. [Google Scholar]
- Vites A-M, Wasserstrom JA. Ca2+ influx via Na-Ca exchange and ICa can both trigger transient contractions in cat ventricular myocytes. Ann N Y Acad Sci. 1996a;779:521–524. doi: 10.1111/j.1749-6632.1996.tb44826.x. [DOI] [PubMed] [Google Scholar]
- Vites AM, Wasserstrom JA. Fast sodium influx provides an initial step to trigger contractions in cat ventricle. Am J Physiol Heart Circ Physiol. 1996b;271:H674–686. doi: 10.1152/ajpheart.1996.271.2.H674. [DOI] [PubMed] [Google Scholar]
- Wasserstrom JA, Vites A. The role of Na+-Ca2+ exchange in activation of excitation-contraction coupling in rat ventricular myocytes. J Physiol. 1996;493:529–542. doi: 10.1113/jphysiol.1996.sp021401. [DOI] [PMC free article] [PubMed] [Google Scholar]
- Weber CR, Ginsburg KS, Bers DM. Cardiac submembrane [Na+] transients sensed by Na+-Ca2+ exchange current. Circ Res. 2003;92:950–952. doi: 10.1161/01.RES.0000071747.61468.7F. [DOI] [PubMed] [Google Scholar]
- Yuan W, Ginsburg KS, Bers DM. Comparison of sarcolemmal calcium channel current in rabbit and rat ventricular myocytes. J Physiol. 1996;493:733–746. doi: 10.1113/jphysiol.1996.sp021418. [DOI] [PMC free article] [PubMed] [Google Scholar]
- Zhou YY, Song LS, Lakatta EG, Xiao RP, Cheng H. Constitutive β2-adrenergic signalling enhances sarcoplasmic reticulum Ca2+ cycling to augment contraction in mouse heart. J Physiol. 1999;521:351–361. doi: 10.1111/j.1469-7793.1999.00351.x. [DOI] [PMC free article] [PubMed] [Google Scholar]