

Abstract
A fat-rich energy-dense diet is an important cause of insulin resistance. Stimulation of fat turnover in muscle cells during dietary fat challenge may contribute to maintenance of insulin sensitivity. Exercise in the fasted state markedly stimulates energy provision via fat oxidation. Therefore, we investigated whether exercise training in the fasted state is more potent than exercise in the fed state to rescue whole-body glucose tolerance and insulin sensitivity during a period of hyper-caloric fat-rich diet. Healthy male volunteers (18–25 y) received a hyper-caloric (∼+30% kcal day−1) fat-rich (50% of kcal) diet for 6 weeks. Some of the subjects performed endurance exercise training (4 days per week) in the fasted state (F; n = 10), whilst the others ingested carbohydrates before and during the training sessions (CHO; n = 10). The control group did not train (CON; n = 7). Body weight increased in CON (+3.0 ± 0.8 kg) and CHO (+1.4 ± 0.4 kg) (P < 0.01), but not in F (+0.7 ± 0.4 kg, P = 0.13). Compared with CON, F but not CHO enhanced whole-body glucose tolerance and the Matsuda insulin sensitivity index (P < 0.05). Muscle GLUT4 protein content was increased in F (+28%) compared with both CHO (P = 0.05) and CON (P < 0.05). Furthermore, only training in F elevated AMP-activated protein kinase α phosphorylation (+25%) as well as up-regulated fatty acid translocase/CD36 and carnitine palmitoyltransferase 1 mRNA levels compared with CON (∼+30%). High-fat diet increased intramyocellular lipid but not diacylglycerol and ceramide contents, either in the absence or presence of training. This study for the first time shows that fasted training is more potent than fed training to facilitate adaptations in muscle and to improve whole-body glucose tolerance and insulin sensitivity during hyper-caloric fat-rich diet.
Introduction
As lifestyle changes have resulted in a dramatic rise in the incidence of obesity and type 2 diabetes, it is important to improve strategies aimed to prevent and/or treat insulin resistance, one of the earliest hallmarks of the development of type 2 diabetes (Zimmet et al. 2001). Skeletal muscle plays a major role in glucose metabolism, accounting for ∼75% of whole-body insulin-stimulated glucose uptake (DeFronzo et al. 1981), which indicates a primary site for intervention.
Fat accumulation inside muscle cells or intramyocellular lipid (IMCL) content is associated with insulin resistance in sedentary populations (Pan et al. 1997; Goodpaster et al. 2001). Consumption of a high-fat diet (HFD) generates an imbalance between lipid storage and oxidation in muscle cells, and thereby results in elevated IMCL in healthy young subjects within days (Bachmann et al. 2001; Schrauwen-Hinderling et al. 2005). Bachmann et al. (2001) demonstrated that HFD-induced increase in IMCL is accompanied by impaired insulin sensitivity. Both rate of fatty acid (FA) transport and FA oxidation were found to be simultaneously enhanced in red muscle of obese as well as type 2 diabetic rats (Bonen et al. 2009; Holloway et al. 2009). However, the increase in lipid oxidation did not fully compensate for the excess FA import in muscle cells, leading to ectopic lipid accumulation. Furthermore, over-expression of muscle carnitine palmitoyltransferase 1 (CPT1) in rats, which stimulated FA oxidation, restored HFD-induced insulin resistance (Bruce et al. 2009). The above findings pinpoint the importance of matching FA uptake and oxidation in skeletal muscle. By this rationale, the higher rate of exercise-induced oxidative fat turnover in physically active individuals (Turcotte et al. 1992; Helge et al. 2001) could at least partly explain the presence of enhanced muscular insulin sensitivity against the face of elevated IMCL (Goodpaster et al. 2001). Indeed, a high turnover rate of IMCL probably blunts accumulation of toxic FA metabolites, such as diacylglycerol and ceramide (Moro et al. 2007), which may interfere with insulin signalling (Summers, 2006; Timmers et al. 2008). Thus stimulation of exercise-induced IMCL breakdown followed by repletion through increased channelling of FAs towards triglyceride synthesis in muscle cells may reduce the formation of bioactive lipids during HFD, and hence protect against the development of muscular insulin resistance (Liu et al. 2007; Schenk, 2007).
The beneficial impact of regular exercise in a carbohydrate-restricted state has previously been questioned (Akerstrom et al. 2009; McConell et al. 1999). Nonetheless, evidence is mounting to prove that limiting carbohydrate availability during exercise by various strategies can stimulate training-induced adaptations in muscle cells to facilitate oxidative energy turnover as well as FA transport (Hansen et al. 2005; De Bock et al. 2008; Yeo et al. 2008; Morton et al. 2009; Nybo et al. 2009; Stannard et al. 2010; Van Proeyen et al. submitted). Furthermore, the dietary context of exercise clearly plays a pivotal role in regulating IMCL metabolism during and after exercise. In this regard, we have shown that carbohydrate intake before and during endurance exercise, compared with exercise in the fasted state, largely inhibited IMCL degradation (De Bock et al. 2005). Furthermore, it is well documented that energy production from fat oxidation is markedly stimulated by exercise in the fasted state (De Bock et al. 2005; Bennard & Doucet, 2006). Against this background, it is reasonable to postulate that consistent exercise training in the fasted state may be an effective strategy to up-regulate IMCL turnover and thereby prevent the accumulation of deleterious FA intermediates. Thus, in populations exposed to excessive dietary fat intake, early morning exercise in the fasted state may be a more effective exercise mode than exercise in the fed-state, to alleviate the development of diet-induced insulin resistance. Therefore, the present study compared the effect of exercise training in the fasted state versus exercise in conjunction with ample carbohydrate intake on glucose tolerance, insulin sensitivity and some key regulators of IMCL turnover, in healthy young men during a period of hyper-caloric HFD.
Methods
Subjects
Twenty-eight healthy, young male volunteers (age: 21.2 ± 0.3 (s.e.m) years; body weight: 71.5 ± 1.9 kg) participated in the study, which was approved by the local Ethics Committee (K.U. Leuven) and was in accordance with The Declaration of Helsinki. All subjects were involved in regular sports and physical activity at a rate of ∼3.5 h per week (range 2–6 h), but none of them was consistently endurance trained in either cycling or running. Subjects were asked not to participate in any strenuous exercise sessions other than prescribed by the study protocol during the period of the study. The control group was repeatedly instructed not to change their normal participation in exercise and physical activities for the full duration of the study. Subjects gave their written, informed consent after they were informed of all experimental procedures and risks associated with the experiments. During the study one subject from the control group dropped-out due to illness that was unrelated to the study protocol.
Study protocol
Preliminary testing and subject randomization
Two weeks before the start of the study, the subjects performed a maximal incremental exercise test (initial load 100 W + 35 W per 3 min) on a bicycle ergometer (Avantronic Cyclus II, Leipzig, Germany) to determine rate of maximal oxygen uptake ( ) and the corresponding workload (Wmax). Heart rate (Polar, Kempele, Finland),
  and
and  (Cortex Metalyzer II, Leipzig, Germany) were continuously measured during the test and the exercise intensity corresponding to maximal rate of fat oxidation (FATmax) was determined as previously described (Achten et al. 2002). Furthermore, subjects completed a 4-day dietary record to assess their normal dietary habits. Energy intake and diet composition were analysed using a nutritional software package (Becel 5.00, Unilever Bestfoods, Rotterdam, The Netherlands). Independent of the experimental group, subjects on average ingested ∼3000 kcal per day, of which ∼50% was in the form of carbohydrates, ∼35% fat and ∼15% protein (see Table 1). Based on these preliminary examinations, subjects were matched to obtain triplets with similar values for
  and energy intake (kcal (24 h)−1). At the start of the study, triplet-matched subjects were randomly assigned to either of three experimental groups.
Table 1.
Daily energy intake before the start of the study
| CON | F | CHO | |
|---|---|---|---|
| Energy intake (kcal day−1) | 3081 (2018–3957) | 2911 (1951–3977) | 3012 (2011–3984) |
| % fat | 36 (26–40) | 36 (29–42) | 34 (28–38) |
| % carbohydrate | 51 (43–61) | 49 (41–58) | 52 (46–64) |
| % protein | 13 (9–18) | 15 (10–17) | 14 (9–19) |
Data provided are means and range in parentheses (CON: n = 7; F: n = 10; CHO: n = 10), and represent average total daily energy intake and macronutrient composition of the diet during 4 days preceding the start of the study.
Study design and experimental groups
After the randomization, subjects enrolled on a 6-week dietary intervention programme involving hyper-caloric fat-rich feeding (see below). Two groups combined the diet with a supervised training programme, which consisted either of exercise training in the fasted state (F, n = 10), or similar training with carbohydrate intake before and during exercise (CHO, n = 10; see below). The control group (CON, n = 7) received the hyper-caloric fat-rich diet in the absence of training. Before (pretest) and at the end (posttest) of the intervention period, the subjects participated in a 3-day experimental session.
Dietary intervention
Before the start of the study high-fat menus for weekdays Monday to Friday were composed by a professional dietician. Four different menus were elaborated, which contained either 3000 kcal, 3500 kcal, 4000 kcal, or 4500 kcal per day, respectively, and energy intake was similar on training days and rest days. Energy distribution in each dietary programme was ∼50% in the form of fat, ∼40% carbohydrates and ∼10% protein. Subjects received supervised lunches, whereas all other meals, snacks and drinks were provided by the investigators as individual take-home food packages. On weekends the subjects were instructed to reproduce as closely as possible the dietary pattern from the weekdays, and they completed a detailed food diary for analysis upon completion of the study. Based on the dietary analyses prior to the start of the study, triplets were assigned to the menu programme (3000–4500 kcal) yielding an increase in energy intake of ≥30%. Because after 2 weeks of follow-up, body weight increase in the control group on average was less than expected (0.46 ± 0.23 kg), probably due to under-reporting in the preliminary dietary analyses, all subjects were moved up to the menu with 500 kcal higher energy intake from the start of week 3. In addition, they were instructed to adapt the weekend diet accordingly.
Training intervention
F performed all training sessions in the fasted state, whereas CHO received a carbohydrate-rich breakfast (675 kcal, 70% carbohydrates, 15% fat, 15% protein) ∼90 min before each training session. In addition, during exercise CHO ingested a drinking solution containing 1 g maltodextrin per kg body weight in 500 ml water per hour, whilst F received a similar volume of water. In order to obtain identical daily energy intakes between F and CHO throughout the study, F received the ‘breakfast’ which they missed in the morning, plus the amount of maltodextrin they omitted during exercise, in mid-afternoon. Subjects participated in two 60 min and two 90 min supervised training sessions per week, always between 06.30 and 09.00 h. Training sessions consisted of a combination of cycling and running exercise. F and CHO subjects always simultaneously trained as matched pairs. Because due to the randomisation procedure F and CHO had similar  , during cycling F subjects were instructed to adjust the workload to obtain a heart rate corresponding with 70–75%
 , whilst CHO subjects adjusted the workload to correspond with their F companion. A similar procedure was used for the running training. Intensity in running was set at 85% of the maximal heart rate obtained from a Bruce protocol during the first training session in the training centre (Bruce et al. 1963). Thus, training duration and intensity was identical between F and CHO at all times.
Pretest and posttest
The pretest and the posttest were organised over three separate days each. On the first day subjects reported to the laboratory and fat mass was assessed by the sum of 12 skinfolds measures. In the evening, subjects received a standardised dinner (1050 kcal, 60% carbohydrates, 30% fat, 10% protein), after which they remained fasted until an oral glucose tolerance test (OGTT) was started on the next morning. Subjects were seated in a comfortable chair and received 75 g of glucose in 300 ml water. Thereafter, blood samples (50 μl) were collected from a hyperaemic earlobe at 20 min intervals and were immediately analysed for blood glucose (Analox GM7, Analox Instruments Ltd, London, UK). Furthermore, at 0, 60 and 120 min a blood sample was taken from an arm vein into vacuum tubes containing Silica clot activator (Vacutainer, BD, Franklin Lakes NJ, USA). Tubes were centrifuged (567 g for 15 min at 4°C) and the supernatant serum was stored at −20°C until analysed at a later date. Positive incremental area under the glucose curve (AUCgluc) and the Matsuda insulin sensitivity index (ISI) (Matsuda & DeFronzo, 1999) were calculated. Following the OGTT, subjects received a standardised diet for 3 days to avoid fluctuations in IMCL (Bachmann et al. 2001). In the pretest, subjects received a well-balanced diet (2500–3500 kcal; 60% carbohydrates; 25% fat; 15% protein), whilst during the posttest subjects continued to adhere to the HFD as prescribed by the study protocol. On each occasion subjects reported to the laboratory between 06.00 and 10.00 h after a ∼12 h overnight fast. After a 30 min rest, a blood sample (10 ml) was taken from an antecubital vein. Immediately after, a percutaneous needle biopsy was taken from the right m. vastus lateralis under local anaesthetic through an incision in the skin (2–3 ml lidocaine, subcutaneously). Part of the sample was immediately frozen in liquid nitrogen. The remaining part was mounted in embedding medium (Tissue-Tek, Sakura FineTek, Zoeterwoude, The Netherlands) and frozen in isopentane cooled in liquid nitrogen. All muscle samples were stored at −80°C until later analysis. Subjects were instructed to avoid strenuous exercise for at least 2 days prior to the biopsies. During the posttest the biopsies in F and CHO were taken ∼48 h after the last training session.
Biochemical analyses
Oil-Red-O staining
Serial sections (4 μm) from biopsy samples were put on uncoated glass slides for determination of fibre type-specific IMCL content by Oil-Red-O staining as we have previously described (De Bock et al. 2005). Fibre-type specific IMCL content was expressed as arbitrary units (A.U.). For each cross-section a total of 141 ± 6 fibres were analysed.
Muscle glycogen and lipid intermediates
Muscle glycogen content was measured as glucose residues after acid hydrolysis, in freeze-dried muscle tissue using a standard enzymatic fluorometric assay (Lowry & Passoneau, 1972). Lipids extracts were prepared from biopsies (Van Veldhoven & Bell, 1988), followed by analysis of phospholipids (organic phosphate) (Van Veldhoven & Bell, 1988), and enzymatic quantification of ceramide and diacylglycerol by means of [γ-32P]ATP and E. coli diacylglycerol kinase (Van Veldhoven et al. 1992, 1995).
Enzyme activities
Activities of citrate synthase (CS), β-hydroxyacyl coenzyme A dehydrogenase (β-HAD) and cytochrome c oxidase (COX) were performed using enzymatic spectrophotometric assays as previously described (den Hoed et al. 2008).
RNA extraction, reverse transcription and real-time qPCR analysis
Total RNA from frozen muscle samples was extracted using the TRIzol method (Invitrogen, Merelbeke, Belgium). cDNA preparation and real-time qPCR analysis were carried out as previously described (De Bock et al. 2008). Assay IDs were Hs00354519 (fatty acid translocase/CD36, FAT/CD36) and Hs00193219 (carnitine palmitoyltransferase 1, CPT1). To compensate for variations in input RNA amounts and PCR reaction efficiency two genes, peptidylprolyl isomerase A (cyclophilin A) (Hs99999904) and β-2-microglobulin mRNA (Hs00187842), were chosen using the GeNorm applet (Vandesompele et al. 2002) and used as reference genes to normalize the values.
Muscle lysate production and Western blotting
Muscle lysate production and Western blotting were done as previously described (De Bock et al. 2005). The primary antibodies used were GLUT4 (Millipore, Brussels, Belgium), total AMP-activated protein kinase (AMPK) α (Cell Signaling Technology, Inc., Danvers, MA, USA), phospho-AMPKα Thr172 (Cell Signaling), and glyceraldehyde 3-phosphate dehydrogenase (GAPDH; Abcam, Cambridge, UK). The appropriate secondary antibodies were used (DakoCytomation, Heverlee, Belgium, and Cell Signaling). Band density was calculated by using Kodak 1D image analysis software. Results were expressed relative to a standard that was run together with the samples, and for GLUT4 relative to GAPDH.
Analysis of blood samples
Serum insulin was assayed by chemiluminescence using the Siemens DPC kit according to the instructions of the manufacturer. Plasma non-esterified free fatty acids (FFAs) were determined using a reagent kit (WAKO Chemicals GmbH, Neuss, Germany).
Statistical analyses
Treatment effects were evaluated using a repeated-measures analysis of variance (ANOVA). Two-way ANOVA was performed to examine the main effects of treatment and/or time. A planned contrast analysis was used for post hoc comparisons, when appropriate. Contrast analysis was also used to evaluate specific pre-planned comparisons. The association between variables was analysed by Pearson's product moment correlation analysis. A probability level (P) ≤ 0.05 was considered statistically significant. All data are expressed as means ±s.e.m.
Results
Glucose tolerance and insulin action
Whole-body glucose tolerance was assessed using an OGTT (Fig. 1). In the pretest, AUCgluc was similar between the groups (CON, 182 ± 35; F, 238 ± 22; CHO, 263 ± 43 mmol min−1 l−1). HFD did not significantly change AUCgluc in CON (203 ± 29 mmol min−1 l−1). However, compared with CON, training decreased AUCgluc in F (173 ± 11 mmol min−1 l−1, P < 0.05) but not in CHO (250 ± 36 mmol min−1 l−1). Figure 2 clearly shows that F markedly improved glucose tolerance in the majority of the subjects, whilst in CHO diverse responses occurred. In the pretest, serum insulin concentrations during the OGTT were similar between the groups (inset tables in Fig. 1). Basal serum insulin was not significantly increased in CON (P = 0.11). Compared with CON, basal insulin value was lowered in F (P < 0.05) and tended to decrease in CHO (P = 0.08). In the posttest, at 60 min in the OGTT insulin level in CON was higher than in the pretest (P = 0.05), whereas values in F and CHO were decreased (P < 0.05). However, values were not significantly different between F and CHO (P = 0.49). Insulin concentrations at 120 min in the OGTT were similar between the groups in the pretest as well as in the posttest. Matsuda insulin sensitivity index (ISI) was also calculated as an index of whole-body insulin sensitivity (Fig. 3). In the pretest, all groups had a similar ISI, and in CON ISI did not significantly decrease due to HFD (P = 0.39). However, compared with CON, in the posttest ISI was increased in F (P < 0.05), but not in CHO (P = 0.11). As GLUT4 plays an important role in insulin action on muscle glucose transport, we assayed total muscle GLUT4 protein content (Fig. 4A). GLUT4 content in the pretest was similar between groups. The training-induced increase in muscle GLUT4 content was greater in F than in CHO (P = 0.05). Hence compared with CON, at the end of the study GLUT4 content was increased in F (+28%, P < 0.05) but not in CHO (P = 0.50). Because AMPK might play a role in stimulating GLUT4 synthesis (Winder et al. 2000; Ojuka et al. 2002; Jager et al. 2007; Canto et al. 2010) we also measured muscle total AMPKα protein content and phosphorylation status. In the pretest, AMPKα protein content (CON: 1.00 ± 0.07; F: 1.29 ± 0.12; CHO: 1.23 ± 0.18) and phosphorylation status (Fig. 4B) were similar between the groups. Compared with the pretest, AMPKα content in the posttest was increased in F (1.58 ± 0.20, P < 0.05), but not in CON (1.05 ± 0.06, P = 0.71) nor in CHO (1.29 ± 0.15, P = 0.32). Hence in the posttest AMPKα total protein content was higher in F than in CON (P < 0.05). Compared with the pretest, in the posttest the phospho to total AMPKα ratio was increased in F (+25%, P < 0.05), but not in CHO or CON (Fig. 4B).
Figure 1. Effect of high-fat diet, alone or in conjunction with training in either the fasted or the carbohydrate-fed state, on glucose tolerance.
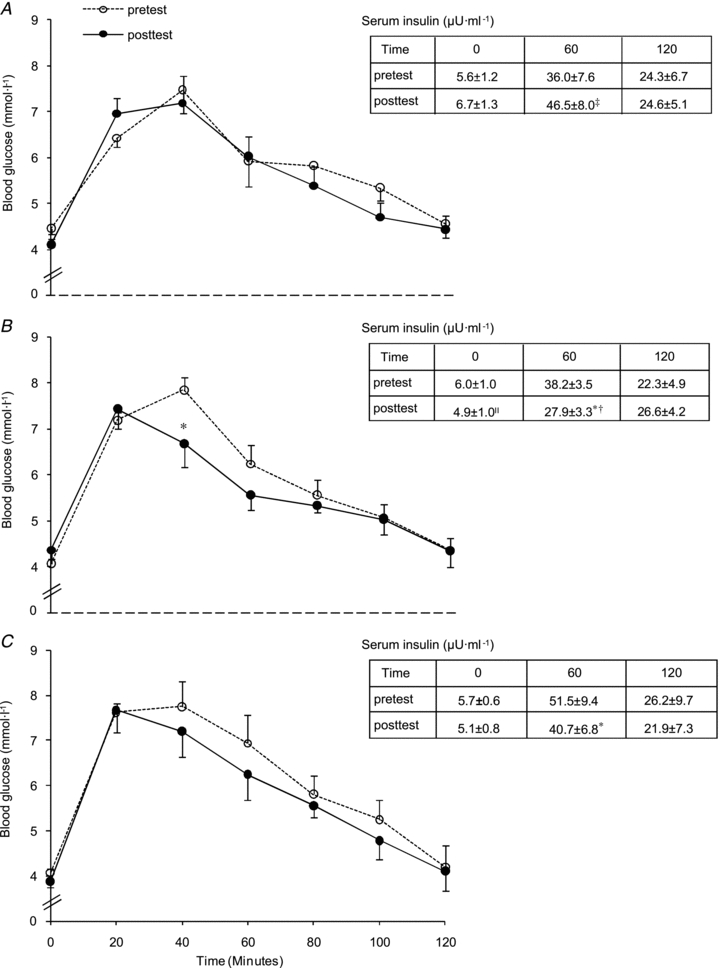
Data provided are means ±s.e.m. (CON: n = 7; F: n = 9; CHO: n = 8–9) and represent blood glucose concentrations during a 120 min OGTT. Inset tables show the corresponding serum insulin concentrations (μU ml−1) at 0, 60 and 120 min. Values before (pretest) and after (posttest) a 6-week hyper-caloric fat-rich diet, in either the absence (CON, panel A) or the presence of training in either the fasted state (F, panel B) or the carbohydrate-fed state (CHO, panel C) are shown. Three-way ANOVA was performed to examine the main effects of treatment, time (pretest versus posttest) and time within the OGTT. One outlier (CHO subject) is omitted from the glucose data analysis. *P < 0.05, versus pretest; ‡P = 0.05, versus pretest; IIP = 0.07, versus pretest; §P < 0.05, versus CON pretest; †P < 0.05, versus CON posttest.
Figure 2. Effect of high-fat diet, alone or in conjunction with training in either the fasted or the carbohydrate-fed state, on individual responses on glucose tolerance.
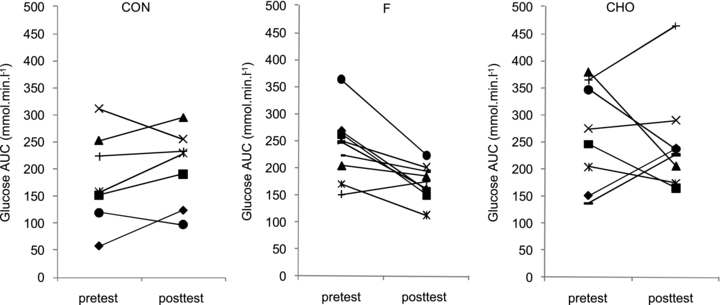
Data provided are individual values (CON: n = 7; F: n = 9; CHO: n = 8) and represent area under the glucose curve (AUCgluc) during a 120 min OGTT. Values before (pretest) and after (posttest) a 6-week hyper-caloric fat-rich diet, in either the absence (CON) or the presence of training in either the fasted state (F) or the carbohydrate-fed state (CHO) are shown. One outlier (CHO subject) is omitted from the glucose data analysis.
Figure 3. Effect of high-fat diet, alone or in conjunction with training in either the fasted or the carbohydrate-fed state, on whole-body insulin sensitivity.
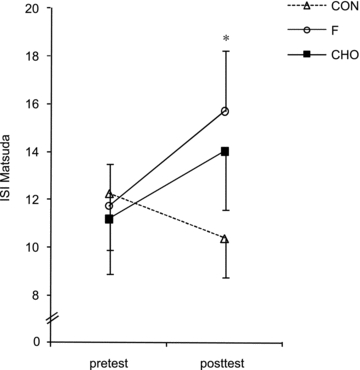
Data provided are means ±s.e.m. (CON: n = 7; F: n = 9; CHO: n = 9) and represent Matsuda insulin sensitivity index (ISI) as calculated by fasting glucose and insulin values. Values before (pretest) and after (posttest) a 6-week hyper-caloric fat-rich diet, either in the absence (CON) or presence of training in either the fasted state or the carbohydrate-fed state (CHO) are shown. *P < 0.05, versus pretest.
Figure 4. Effect of high-fat diet, alone or in conjunction with training in either the fasted or the carbohydrate-fed state, on muscle total GLUT4 protein content and AMPKα phosphorylation status.
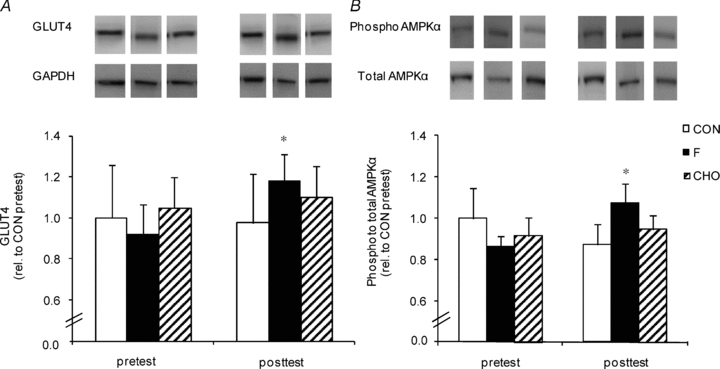
Data provided are means ±s.e.m. (CON: n = 7; F: n = 9; CHO: n = 10) and represent total GLUT4 protein content relative to GAPDH (panel A) and AMPKα phosphorylation status relative to total protein content (panel B) in m. vastus lateralis measured by Western blotting. Values before (pretest) and after (posttest) a 6-week hyper-caloric fat-rich diet, in either the absence (CON, open bars) or the presence of training in either the fasted state (F, filled bars) or the carbohydrate-fed state (CHO, hatched bars) are shown. Pretest values in CON were assigned the arbitrary value of 1.0 and all other samples were expressed relative to this value. *P < 0.05, versus pretest.
Muscle glycogen and lipid content
Total muscle glycogen content was similar between groups in the pretest and in CON was unchanged in the posttest (Table 2). Compared with the pretest, in the posttest muscle glycogen content was elevated in F (P < 0.05) but not in CHO (P = 0.10). Still, posttest values in both F and CHO were significantly higher than in CON (P < 0.05). Compared with the pretest, HFD in CON increased IMCL content in type I and type IIa fibres by ∼50 and ∼75%, respectively (P < 0.05) (Fig. 5). Similar increments were found in F and CHO, and there were no differences between the groups at any time. Independent of the pretest or the posttest, muscle diacylglycerol and ceramide contents were similar between the groups (Table 3). Phospholipid content was slightly increased from the pretest to the posttest in CHO (P < 0.05), and tended to be increased in F (P = 0.08). However, there were no differences between the groups at any time.
Table 2.
Effect of high-fat diet, alone or in conjunction with training in either the fasted or the carbohydrate-fed state, on muscle glycogen content and mitochondrial enzyme activities
| CON | F | CHO | ||
|---|---|---|---|---|
| Glycogen (mmol (kg dry weight)−1) | Pretest | 471 ± 24 | 483 ± 40 | 502 ± 46 |
| Posttest | 448 ± 37 | 578 ± 26*† | 562 ± 34† | |
| CS (μmol min−1 g−1) | Pretest | 117 ± 5 | 137 ± 10 | 130 ± 16 |
| Posttest | 108 ± 9 | 157 ± 7*† | 153 ± 16*† | |
| β-HAD (μmol min−1 g−1) | Pretest | 43 ± 4 | 45 ± 4 | 46 ± 7 |
| Posttest | 43 ± 4 | 51 ± 3 | 50 ± 7 | |
| COX (μmol min−1 g−1) | Pretest | 74 ± 6 | 71 ± 3 | 89 ± 6 § |
| Posttest | 80 ± 4 | 78 ± 3 | 90 ± 6 |
Data provided are means ±s.e.m. (CON: n = 7; F: n = 10; CHO: n = 10) and represent total glycogen content, and mitochondrial activities of citrate synthase (CS), β-hydroxyacyl coenzyme A dehydrogenase (β-HAD) and cytochrome c oxidase (COX) in m. vastus lateralis. Values before (pretest) and after (posttest) a 6-week hyper-caloric fat-rich diet, in either the absence (CON) or the presence of training in either the fasted state (F) or the carbohydrate-fed state (CHO) are shown.
P < 0.05, versus pretest;
P < 0.05, versus CON posttest;
P < 0.05, versus F and CON pretest.
Figure 5. Effect of high-fat diet, alone or in conjunction with training in either the fasted or the carbohydrate-fed state, on intramyocellular lipid content.
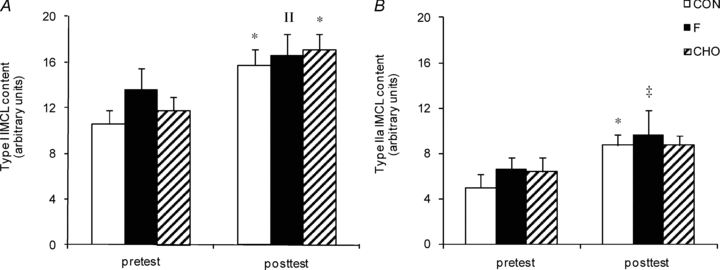
Data provided are means ±s.e.m. (CON: n = 7; F: n = 10; CHO: n = 10) and represent basal IMCL content in type I (panel A) and type IIa (panel B) fibres as determined by fluorescence microscopy on Oil-Red-O stained muscle cross-sections (arbitrary units). Values before (pretest) and after (posttest) a 6-week hyper-caloric fat-rich diet, in either the absence (CON, open bars) or the presence of training in either the fasted state (F, filled bars) or the carbohydrate-fed state (CHO, hatched bars) are shown. *P < 0.05, versus pretest; ‡P = 0.06, versus pretest; IIP = 0.09, versus pretest.
Table 3.
Effect of high-fat diet, alone or in conjunction with training in either the fasted or the carbohydrate-fed state, on muscle lipid intermediates
| CON | F | CHO | ||
|---|---|---|---|---|
| Diacylglycerol (pmol (nmol phospholipid)−1) | Pretest | 21.8 ± 2.1 | 26.8 ± 3.6 | 21.9 ± 3.2 |
| Posttest | 21.2 ± 2.3 | 23.8 ± 3.4 | 28.4 ± 4.2 | |
| Ceramide (pmol (nmol phospholipid)−1) | Pretest | 6.8 ± 0.6 | 6.9 ± 0.4 | 6.0 ± 0.3 |
| Posttest | 6.4 ± 0.3 | 6.3 ± 0.3 | 6.5 ± 0.4 | |
| Phospholipids (nmol (mg muscle)−1) | Pretest | 14.4 ± 0.4 | 14.7 ± 0.4 | 14.0 ± 0.3 |
| Posttest | 15.6 ± 0.5 | 15.9 ± 0.4† | 16.2 ± 0.6* |
Data provided are means ±s.e.m. (CON: n = 7; F: n = 10; CHO: n = 10) and represent diacylglycerol, ceramide and phospholipid content in m. vastus lateralis. Values before (pretest) and after (posttest) a 6-week hyper-caloric fat-rich diet, in either the absence (CON) or the presence of training in either the fasted state (F) or the carbohydrate-fed state (CHO) are shown.
P < 0.05, versus pretest;
P = 0.08, versus pretest.
mRNA content
mRNA contents were not significantly different between the three groups in the pretest, and in CON values did not change during the study. However in the posttest, compared with CON mRNA levels of both FAT/CD36 and CPT1 were increased by ∼30% in F (P < 0.05), but not in CHO (P > 0.25) (Fig. 6).
Figure 6. Effect of high-fat diet, alone or in conjunction with training in either the fasted or the carbohydrate-fed state, on muscle mRNA content of FAT/CD36 and CPT1.
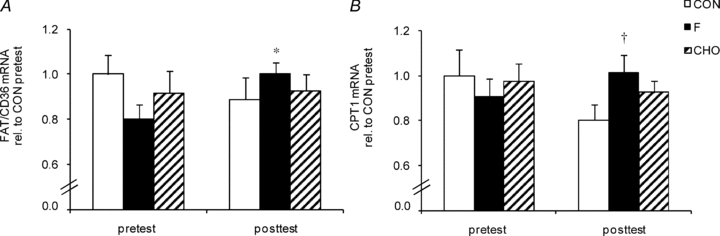
Data provided are means ±s.e.m. (CON: n = 7; F: n = 9; CHO: n = 9) and represent mRNA content of FAT/CD36 (panel A) and CPT1 (panel B) measured by quantitative real time PCR. Values before (pretest) and after (posttest) a 6-week hyper-caloric fat-rich diet, in either the absence (CON, open bars) or the presence of training in either the fasted state (F, filled bars) or the carbohydrate-fed state (CHO, hatched bars) are shown. Pretest values in CON were assigned the arbitrary value of 1.0 and all other samples were expressed relative to this value. *P < 0.05, versus pretest; †P < 0.05, versus CON posttest.
Muscle oxidative capacity
In the pretest, CS and β-HAD activities were similar between groups (Table 2). However, COX activity was slightly higher in CHO than in F and CON (P < 0.05). Compared with CON, 6 weeks of endurance training increased CS to the same degree (∼+15%, P < 0.05) in F and CHO. By contrast, β-HAD and COX activities were altered in neither group.
Body composition and plasma free fatty acids (FFAs)
As shown in Table 4, in CON, body weight on average increased by ∼3 kg (range +0.4 to +5.7 kg) from the pretest to the posttest. This weight gain was largely, if not entirely, accounted for by fat accretion as evidenced by the 15% increase in sum of skinfolds, reflecting elevated subcutaneous fat deposit. Changes in body weight and sum of skinfolds were also highly positively correlated (R = 0.84; P < 0.001). This increase in body weight and skinfolds was largely negated by training in F (P < 0.05). Thus, compared with the pretest, neither body weight (P = 0.13) nor sum of skinfolds (P = 0.75) was significantly increased in the posttest. Conversely, in CHO, body weight on average was increased by ∼1.5 kg (range −0.2 to +2.6 kg, P < 0.05), which was less than in CON (P < 0.05). Furthermore, plasma FFA concentration was similar between the groups in the pretest (CON, 424 ± 42; F, 531 ± 54; CHO, 481 ± 42 μmol l−1). Compared with the pretest, plasma FFA level was significantly reduced in the posttest in both F (305 ± 46 μmol l−1, P < 0.01) and CHO (330 ± 46 μmol l−1, P < 0.05) but not in CON (355 ± 46 μmol l−1, P = 0.39).
Table 4.
Effect of high-fat diet, alone or in conjunction with training in either the fasted or the carbohydrate-fed state, on body weight and subcutaneous fat
| CON | F | CHO | ||
|---|---|---|---|---|
| Body weight (kg) | Pretest | 70.9 ± 3.4 | 73.3 ± 3.1 | 70.2 ± 3.6 |
| Posttest | 73.9 ± 3.2* | 74.1 ± 2.8 | 71.6 ± 3.4* | |
| Sum skinfolds (mm) | Pretest | 134.3 ± 27.7 | 139.7 ± 11.7 | 121.2 ± 11.0 |
| Posttest | 154.6 ± 28.3* | 141.3 ± 11.5 | 127.8 ± 11.2 |
Data provided are means ±s.e.m. (CON: n = 7; F: n = 10; CHO: n = 10) and represent body weight and subcutaneous fat (sum of 12 skinfolds). Values before (pretest) and after (posttest) a 6-week hyper-caloric fat-rich diet, in either the absence (CON) or the presence of training in either the fasted state (F) or the carbohydrate-fed state (CHO) are shown. (CON: n = 7; F: n = 10; CHO: n = 10.)
P < 0.05, versus pretest.
Exercise capacity
In the pretest, time to exhaustion (CON, 22.8 ± 1.5; F, 21.5 ± 1.1; CHO, 21.6 ± 1.2 min) and  (CON, 61.3 ± 3.2; F, 60.3 ± 2.2; CHO, 60.5 ± 1.5 ml min−1 kg−1) were similar between the groups. The training intervention increased time to exhaustion to the same degree (∼15%, P < 0.05) in both F (25.0 ± 1.1 min) and CHO (24.6 ± 1.2 min). Training also increased
  to 64.7 ± 1.8 ml min−1 kg−1 in CHO (P < 0.01), but no significant increase was found in F (61.2 ± 2.6 ml min−1 kg−1, P = 0.53). In CON, time to exhaustion (23.6 ± 1.3 min) and
  (60.7 ± 2.9 ml min−1 kg−1) were similar between the pretest and the posttest. In the pretest, FATmax was similar between the experimental groups (CON, 141 ± 10; F, 120 ± 13; CHO: 132 ± 10 W). Compared with the pretest, training tended to increase FATmax in F (136 ± 9 W, P = 0.08) but not in CHO (147 ± 11 W, P = 0.11).
Discussion
Insulin resistance is a major cause of mortality in Western societies. Dietary interventions combined with increasing the level of physical activity, is the primary strategy to prevent insulin resistance. In most individuals, time availability for exercise training is scarce, or motivation to spend many hours in training is lacking. Therefore, it is important to investigate which specific exercise modes are most effective in terms of disease prevention. There is substantial evidence to indicate that insufficient compensation of increased FA uptake by stimulation of lipid oxidation in muscle cells is implicated in the pathogenesis of insulin resistance induced by HFD (Hancock et al. 2008; Kraegen et al. 2008; Bruce et al. 2009; Bonen et al. 2009; Holloway et al. 2009). Here we hypothesised that exercise in the fasted state (F), by stimulating energy provision by fat oxidation (De Bock et al. 2005; Bennard & Doucet, 2006), could be more efficient than exercise in the fed-state (CHO), to counteract diet-induced glucose intolerance and insulin resistance. Our data show that a given amount of endurance training in F is more potent than training in CHO to improve glucose tolerance during an episode of dietary lipid challenge.
It is well established that consumption of a hyper-caloric HFD can rapidly impair glucose tolerance and insulin sensitivity in both rodents (Storlien et al. 1986; Oakes et al. 1997) and humans (Bachmann et al. 2001). From this evidence we administered a 6-week hyper-caloric HFD to healthy volunteers to induce insulin resistance. The diet increased body weight (∼3 kg) and subcutaneous fat deposits (Table 3). We did not directly measure insulin sensitivity by means of a hyperinsulinaemic euglycaemic clamp. However, the Matsuda insulin sensitivity index (ISI) obtained from an OGTT provides a good approximation of whole-body insulin sensitivity (Matsuda & DeFronzo, 1999). ISI was not significantly decreased after HFD (Fig. 3), indeed, yet a previous study in humans has demonstrated that deficiencies at the site of intramyocellular insulin signalling occur within days of HFD and against the background of tentatively unchanged insulin efficiency at whole-body level (Adochio et al. 2009). Interestingly, we found endurance training in F to alleviate the negative effect of HFD on whole-body glucose tolerance and ISI. Conversely, training in CHO failed to beneficially impact on glucose homeostasis and ISI (Figs 1–3). In addition, we also provide clear data to indicate that the effect on glucose tolerance and ISI in F was at least partly due to beneficial adaptations in skeletal muscles. The glucose transporter GLUT4 is an important determinant of insulin-mediated glucose uptake in muscle cells (Tsao et al. 1996; Zisman et al. 2000). Interestingly, training in F during HFD increased GLUT4 protein content in muscle, whilst it was unchanged in CHO (Fig. 4A). This observation is compatible with a previous report by Nybo et al. (2009) showing greater increase in GLUT4 protein expression after training when exercise was performed without glucose ingestion than when glucose was supplemented. Furthermore, glucose ingestion during exercise has been shown to suppress the exercise-induced increase of GLUT4 mRNA abundance (Civitarese et al. 2005; Cluberton et al. 2005). Our current data together with literature findings indicate that exercise training in the fasted state is more effective than exercise in the carbohydrate-fed state to stimulate glucose tolerance despite a hyper-caloric HFD.
It is currently believed that in conditions of increased FA delivery to muscle cells, like during HFD, fat oxidation is up-regulated to compensate for the overwhelming FA import, which eventually may contribute to preserve insulin sensitivity (Turner et al. 2007; Bonen et al. 2009; Bruce et al. 2009; Holloway et al. 2009). Furthermore, in the absence of muscle work, HFD-induced muscular insulin resistance has been linked to incomplete fat oxidation, in which a large proportion of FAs entering the mitochondria are only partly degraded (Koves et al. 2005, 2008). In this regard, it is well known that fat oxidation is enhanced during exercise in the fasted state (De Bock et al. 2005; Bennard & Doucet, 2006). In addition, we have reported that endurance training in the fasted state, but not in the fed state, induced adaptations in muscle cells to facilitate fat catabolism, i.e. increased protein expression of FAT/CD36 and membrane-bound fatty acid binding protein (De Bock et al. 2008). Along this line, here we once more demonstrate that chronic exercise in F, in contrast with CHO, elevated muscle FAT/CD36 and CPT1 mRNA content during HFD (Fig. 6). Although increased mRNA levels do not necessarily reflect similar changes in functional protein content of FAT/CD36 and CPT1 (Fluck, 2006), our current and earlier observations (De Bock et al. 2008) clearly demonstrate that endurance training in the fasted state is an effective strategy to induce muscular adaptations to facilitate fat turnover.
Besides enhanced FA oxidation, an alternative route to dispose of excess FA import into muscle cells during HFD is increased partitioning toward triglyceride synthesis (Bachmann et al. 2001; Schrauwen-Hinderling et al. 2005). It has been postulated that under conditions of high rates of FA flux into muscle, IMCL can act as a biologically inert reservoir for FAs. This mechanism in turn may reduce the formation of ‘toxic’ lipid metabolites and protect against the development of muscular insulin resistance (Schenk, 2007; Liu et al. 2007). In the current study we found HFD, either with or without training, to elevate IMCL content (Fig. 5). Furthermore, neither muscle ceramide nor muscle diacylglycerol concentrations were altered by any of the interventions (Table 3). Thus, the beneficial impact of exercise training in F on ISI and muscle GLUT4 occurred in the face of constant triacylglycerol, diacylglycerol and ceramide contents in muscle. Nonetheless, 8–16 weeks of endurance training in obese subjects simultaneously decreased muscle diacylglycerol and ceramide content, and improved insulin sensitivity (Bruce et al. 2006; Dube et al. 2008). However, it is difficult to compare the latter study with the present results as we trained healthy young volunteers, who were put on a short-term HFD, instead of obese subjects. Furthermore, we cannot exclude that the current intervention period was too short to alter total content of these deleterious lipid species. Hence the excess FA import in muscle cells during HFD may have been successfully buffered by stimulated FA oxidation during exercise as well as increased disposal in IMCL, thus preventing the formation of diacylglycerol and ceramide.
It is the prevailing opinion that AMPK is an important regulator of energy metabolism in muscle (Winder, 2001). Along this line, basal GLUT4 protein content is substantially reduced in skeletal muscle of untrained mice expressing a dominant negative AMPKα2 protein (Maarbjerg et al. 2009). However, the role of AMPK in muscular adaptations to endurance training is uncertain (Jorgensen et al. 2007), which may be explained by redundant exercise-induced signalling (Jensen et al. 2009; Murgia et al. 2009). Still, there is evidence to indicate that AMPK may be implicated in training-induced adaptations in muscle cells (Winder et al. 2000; Ojuka et al. 2002; Jager et al. 2007; Canto et al. 2010). Energy balance in muscle cells during contractions is more easily maintained when carbohydrate availability is abundant, than when carbohydrate supply is limited (Spencer et al. 1991), which may stimulate AMPK signalling. Accordingly, we (De Bock et al. 2005) and others (Akerstrom et al. 2006) have previously demonstrated that an acute exercise bout in the fasted state increased muscle AMPK activity more than an identical exercise bout in conjunction with ample carbohydrate intake. Although this was not found in another study, fasted exercise still resulted in a higher AMP/ATP ratio in muscle (Lee-Young et al. 2006). Based on the above observations during acute exercise, it is tempting to speculate that exercise training in F might increase the baseline level of AMPK activity to facilitate long-term energy homeostasis in muscle cells. Consistent with this assumption, we found training in F, but not in CHO, to increase the degree of AMPKα phosphorylation (Fig. 4B).
It needs to be mentioned that energy intake during hyper-caloric diet was similar in all experimental groups. Therefore, CON subjects were relatively more overfed (∼30%) than the individuals who participated in four weekly endurance exercise sessions (∼15–20%), which makes it difficult to separate out effects of training and the magnitude of overfeeding. Furthermore, our findings do not rule out the possibility that in F the unchanged body weight may have accounted for, or partly contributed to, some beneficial adaptations.
Finally, it is important to note that the current short-term experiments were performed in lean, healthy, and physically active young volunteers. Thus, findings must not be simply extrapolated to obese patients with insulin resistance, the ultimate target population. Still, our observations conceivably are relevant for individuals whom, for whatever reason, are in an early stage of developing overweight due to switching from a healthy nutrition to a hyper-caloric fat-rich diet. It is the prevailing opinion that prevention of insulin resistance must start at the level of the ‘healthy’ individual (Misra & Khurana, 2008). In this regard, our findings indicate that fasting exercise might be a useful ingredient within a global preventive strategy including dietary changes and physical activity interventions. However, long-term efficacy of regular training in the fasted state in the prevention and treatment of insulin resistance and type 2 diabetes remains to be elucidated.
In conclusion, it is well established that endurance exercise is an effective strategy to prevent muscular insulin resistance. In this study we administered a hyper-caloric HFD to healthy subjects and demonstrated for the first time that early morning exercise in the fasted state is more potent than an identical amount of exercise in the fed state to improve whole-body glucose tolerance, as well as to induce beneficial adaptations in muscle cells that eventually may contribute to improved peripheral insulin sensitivity.
Acknowledgments
The authors thank all subjects for participating in this study. The authors would also like to thank Monique Ramaekers, Research Centre for Exercise and Health, Department of Biomedical Kinesiology, K.U. Leuven, for researching data and supervising the training sessions. The authors thank Raf Van Dyck and Marina Goris, Research Centre for Exercise and Health, Department of Biomedical Kinesiology, K.U. Leuven, for the assistance with the dietary analyses and the skinfold measurements respectively, and Katrien De Bock, Vesalius Research Center (VRC), K.U. Leuven for providing excellent advice. Furthermore, the skilful technical support by Esther Moonen-Kornips, NUTRIM School for Nutrition, Toxicology and Metabolism, Department of Human Movement Sciences, Maastricht University Medical Centre, in performing the enzymatic assays is greatly acknowledged. This study was supported by grant OT/05/53 from the Katholieke Universiteit Leuven, grant G.0233.05 F from the Fund for Scientific Research-Flanders, Belgium (F.W.O.-Vlaanderen) and grant G.05814.09N to P.P.V.V (F.W.O.-Vlaanderen). There are no conflicts of interest.
Glossary
Abbreviations
- AMPK
AMP-activated protein kinase α
- AUCgluc
area under the glucose curve
- β-HAD
β-hydroxyacyl coenzyme A dehydrogenase
- COX
cytochrome c oxidase
- CPT1
carnitine palmitoyltransferase 1
- CS
citrate synthase
- FAT/CD36
fatty acid translocase/CD36
- FATmax
maximal rate of fat oxidation
- (F)FA
(free) fatty acid
- HFD
high-fat diet
- IMCL
intramyocellular lipid
- ISI
insulin sensitivity index
- OGTT
oral glucose tolerance test
Author contributions
K.V.P.: conception and design of the experiments; collection, analysis and interpretation of data; drafting the article. K.S.: collection, analysis and interpretation of data; revising the article. H.N.: collection of data; revising the article. K.P.: collection and analysis of data; revising the article. L.D.: analysis and interpretation of data; revising the article. M.H.: analysis of data; revising the article. P.P.V.: analysis of data; revising the article. P.H.: conception and design of the experiments; interpretation of data; drafting the article. All tests were performed at the K.U.Leuven. All authors approved the final version of the manuscript.
References
- Achten J, Gleeson M, Jeukendrup AE. Determination of the exercise intensity that elicits maximal fat oxidation. Med Sci Sports Exerc. 2002;34:92–97. doi: 10.1097/00005768-200201000-00015. [DOI] [PubMed] [Google Scholar]
- Adochio R, Leitner J, Gray K, Draznin B, Cornier MA. Early responses of insulin sensitivity to high-carbohydrate and high-fat overfeeding. Nutr Metab. 2009;6:37. doi: 10.1186/1743-7075-6-37. [DOI] [PMC free article] [PubMed] [Google Scholar]
- Akerstrom TCA, Birk JB, Klein DK, Erikstrup C, Plomgaard P, Pedersen BK, Wojtaszewski JF. Oral glucose ingestion attenuates exercise-induced activation of 5′-AMP-activated protein kinase in human skeletal muscle. Biochem Biophys Res Commun. 2006;342:949–955. doi: 10.1016/j.bbrc.2006.02.057. [DOI] [PubMed] [Google Scholar]
- Akerstrom TCA, Fischer CP, Plomgaard P, Thomsen C, van Hall G, Pedersen BK. Glucose ingestion during endurance training does not alter adaptation. J Appl Physiol. 2009;106:1771–1779. doi: 10.1152/japplphysiol.91534.2008. [DOI] [PubMed] [Google Scholar]
- Bachmann OP, Dahl DB, Brechtel K, Machann J, Haap M, Maier T, Loviscach M, Stumvoll M, Claussen CD, Schick F, Haring HU, Jacob S. Effects of intravenous and dietary lipid challenge on intramyocellular lipid content and the relation with insulin sensitivity in humans. Diabetes. 2001;50:2579–2584. doi: 10.2337/diabetes.50.11.2579. [DOI] [PubMed] [Google Scholar]
- Bennard P, Doucet E. Acute effects of exercise timing and breakfast meal glycemic index on exercise-induced fat oxidation. Appl Physiol Nutr Metab. 2006;31:502–511. doi: 10.1139/h06-027. [DOI] [PubMed] [Google Scholar]
- Bonen A, Holloway GP, Tandon NN, Han XX, McFarlan JT, Glatz JFC, Luiken JJFP. Cardiac and skeletal muscle fatty acid transport and transporters, triacylglycerol and fatty acid oxidation in lean and zucker diabetic fatty (ZDF) rats. Am J Physiol Regul Integr Comp Physiol. 2009;297:R1202–R1212. doi: 10.1152/ajpregu.90820.2008. [DOI] [PubMed] [Google Scholar]
- Bruce CR, Hoy AJ, Turner N, Watt MJ, Allen TL, Carpenter K, Cooney GJ, Febbraio MA, Kraegen EW. Overexpression of carnitine palmitoyltransferase-1 in skeletal muscle is sufficient to enhance fatty acid oxidation and improve high-fat diet-induced insulin resistance. Diabetes. 2009;58:550–558. doi: 10.2337/db08-1078. [DOI] [PMC free article] [PubMed] [Google Scholar]
- Bruce CR, Thrush AB, Mertz VA, Bezaire V, Chabowski A, Heigenhauser GJF, Dyck DJ. Endurance training in obese humans improves glucose tolerance and mitochondrial fatty acid oxidation and alters muscle lipid content. Am J Physiol Endocrinol Metab. 2006;291:E99–107. doi: 10.1152/ajpendo.00587.2005. [DOI] [PubMed] [Google Scholar]
- Bruce RA, Blackmon JR, Jones JW, Strait G. Exercising testing in adult normal subjects and cardiac patients. Pediatrics. 1963;32(Suppl):742–756. [PubMed] [Google Scholar]
- Canto C, Jiang LQ, Deshmukh AS, Mataki C, Coste A, Lagouge M, Zierath JR, Auwerx J. Interdependence of AMPK and SIRT1 for metabolic adaptation to fasting and exercise in skeletal muscle. Cell Metabolism. 2010;11:213–219. doi: 10.1016/j.cmet.2010.02.006. [DOI] [PMC free article] [PubMed] [Google Scholar]
- Civitarese AE, Hesselink MKC, Russell AP, Ravussin E, Schrauwen P. Glucose ingestion during exercise blunts exercise-induced gene expression of skeletal muscle fat oxidative genes. Am J Physiol Endocrinol Metab. 2005;289:E1023–E1029. doi: 10.1152/ajpendo.00193.2005. [DOI] [PubMed] [Google Scholar]
- Cluberton LJ, McGee SL, Murphy RM, Hargreaves M. Effect of carbohydrate ingestion on exercise-induced alterations in metabolic gene expression. J Appl Physiol. 2005;99:1359–1363. doi: 10.1152/japplphysiol.00197.2005. [DOI] [PubMed] [Google Scholar]
- De Bock K, Richter EA, Russell AP, Eijnde BO, Derave W, Ramaekers M, Koninckx E, Leger B, Verhaeghe J, Hespel P. Exercise in the fasted state facilitates fibre type-specific intramyocellular lipid breakdown and stimulates glycogen resynthesis in humans. J Physiol. 2005;564:649–660. doi: 10.1113/jphysiol.2005.083170. [DOI] [PMC free article] [PubMed] [Google Scholar]
- De Bock K, Derave W, Eijnde BO, Hesselink MKC, Koninckx E, Rose AJ, Schrauwen P, Bonen A, Richter EA, Hespel PJ. Effect of training in the fasted state on metabolic responses during exercise with carbohydrate intake. J Appl Physiol. 2008;104:1045–1055. doi: 10.1152/japplphysiol.01195.2007. [DOI] [PubMed] [Google Scholar]
- DeFronzo RA, Ferrannini E, Sato Y, Felig P, Wahren J. Synergistic interaction between exercise and insulin on peripheral glucose uptake. J Clin Invest. 1981;68:1468–1474. doi: 10.1172/JCI110399. [DOI] [PMC free article] [PubMed] [Google Scholar]
- den Hoed M, Hesselink MKC, van Kranenburg GPJ, Westerterp KR. Habitual physical activity in daily life correlates positively with markers for mitochondrial capacity. J Appl Physiol. 2008;105:561–568. doi: 10.1152/japplphysiol.00091.2008. [DOI] [PubMed] [Google Scholar]
- Dube JJ, Amati F, Stefanovic-Racic M, Toledo F, Sauers SE, Goodpaster BH. Exercise-induced alterations in intramyocellular lipids and insulin resistance: the athlete's paradox revisited. Am J Physiol Endocrinol Metab. 2008;294:E882–E888. doi: 10.1152/ajpendo.00769.2007. [DOI] [PMC free article] [PubMed] [Google Scholar]
- Fluck M. Functional, structural and molecular plasticity of mammalian skeletal muscle in response to exercise stimuli. J Exp Biol. 2006;209:2239–2248. doi: 10.1242/jeb.02149. [DOI] [PubMed] [Google Scholar]
- Goodpaster BH, He J, Watkins S, Kelley DE. Skeletal muscle lipid content and insulin resistance: evidence for a paradox in endurance-trained athletes. J Clin Endocrinol Metab. 2001;86:5755–5761. doi: 10.1210/jcem.86.12.8075. [DOI] [PubMed] [Google Scholar]
- Hancock CR, Han DH, Chen M, Terada S, Yasuda T, Wright DC, Holloszy JO. High-fat diets cause insulin resistance despite an increase in muscle mitochondria. Proc Natl Acad Sci U S A. 2008;105:7815–7820. doi: 10.1073/pnas.0802057105. [DOI] [PMC free article] [PubMed] [Google Scholar]
- Hansen AK, Fischer CP, Plomgaard P, Andersen JL, Saltin B, Pedersen BK. Skeletal muscle adaptation: training twice every second day vs. training once daily. J Appl Physiol. 2005;98:93–99. doi: 10.1152/japplphysiol.00163.2004. [DOI] [PubMed] [Google Scholar]
- Helge JW, Watt PW, Richter EA, Rennie MJ, Kiens B. Fat utilization during exercise: adaptation to a fat-rich diet increases utilization of plasma fatty acids and very low density lipoprotein-triacylglycerol in humans. J Physiol. 2001;537:1009–1020. doi: 10.1111/j.1469-7793.2001.01009.x. [DOI] [PMC free article] [PubMed] [Google Scholar]
- Holloway GP, Benton CR, Mullen KL, Yoshida Y, Snook LA, Han XX, Glatz JFC, Luiken JJFP, Lally J, Dyck DJ, Bonen A. In obese rat muscle transport of palmitate is increased and is channeled to triacylglycerol storage despite an increase in mitochondrial palmitate oxidation. Am J Physiol Endocrinol Metab. 2009;296:E738–E747. doi: 10.1152/ajpendo.90896.2008. [DOI] [PubMed] [Google Scholar]
- Jager S, Handschin C, Pierre J, Spiegelman BM. AMP-activated protein kinase (AMPK) action in skeletal muscle via direct phosphorylation of PGC-1a. Proc Natl Acad Sci U S A. 2007;104:12017–12022. doi: 10.1073/pnas.0705070104. [DOI] [PMC free article] [PubMed] [Google Scholar]
- Jensen TE, Wojtaszewski JF, Richter EA. AMP-activated protein kinase in contraction regulation of skeletal muscle metabolism: necessary and/or sufficient? Acta Physiol Scand. 2009;196:155–174. doi: 10.1111/j.1748-1716.2009.01979.x. [DOI] [PubMed] [Google Scholar]
- Jorgensen SB, Treebak JT, Viollet B, Schjerling P, Vaulont S, Wojtaszewski JFP, Richter EA. Role of AMPKα2 in basal, training-, and AICAR-induced GLUT4, hexokinase II, and mitochondrial protein expression in mouse muscle. Am J Physiol Endocrinol Metab. 2007;292:E331–E339. doi: 10.1152/ajpendo.00243.2006. [DOI] [PubMed] [Google Scholar]
- Koves TR, Ussher JR, Noland RC, Slentz D, Mosedale M, Ilkayeva O, Bain J, Stevens R, Dyck JR, Newgard CB, Lopaschuk GD, Muoio DM. Mitochondrial overload and incomplete fatty acid oxidation contribute to skeletal muscle insulin resistance. Cell Metab. 2008;7:45–56. doi: 10.1016/j.cmet.2007.10.013. [DOI] [PubMed] [Google Scholar]
- Koves TR, Li P, An J, Akimoto T, Slentz D, Ilkayeva O, Dohm GL, Yan Z, Newgard CB, Muoio DM. Peroxisome proliferator-activated receptor-γ co-activator 1α-mediated metabolic remodeling of skeletal myocytes mimics exercise training and reverses lipid-induced mitochondrial inefficiency. J Biol Chem. 2005;280:33588–33598. doi: 10.1074/jbc.M507621200. [DOI] [PubMed] [Google Scholar]
- Kraegen EW, Cooney GJ, Turner N. Muscle insulin resistance: A case of fat overconsumption, not mitochondrial dysfunction. Proc Natl Acad Sci U S A. 2008;105:7627–7628. doi: 10.1073/pnas.0803901105. [DOI] [PMC free article] [PubMed] [Google Scholar]
- Lee-Young RS, Palmer MJ, Linden KC, LePlastrier K, Canny BJ, Hargreaves M, Wadley GD, Kemp BE, McConell GK. Carbohydrate ingestion does not alter skeletal muscle AMPK signaling during exercise in humans. Am J Physiol Endocrinol Metab. 2006;291:E566–E573. doi: 10.1152/ajpendo.00023.2006. [DOI] [PubMed] [Google Scholar]
- Liu L, Zhang Y, Chen N, Shi X, Tsang B, Yu Y. Upregulation of myocellular DGAT1 augments triglyceride synthesis in skeletal muscle and protects against fat-induced insulin resistance. J Clin Invest. 2007;117:1679–1689. doi: 10.1172/JCI30565. [DOI] [PMC free article] [PubMed] [Google Scholar]
- Lowry OH, Passoneau JV. A Flexible System of Enzymatic Analysis. New York: Academic Press; 1972. [Google Scholar]
- Maarbjerg SJ, Jorgensen SB, Rose AJ, Jeppesen J, Jensen TE, Treebak JT, Birk JB, Schjerling P, Wojtaszewski JFP, Richter EA. Genetic impairment of AMPKα2 signaling does not reduce muscle glucose uptake during treadmill exercise in mice. Am J Physiol Endocrinol Metab. 2009;297:E924–E934. doi: 10.1152/ajpendo.90653.2008. [DOI] [PubMed] [Google Scholar]
- Matsuda M, DeFronzo RA. Insulin sensitivity indices obtained from oral glucose tolerance testing: comparison with the euglycemic insulin clamp. Diabetes Care. 1999;22:1462–1470. doi: 10.2337/diacare.22.9.1462. [DOI] [PubMed] [Google Scholar]
- McConell G, Snow RJ, Proietto J, Hargreaves M. Muscle metabolism during prolonged exercise in humans: influence of carbohydrate availability. J Appl Physiol. 1999;87:1083–1086. doi: 10.1152/jappl.1999.87.3.1083. [DOI] [PubMed] [Google Scholar]
- Misra A, Khurana L. Obesity and the metabolic syndrome in developing countries. J Clin Endocrinol Metab. 2008;93:s9–30. doi: 10.1210/jc.2008-1595. [DOI] [PubMed] [Google Scholar]
- Moro C, Bajpeyi S, Smith S. Determinants of intramyocellular triglyceride turnover: Implications for insulin sensitivity. Am J Physiol Endocrinol Metab. 2007;294:E203–E213. doi: 10.1152/ajpendo.00624.2007. [DOI] [PubMed] [Google Scholar]
- Morton JP, Croft L, Bartlett JD, MacLaren DPM, Reilly T, Evans L, McArdle A, Drust B. Reduced carbohydrate availability does not modulate training-induced heat shock protein adaptations but does upregulate oxidative enzyme activity in human skeletal muscle. J Appl Physiol. 2009;106:1513–1521. doi: 10.1152/japplphysiol.00003.2009. [DOI] [PubMed] [Google Scholar]
- Murgia M, Jensen TE, Cusinato M, Garcia M, Richter EA, Schiaffino S. Multiple signalling pathways redundantly control glucose transporter GLUT4 gene transcription in skeletal muscle. J Physiol. 2009;587:4319–4327. doi: 10.1113/jphysiol.2009.174888. [DOI] [PMC free article] [PubMed] [Google Scholar]
- Nybo L, Pedersen K, Christensen B, Aagaared P, Brandt N, Kiens B. Impact of carbohydrate supplementation during endurance training on glycogen storage and performance. Acta Physiologica. 2009;197:117–127. doi: 10.1111/j.1748-1716.2009.01996.x. [DOI] [PubMed] [Google Scholar]
- Oakes ND, Cooney GJ, Camilleri S, Chisholm DJ, Kraegen EW. Mechanisms of liver and muscle insulin resistance induced by chronic high-fat feeding. Diabetes. 1997;46:1768–1774. doi: 10.2337/diab.46.11.1768. [DOI] [PubMed] [Google Scholar]
- Ojuka EO, Jones TE, Nolte LA, Chen M, Wamhoff BR, Sturek M, Holloszy JO. Regulation of GLUT4 biogenesis in muscle: evidence for involvement of AMPK and Ca2+ Am J Physiol Endocrinol Metab. 2002;282:E1008–E1013. doi: 10.1152/ajpendo.00512.2001. [DOI] [PubMed] [Google Scholar]
- Pan DA, Lillioja S, Kriketos AD, Baur LA, Bogardus C, Jenkins AB. Skeletal muscle triglyceride levels are inversely related to insulin action. Diabetes. 1997;46:983–988. doi: 10.2337/diab.46.6.983. [DOI] [PubMed] [Google Scholar]
- Schenk S. Acute exercise increases triglyceride synthesis in skeletal muscle and prevents fatty acid-induced insulin resistance. J Clin Invest. 2007;117:1690–1698. doi: 10.1172/JCI30566. [DOI] [PMC free article] [PubMed] [Google Scholar]
- Schrauwen-Hinderling VB, Kooi ME, Hesselink MK, Moonen-Kornips E, Schaart G, Mustard KJ, Hardie DG, Saris WH, Nicolay K, Schrauwen P. Intramyocellular lipid content and molecular adaptations in response to a 1-week high-fat diet. Obes Res. 2005;13:2088–2094. doi: 10.1038/oby.2005.259. [DOI] [PubMed] [Google Scholar]
- Spencer MK, Yan Z, Katz A. Carbohydrate supplementation attenuates IMP accumulation in human muscle during prolonged exercise. Am J Physiol Cell Physiol. 1991;261:C71–C76. doi: 10.1152/ajpcell.1991.261.1.C71. [DOI] [PubMed] [Google Scholar]
- Stannard SR, Buckley AJ, Edge JA, Thompson MW. Adaptations to skeletal muscle with endurance exercise training in the acutely fed versus overnight-fasted state. J Sci Med Sport. 2010;13:465–469. doi: 10.1016/j.jsams.2010.03.002. [DOI] [PubMed] [Google Scholar]
- Storlien LH, James DE, Burleigh KM, Chisholm DJ, Kraegen EW. Fat feeding causes widespread in vivo insulin resistance, decreased energy expenditure, and obesity in rats. Am J Physiol Endocrinol Metab. 1986;251:E576–E583. doi: 10.1152/ajpendo.1986.251.5.E576. [DOI] [PubMed] [Google Scholar]
- Summers SA. Ceramides in insulin resistance and lipotoxicity. Prog Lipid Res. 2006;45:42–72. doi: 10.1016/j.plipres.2005.11.002. [DOI] [PubMed] [Google Scholar]
- Timmers S, Schrauwen P, de Vogel J. Muscular diacylglycerol metabolism and insulin resistance. Physiol Behav. 2008;94:242–251. doi: 10.1016/j.physbeh.2007.12.002. [DOI] [PubMed] [Google Scholar]
- Tsao TS, Burcelin R, Katz EB, Huang L, Charron MJ. Enhanced insulin action due to targeted GLUT4 overexpression exclusively in muscle. Diabetes. 1996;45:28–36. doi: 10.2337/diab.45.1.28. [DOI] [PubMed] [Google Scholar]
- Turcotte LP, Richter EA, Kiens B. Increased plasma FFA uptake and oxidation during prolonged exercise in trained vs. untrained humans. Am J Physiol Endocrinol Metab. 1992;262:E791–E799. doi: 10.1152/ajpendo.1992.262.6.E791. [DOI] [PubMed] [Google Scholar]
- Turner N, Bruce CR, Beale SM, Hoehn KL, So T, Rolph MS, Cooney GJ. Excess lipid availability increases mitochondrial fatty acid oxidative capacity in muscle: evidence against a role for reduced fatty acid oxidation in lipid-induced insulin resistance in rodents. Diabetes. 2007;56:2085–2092. doi: 10.2337/db07-0093. [DOI] [PubMed] [Google Scholar]
- Van Veldhoven PP, Bell RM. Effect of harvesting methods, growth conditions and growth phase on diacylglycerol levels in cultured human adherent cells. Biochim Biophys Acta. 1988;959:185–196. doi: 10.1016/0005-2760(88)90030-6. [DOI] [PubMed] [Google Scholar]
- Van Veldhoven PP, Bishop WR, Yurivich YA, Bell RM. Ceramide quantitation: Evaluation of a mixed micellar assay using E. coli diacylglycerol kinase. Biochem Molec Biol Intern. 1995;36:21–30. [PubMed] [Google Scholar]
- Van Veldhoven PP, Matthews TJ, Bolognesi DP, Bell RM. Changes in bioactive lipids, alkylacylglycerol and ceramide, occur in HIV-infected cells. Biochem Biophys Res Commun. 1992;187:216. doi: 10.1016/s0006-291x(05)81480-9. [DOI] [PubMed] [Google Scholar]
- Vandesompele J, De Preter K, Pattyn F, Poppe B, Van Roy N, De Paepe A, Speleman F. Accurate normalization of real-time quantitative RT-PCR data by geometric averaging of multiple internal control genes. Genome Biol. 2002;3:RESEARCH0034. doi: 10.1186/gb-2002-3-7-research0034. [DOI] [PMC free article] [PubMed] [Google Scholar]
- Winder WW. Energy-sensing and signaling by AMP-activated protein kinase in skeletal muscle. J Appl Physiol. 2001;91:1017–1028. doi: 10.1152/jappl.2001.91.3.1017. [DOI] [PubMed] [Google Scholar]
- Winder WW, Holmes BF, Rubink DS, Jensen EB, Chen M, Holloszy JO. Activation of AMP-activated protein kinase increases mitochondrial enzymes in skeletal muscle. J Appl Physiol. 2000;88:2219–2226. doi: 10.1152/jappl.2000.88.6.2219. [DOI] [PubMed] [Google Scholar]
- Yeo WK, Paton CD, Garnham AP, Burke LM, Carey AL, Hawley JA. Skeletal muscle adaptation and performance responses to once a day versus twice every second day endurance training regimens. J Appl Physiol. 2008;105:1462–1470. doi: 10.1152/japplphysiol.90882.2008. [DOI] [PubMed] [Google Scholar]
- Zimmet P, Alberti KG, Shaw J. Global and societal implications of the diabetes epidemic. Nature. 2001;414:782–787. doi: 10.1038/414782a. [DOI] [PubMed] [Google Scholar]
- Zisman A, Peroni OD, Abel ED, Michael MD, Mauvais-Jarvis F, Lowell BB, Wojtaszewski JFP, Hirshman MF, Virkamaki A, Goodyear LJ, Kahn CR, Kahn BB. Targeted disruption of the glucose transporter 4 selectively in muscle causes insulin resistance and glucose intolerance. Nat Med. 2000;6:924–928. doi: 10.1038/78693. [DOI] [PubMed] [Google Scholar]