

Abstract
Our aim was to evaluate the interaction between breast cancer cells and nodal fibroblasts, by means of their gene expression profile. Fibroblast primary cultures were established from negative and positive lymph nodes from breast cancer patients and a similar gene expression pattern was identified, following cell culture. Fibroblasts and breast cancer cells (MDA-MB231, MDA-MB435, and MCF7) were cultured alone or co-cultured separated by a porous membrane (which allows passage of soluble factors) for comparison. Each breast cancer lineage exerted a particular effect on fibroblasts viability and transcriptional profile. However, fibroblasts from positive and negative nodes had a parallel transcriptional behavior when co-cultured with a specific breast cancer cell line. The effects of nodal fibroblasts on breast cancer cells were also investigated. MDA MB-231 cells viability and migration were enhanced by the presence of fibroblasts and accordingly, MDA-MB435 and MCF7 cells viability followed a similar pattern. MDA-MB231 gene expression profile, as evaluated by cDNA microarray, was influenced by the fibroblasts presence, and HNMT, COMT, FN3K, and SOD2 were confirmed downregulated in MDA-MB231 co-cultured cells with fibroblasts from both negative and positive nodes, in a new series of RT-PCR assays. In summary, transcriptional changes induced in breast cancer cells by fibroblasts from positive as well as negative nodes are very much alike in a specific lineage. However, fibroblasts effects are distinct in each one of the breast cancer lineages, suggesting that the inter-relationships between stromal and malignant cells are dependent on the intrinsic subtype of the tumor.
Electronic supplementary material
The online version of this article (doi:10.1007/s13277-010-0108-7) contains supplementary material, which is available to authorized users.
Keywords: Breast cancer, Epithelial mesenchymal interaction, Gene expression profile, Lymph node metastasis, Stromal fibroblasts
Introduction
In breast cancer primary tumor, a desmoplastic reaction usually arises, creating a suitable microenvironment for a cross-talk between stromal fibroblasts and malignant cells. A few studies have explored the epithelial–mesenchymal interactions through co-culture systems and their results suggest that fibroblasts originated from normal tissue tend to inhibit, contrary to fibroblasts obtained from tumors, which tend to induce, epithelial cell proliferation. In addition, it seems likely that direct contact between these cell types or soluble factors secreted by them may differentially interfere with epithelial cell proliferation [1–4]. Furthermore, fibroblasts may also promote cancer cell invasion [5–7].
In animal models, fibroblasts may induce tumor development when injected together with breast cancer cells [8, 9], particularly if the fibroblasts themselves were obtained from a breast tumor [7, 10]. In addition, fibroblasts transfected with growth factors as TGFβ and/or HGF, may promote breast cancer formation, when injected with apparently normal breast cells, indicating that they may be adjunct factors involved in transformation of initiated cells into fully malignant cells [11].
The effects of stromal–epithelial interactions in tumor progression were also demonstrated in specimens from breast cancer patients where stromal cells derived from the tumor primary site, harboring genomic alterations, including somatic TP53 mutations, were shown to influence clinical outcome in sporadic disease [12].
Stromal–epithelial cell interactions also take place in the involved lymph nodes, where some carcinoma cells may attach and grow, in contrast with others that are not capable of establishing regional metastases. It was shown that the conditioned medium obtained from stromal cell lines, established from normal rat lymph nodes, may induce proliferation of human breast carcinoma cells, mediated through the secretion of growth factors as IGF-I and EGF [13]. In addition, in a xenograft breast cancer model, gene expression and consequently tumor behavior were specifically influenced by the neighboring lymph node host cells [14]. However, this issue was not totally addressed, as yet.
Herein, to have a better insight on the role of nodal fibroblasts on metastasis development, we have studied the interaction between the epithelial malignant compartment and fibroblasts from involved and uninvolved axillary lymph nodes, obtained from breast cancer patients, by means of their gene expression profiling.
Patients
This study was performed in accordance with the Declaration of Helsinki (1964) and was approved by the Institutional Ethics Committee. Fourteen patients with breast cancer [Table 1, six without any involved nodes (patients 1–6) and eight with histopathologically confirmed involved nodes (patients 7–14)] agreed to take part in the study and signed the informed consent. Patients were treated at Instituto Brasileiro de Controle do Câncer, IBCC, São Paulo, Brazil.
Table 1.
Patients characteristics
| Patients | Age | TNM | HT | LN(+)/LN | ER | PR | ErbB2 |
|---|---|---|---|---|---|---|---|
| 1a | 43 | T2N0M0 | ILC | 0/13 | + | + | − |
| 2a | 44 | T2N0M0 | ILC | 0/29 | + | + | − |
| 3a | 74 | T1N0M0 | IDC | 0/28 | + | + | − |
| 4 | 42 | T3N0M0 | IDC | 0/22 | + | + | − |
| 5 | 60 | T2N0M0 | ILC | 0/27 | − | + | − |
| 6 | 41 | T1N0M0 | IDC | 0/10 | + | + | − |
| 7 | 47 | T2N1M0 | IDC | 3/19 | + | + | + |
| 8a | 49 | T1N2M0 | IDC | 6/25 | + | + | + |
| 9a | 59 | T2N3M0 | ILC | 13/27 | − | + | − |
| 10a | 41 | T2N3M0 | IDC | 10/19 | − | + | − |
| 11 | 70 | T2N2M0 | IDC | 5/15 | − | − | − |
| 12 | 65 | T1N1M0 | IDC | 2/18 | − | − | − |
| 13 | 81 | T2N3M0 | IDC | 12/16 | + | − | + |
| 14 | 40 | T2N1M0 | IDC | 2/19 | − | + | − |
TNM (AJCC, 2002)
HT histologycal type, IDC invasive ductal carcinoma, ILC invasive lobular carcinoma, ER estrogen receptor, PR progesterone receptor, LN(+)/LN number of involved lymph nodes/dissected, LN (+) positive immuno-expression, (−) negative immuno-expression
aSamples used in cDNA microarray experiments
Methods
Cell culture
Lymph node samples were obtained during mammary surgery and axillary lymphadenectomy (Table 1). Samples from negative nodes were obtained from patients without any involved nodes and samples from positive nodes were obtained from a histopathologicaly confirmed involved node.
Lymph node samples were cut into small pieces and fibroblast primary culture was established through the explant methodology. After three cell passages, mesenchymal origin of the cells was confirmed by their spindle cell morphology and positive expression of vimentin [mouse anti-human vimentin monoclonal antibody, clone Vim 3b4 (1:200); DAKO Corporation, Carpinteria, CA, USA] and alpha smooth muscle actin [mouse monoclonal antibody anti-human alpha smooth muscle actin, clone M0635 (1:200); DAKO] and negative expression of cytokeratin [mouse monoclonal antibody anti-human cytokeratin clone AE1/AE3 (1:100); DAKO] by immunocytochemistry (data not shown).
At first, three fibroblast samples from uninvolved nodes and three from involved nodes (patients 1–3 and 8–10, respectively, Table 1) were selected for cell culture and gene expression analysis by cDNA microarray. Afterwards, samples from all the patients (including new batches of the six samples previously analyzed) were cultured and had the expression of selected genes analyzed by real-time reverse transcription–polymerase chain reaction (RT-PCR).
MDA-MB 231, MCF-7, and MDA-MB435 breast cancer cells were acquired from American Type Culture Collection (Manassas, Virginia, USA). HB4A immortalized human mammary epithelial cells were donated by Drs. Mike O’Hare and Alan Mackay (Ludwig Institute for Cancer Research, London, UK). Phenotype of the cell lines was verified by real-time RT-PCR and MCF7 cells were estrogen receptor alpha (ER) positive and ErbB2 negative; MDA-MB231 and MDA-MB435 cells were both ER negative and ErbB2 negative, confirming lineage fidelity.
Proliferation rate was evaluated using the Cell Proliferation Reagent WST-1 kit (Roche Applied Science, Basel, Switzerland) or Thiazolyl Blue Tetrazolium Bromide (MTT, Sigma).
Co-culture assays were performed in plates of six wells with 9.6 cm2 area (Becton Dickinson, New Jersey, NJ, USA) and 1.34 × 10⁵ epithelial cells were plated on the surface of each well. Culture conditions were 3 mL 1:1 Ham’s F-12 (Cultilab, Campinas, SP, Brazil) and Dulbecco’s (Gibco, Grand Island, NY, USA) supplemented with horse serum 5% (Gibco), EGF 20 ng/mL (Sigma–Aldrich), cholera toxin 100 ng/mL (Calbiochem, Darmstadt, Germany), bovine insulin 0.01 mg/mL (Sigma), and hydrocortisone 500 ng/ml (Sigma). After 24 h, 4 × 10⁴ fibroblasts were seeded on 0.4-μm porous membrane inserts with 4.2 cm2 area (Becton Dickinson), which were placed into the well. The same culture conditions were maintained, and after 72 h, epithelial cells and fibroblasts were harvested separately. This culture medium was utilized in all assays (mono-culture and co-culture), in order to allow a future comparison between these results (fibroblasts obtained from lymph nodes co-cultured with MDA-MB231 cells) with other results from our group (fibroblasts obtained from the primary tumor site co-cultured with normal and malignant epithelial breast cells) [15].
Transwell migration assay
MDA-MB231 cells were cultured alone or co-cultured with fibroblasts in plates of six wells with 9.6 cm2 area and porous membrane (0.4 μm) inserts with 4.2 cm2 area, as described above. MDA-MB231 cells were plated on the bottom of the well and after 24 h, fibroblasts were placed on the inserts. After a 72-h period (without or with fibroblasts on the inserts), MDA-MB231 cells contained on the surface of each well and fibroblasts on the membrane inserts were recovered by trypsinization and used in Transwell migration assays, carried out in 24-well tissue plates and Transwell filters, 8.0 μm pore polycarbonate membrane insert (Costar-Corning Inc, NY, USA). Membranes were previously incubated for 24 h at 37°C with conditioned medium from co-culture assays or with medium from MDA-MB231 cells cultured alone for 72 h. Fibroblasts were placed on the surface of each well and after a 2-h rest period for adhesion, MDA-MB231 cells were placed on the membrane inserts. Conditioned medium was added and after 12 h, cells contained on the inserts were fixed with 4% paraformaldehyde in PBS. Cells were then removed from the upper chamber with a cotton swab and the membrane was stained using Toluidine Blue 1%. MDA-MB231 cells contained in 20 optic microscopic fields (×200) were counted on each filter.
cDNA microarray hybridization and analysis
A cDNA microarray platform containing 4,608 open reading frame expressed sequence tags (ORESTES) [16] was assembled at the Ludwig Institute for Cancer Research, São Paulo, Brazil. ORESTES privileges the central part of mRNA molecules and selection of those to be spotted on the slides followed all the following criteria: (1) cDNA clones representing full length genes; (2) >300 bp and a high quality sequence (CG content); (3) 100-bp region with gene identity >85% as verified on the site http://ncbi.nlm.nih.gov/Blast; and (4) cDNA clone closer to the 3′ sequence. cDNA clones were derived from human breast, colon, stomach, and head and neck tumors. These sequences could be classified among 505 function categories (biological process). Another 192 reference sequences were included as positive and negative controls of hybridization. Platform characteristics complying with MIAME format may be verified in the Gene Expression Omnibus (GEO) data repository, under accession number GPL 1930 (www.ncbi.nlm.nih.gov/projects/geo). This platform was used in earlier works by our group [15, 17–20], with consistent results.
Samples (fibroblasts or MDA-MB231 cells) obtained from cell culture, had their total RNA isolated using Trizol reagent (Invitrogen Corporation, Carlsbad, CA, USA). RNA quality and integrity was verified by the Absorbance A260/280, which was >1.8, and through observation of 28S/18S rRNA on agarose gel (1%) electrophoresis in denaturant conditions (ratio > 1.5). A two-round RNA amplification procedure carried out by combining antisense RNA amplification with a template-switching effect followed. Three to 5 μg of amplified RNA were then used in a reverse transcriptase reaction in the presence of Cy3- or Cy5-labeled dCTP (Amersham Biosciences, Sydney, Australia). HB4A cells were used as reference for hybridizations.
Equal amounts of target samples and HB4A cDNA-labeled probes were concurrently hybridized against cDNA microarray slides. Dye swap was performed for each sample analyzed, to control for dye bias. Pre-hybridization was carried out in a humidified chamber at 42°C for 16–20 h and hybridization at 65°C in a GeneTac hybridization station (Genome Solutions, Ann Arbor, MI, USA).
Hybridized arrays were scanned on a confocal laser scanner (Arrayexpress, Packard BioScience Company, Boston, MA, USA), using identical photomultiplier voltage for all slides and data recovered by QuantArray software (Packard BioScience Company), using histogram methods. Saturated spots (signal intensity > 63,000) as well as low-intensity spots (within the 95% percentile of intensity distribution of known empty spots) were removed from the analysis. Average signal intensity between technical replicates was determined for each spotted sequence. Quantified signals were then submitted to log transformation and to Lowess normalization. Reproducibility of hybridization results was revealed by a high correlation index (>0.85) between quantified signals of dye swap samples. All replicates clustered together in dendrograms reporting suitable correction of the individual dye incorporation efficiency by normalization procedure and high experimental reproducibility.
To analyze gene expression data from fibroblasts co-cultured with MDA MB-231 cells as compared with matched fibroblasts cultured alone, a paired t test was used, to avoid bias due to interindividual differences, and discriminatory genes satisfied an adjusted p value ≤ 0.01 and at least a twofold change of the ratio (co-cultured cells/mono-cultured cells).
To evaluate the differential gene expression between MDA-MB231 cells cultured alone and co-cultured with fibroblasts, Student t test was used and discriminatory genes were those satisfying an adjusted p value ≤ 0.01, false discovery rate [21] (FDR) ≤ 0.01 and a fold change ≥2.
Unsupervised hierarchical clustering based on Euclidean distance and complete linkage was performed using differentially expressed genes. The reliability of the clustering was assessed by Bootstrap technique implemented in TMEV software [22].
Our data were then searched considering the biological processes in which differentially expressed genes were involved against all sequences spotted on the slides (http://vortex.cs.wayne.edu:8080/index.jsp) [23]. A corrected p value < 0.05 was considered significant, if at least three genes involved in that specific function were represented on the slides (reference ≥ 3) and at least two genes were found modulated, in order to avoid artifactual results.
Gene set enrichment analysis (GSEA) method was used to identify whether predefined gene sets might associate with gene expression differences between phenotypes. In this pairwise comparison, all genes are ranked based on signal-to-noise ratio and the alternative hypothesis that rank ordering of distinct pathway members are associated with a specific phenotype is tested [24]. This methodology makes it possible to detect situations where all genes in a predefined set change in a small but coordinated way. Gene sets included in the analysis were from gene ontology annotation at molecular function, cellular component, and biological process. Permutation was based on gene sets, as recommended, due to the small number of samples. A p value < 0.01 was considered significant.
Real-time reverse transcription–polymerase chain reaction
New batches of fibroblasts were thawed for mono-culture or co-culture with three breast cancer cell lines, MDA MB-231, MDA MB-435, and MCF-7, which were also cultured alone. Culture conditions were the same as described previously under co-culture. Cells from two or three consecutive cell passages were recovered and pooled to reduce interferences due to small differences in culture conditions that might not have been controlled.
Selected genes had their expression further evaluated by real-time RT-PCR. Primer sets were designed based on the coding region closer to the 3′ end of the gene using the software Primer3 (http://frodo.wi.mit.edu/cgi-bin/primer3/primer3_www.cgi) (Supplementary Table 1). Sequences present in different exons, preferentially separated by long introns, were selected, according with sequences deposited at http://www.ncbi.nlm.nih.gov/nucleotide. To avoid non-specific product formation, BLAST analysis (www.ncbi.nlm.nih.gov/blast) was carried out. To minimize self- and cross-dimer hairpin formation, homodimer melting temperatures were verified using the program OligoTech version 1.00, Copyright (1995) (Oligos Etc. Inc. & Oligo Therapeutics Inc.).
Total RNA (2 μg) was reverse-transcribed using oligo (dT) primer (GE Healthcare Life Sciences, Little Chalfont, St. Giles, UK) and Superscript III (Invitrogen). Real-time RT-PCR was carried out using SYBR-green I (Sigma) in a Rotor-gene system (Corbett Research, Mortlake, Australia). Reaction conditions were 200 ng cDNA (final volume of 20 μL); 1.25 U Platinum Taq Polymerase (Invitrogen); 1× polymerase buffer (Invitrogen); 2.0 mM MgCl2; 200 μM each dNTP; 15 pmol each primer; 5% DMSO; 0.5 μL BSA 10 mg/mL (Promega Corporation, Madison, USA); and 0.1 μl SYBR® Green I (Sigma; working dilution 1:100). Amplification conditions consisted of denaturation at 95°C for 15 min, followed by 40 cycles denaturation at 94°C for 15 s, annealing at 60°C for 1 min, and extension at 72°C for 1 min. All samples were tested in triplicate and analyzed by the software Rotor-Gene 6 System (Corbett Research). Mean CT values were used for gene expression quantification. A pool of fibroblasts (six samples) or HB4A cells were used, as reference samples, for assays concerning fibroblasts or breast cancer cells, respectively.
Five housekeeping genes (ACTB, GUSB, TFRC, RPLP0, and PPIA) were first tested in ten fibroblast samples (data not shown) and expression of RPLP0, PPIA, and GUSB was the most stable among them. In breast cancer cell lineages expression of RPLP0 and PPIA was found more stable. Expression of the selected genes was then used to calculate a normalization factor for each sample analyzed, using the geNorm software tool [25] (available at http://medgen.ugent.be/∼jvdesomp/genorm/). Relative expression ratio was calculated from the real-time PCR efficiencies and the crossing point deviation of an unknown sample versus a control [26].
Results and discussion
Proliferation and gene expression from fibroblasts from involved and uninvolved nodes
To compare the behavior of fibroblasts from involved and uninvolved nodes, we have analyzed their proliferation and transcriptional profile independently. Primary culture of fibroblasts obtained from involved and uninvolved nodes was established. After the third cell passage, cell viability was equivalent between groups (Supplementary Figure 1), indicating that the key process of cell proliferation was not altered in fibroblasts from involved nodes, which were previously primed by in vivo contact with malignant breast cells, as compared with fibroblasts from uninvolved nodes. In accordance, in a previous work, we detected no differences in the proliferation curves of fibroblasts obtained from benign breast diseases and breast cancer samples [15].
Subsequently, gene expression profile of fibroblasts from positive and negative nodes was evaluated by cDNA microarray and 13 genes were differentially expressed between them (Supplementary Table 2). Seven genes (piggyBac transposable element derived three (PGBD3), PTBP2, HEG, ARRDC3, BCS1L, MRPL22, and AKAP8L) had their expression further evaluated in another set of assays of fibroblast samples obtained from ten patients, five with involved and another five without any involved nodes. For this analysis, new batches of fibroblast samples were thawed and cells recovered from two to three consecutive passages were pooled for RNA extraction. Gene expression was then analyzed by real-time RT-PCR but only PGBD3 was confirmed as more expressed in fibroblasts from positive nodes, as compared with fibroblasts from negative nodes (Mann–Whitney test, p ≤ 0.05, data not shown).
Our data suggest that fibroblasts obtained from both involved and uninvolved nodes present a similar gene expression pattern. This finding might be reflecting fibroblasts activation following cell culture. In addition, we compared the transcriptional profile of fibroblasts obtained from involved nodes (n = 3) and fibroblasts obtained from breast primary tumors (n = 4, analyzed in our previous work) from different patients and no major differences were detected (data nor shown), further confirming this hypothesis. Accordingly, Singer et al. [27], using a similar experimental model to compare fibroblasts from breast cancer and normal breast tissue samples, found just subtle differences on their gene expression profiles.
Effects of breast cancer cells on gene expression of nodal fibroblasts
Our assumption was that the behavior of nodal fibroblasts might be affected by breast cancer cells and to evaluate this aspect, a co-culture model was employed.
At first, co-culture assays of fibroblasts and MDA-MB231 cells were analyzed as a prototype, and nodal fibroblasts from positive nodes (but not from negative nodes) maintained in the presence of these cancer cells showed a proliferative advantage over fibroblasts cultured alone (Fig. 1a).
Fig. 1.
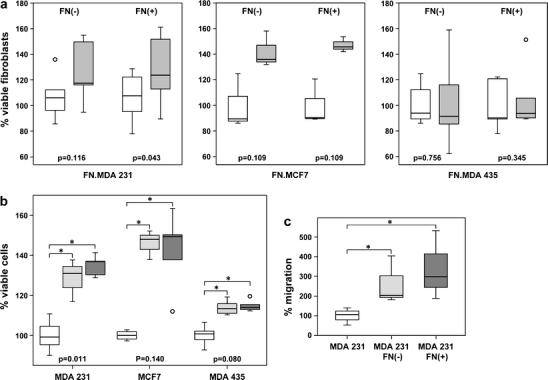
Cell viability and migration ability. a Fibroblasts viability. Fibroblasts from negative nodes [FN(−)] (from three to six different patients) or positive nodes [FN(+)] (from three to five different patients) were cultured alone or co-cultured with MDA-MB231 (n = 5–6), MCF7 (n = 3), or MDA-MB435 cells (n = 5–6) for 72 h. Three to six independent assays were performed in duplicate and viable cells were evaluated using MTT assay. Values observed for fibroblasts co-cultured with breast cancer cells were then normalized to that observed for fibroblasts cultured alone, considering the mean value of the latter as 100%. Percentage of viable fibroblasts are shown on the y-axis. MDA231 increased FN(+) viability in a co-culture system for 72 h. [p value (fibroblast mono-culture vs co-culture) inside the figure: Wilcoxon test]. Box plot displays the distribution of all values between bars (25th, 50th, and 75th quartiles inside the box), except outliers (open circle 1.5–3.0 box lengths from the 75th percentile). White box fibroblasts cultured alone. Gray box fibroblasts co-cultured with breast cancer cells. FN(−).MDA231 (n = 6); FN(+).MDA231 (n = 5); FN(−).MCF7 (n = 3); FN(+).MCF7 (n = 3); FN(−).MDA435 (n = 6); FN(+).MDA435 (n = 5). b Breast cancer cells viability. MDA-MB231 (MDA231), MCF7, and MDA-MB435 (MDA435) cells were cultured alone or co-cultured with fibroblasts from negative or positive nodes for 72 h. Breast cancer cells were plated on the bottom of the well and after 24 h (considered time zero of co-culture), fibroblasts were added to the inserts. Co-culture was carried out for another 72 h and viable cancer cells were evaluated by the MTT assay. Three to six independent experiments were performed in duplicate. The mean optical density value of each breast cancer lineage cultured alone was considered 100%. Values observed for breast cancer cells co-cultured with fibroblasts were then normalized to that observed for breast cancer cells cultured alone and are shown on the y-axis as percentage of viable cancer cells. White box cancer cells mono-culture; light gray box: cancer cells co-cultured with fibroblasts from negative nodes; dark gray box cancer cells co-cultured with fibroblasts from positive nodes. (p value inside the figure; Kruskal–Wallis test; * above the horizontal bracket: p < 0.05; Mann–Whitney test). Breast cancer cells viability is increased upon co-culture with fibroblasts from negative and positive nodes. Breast cancer cells co-cultured with fibroblasts from negative and positive nodes present similar viability (p > 0.05, Mann–Whitney test). c Migration of MDA-MB231 cells. MDA-MB231 cells were cultured alone (MDA231) or co-cultured with fibroblasts from negative [MDA231 FN(−)] or positive nodes [MDA231 FN(+)] from six different patients for 72 h and then used on a transwell migration assay. The number of migrating cells was counted in 20 optical microscopic fields (×200). Values observed for MDA-MB231 cells co-cultured with fibroblasts were then normalized to that observed for MDA-MB231 cells cultured alone, considering the mean value as 100%; * above the horizontal bracket: p = 0.05, Mann–Whitney test. Fibroblasts from negative and positive nodes induce migration of MDA-MB231 cells
To identify mechanisms that could mediate this inter-relationship, fibroblasts from uninvolved nodes co-cultured with MDA-MB231 cells had their gene expression compared with matched fibroblasts cultured alone; however, as a high FDR was attained, we cannot assure that all these genes would be in fact modulated. There is evidence that cancer cells may prime certain tissues by secreting factors that are able to create a permissive microenvironment for cell adhesion and invasion [28]. Although this co-culture model may in part reproduce the primary contact between nodal fibroblasts and cancer cells, a common transcriptional response of the former could not be recognized in our work.
Effects of MDA MB231 cells were then evaluated in co-cultured fibroblasts from involved nodes, condition that models a situation of an established regional metastasis, as tumor development in the lymph node has already taken place in vivo. Sixty genes were potentially modulated (considering a fold change of the ratio ≥2; 31 less and 29 more expressed; false discovery, 14 genes; Supplementary Table 3) in co-cultured fibroblasts from involved nodes as compared with fibroblasts cultured alone.
Expression pattern of gene sets was then analyzed and GSEA of fibroblasts from positive nodes co-cultured with MDA-MB231 cells revealed enrichment of genes involved in nine gene sets (Supplementary Table 4); among them, cellular localization and intracellular transport, both including TGFB1 over-expression, a potential mediator of epithelial mesenchymal cross-interaction [11, 29]. Hence, expression of the transforming growth factor beta family members, TGFB1, TGFB2, and TGFB3, was further determined by RT-PCR in a new set of assays.
Another four genes were selected for analysis (based on a fold change >2), three of them considered more expressed in co-cultured fibroblasts, (Supplementary Table 3), MBD3 (methyl-CpG binding domain protein 3), GBF1 (Golgi-specific brefeldin A resistant guanine nucleotide exchange factor one), MAP2K3 (mitogen-activated protein kinase 3 or MAPK/ERK kinase 3; MEK3), and one, TTYH3 (Tweety homolog 3), considered less expressed, in co-cultured fibroblasts.
These new experiments employing RT-PCR confirmed a higher expression of MAP2K3, MBD3, and GBF1 in fibroblasts from positive nodes co-cultured with MDA-MB231 cells, as compared with fibroblasts cultured alone (Fig. 2a). In addition, similar results demonstrating higher expression of MBD3 and MAP2K3 in co-cultured fibroblasts from negative nodes were found.
Fig. 2.
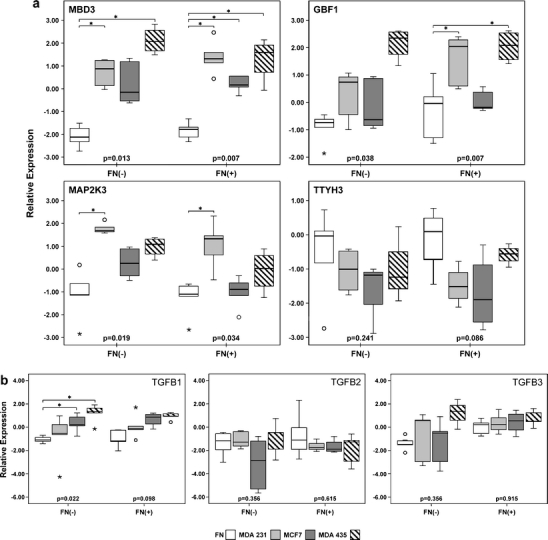
a Expression of MAP2K3, MBD3, GBF1, and TTYH3 in fibroblasts. b Expression of TGFB1, TGFB2, and TGFB3 in fibroblasts. Gene expression in fibroblasts from negative nodes [FN(−)] and positive nodes [FN(+)] cultured alone or co-cultured with MDA-MB231, MDA-MB435, or MCF7 cells. Fibroblasts from uninvolved or involved nodes (four to five independent experiments) were cultured alone or co-cultured with breast cancer cells for two or three cell passages. Samples from each individual patient were pooled and had their RNA extracted. Expression of MAP2K3, MBD3, GBF1, and TTYH3 (a) and TGFB1, TGFB2, and TGFB3 (b) was verified by real-time RT-PCR and calculated as a relative value to a reference pool of fibroblasts (combined equal quantities of mRNA from fibroblasts obtained from six breast cancer samples). Results in the y-axis represent the log2 relative expression. Friedman test, p value inside the box; * (over the horizontal bracket): p ≤ 0.05, Wilcoxon test. White box fibroblasts cultured alone; light gray box fibroblasts co-cultured with MDA-MB231 cells; dark gray box fibroblasts co-cultured with MCF7 cells; dashed box fibroblasts co-cultured with MDA-MB435 cells. Box plot displays the distribution of all values between bars (25th, 50th, and 75th quartiles inside the box), except outliers (open circle 1.5–3.0 box lengths from the 75th quartile, *: >3.0 box lengths from the 75th quartile)
We have also investigated the effects of two other breast cancer lineages (MDA-MB435 and MCF7)on nodal fibroblasts; however, we could not identify a growth advantage of co-cultured fibroblasts over fibroblasts cultured alone (Fig. 1a).
Expression of MBD3 in the fibroblasts from positive nodes was also induced by these two breast cancer lineages, in agreement with results obtained in fibroblasts co-cultured with MDA-MB231 cells (Fig. 2a). We may hypothesize that MBD3 may involved in the response of nodal fibroblasts to factors secreted by breast cancer cells.
However, we could not distinguish a uniform transcriptional response of fibroblasts concerning expression of MAP2K3, GBF1, and TTYH3. In addition, among TGFB family members, TGFB1 was more expressed in co-cultured fibroblasts from negative nodes with MCF7 and MDA-MB435 cells (Fig. 2b) and TGFB3 was more expressed in fibroblasts from positive nodes as compared with fibroblasts from negative nodes (n = 5; p = 0.016, Mann–Whitney test). One possibility would be that breast cancer cells from distinct intrinsic subtypes might exert a particular influence on gene expression of stromal cells from the regional nodes. MCF7 is a luminal estrogen receptor positive and ERBB2 negative lineage, in contrast with MDA-MB231 and MDA-MB435 cells, which are ER negative lineages, widely used as metastatic models.
Another observation that deserves further attention is that fibroblasts from positive and negative nodes show a concordant behavior as MAP2K3, MBD3, GBF1, TTYH3, and TGFB family members are similarly expressed in both groups of fibroblasts co-cultured with each one of the breast cancer cell lines (Fig. 2, FN(−).MDA231 vs FN(+).MDA231; FN(−).MCF7 vs FN(+).MCF7; FN(−).MDA435 vs FN(+).MDA435, p > 0.05, Mann–Whitney test).
Our experiments with nodal fibroblasts indicate that each breast cancer lineage exerts a particular effect in fibroblasts viability and transcriptional profile. In addition, fibroblasts from positive and negative nodes from different patients have a parallel behavior.
Effects of nodal fibroblasts on gene expression of MDA MB231 breast cancer cells
To support our hypothesis that breast cancer cells and nodal associated fibroblasts might influence each other’s behavior, we have next compared cell viability, migratory ability, and transcriptional profile of MDA-MB231 cells maintained with or without fibroblasts.
An enhancement in MDA MB231 cell viability (Fig. 1b) and migratory ability (Fig. 1c) was observed after co-culture with fibroblasts from involved nodes as well as uninvolved nodes.
MDA-MB231 cells had 155 genes modulated (considering a fold change of the ratio ≥2; 83 downregulated and 72 upregulated, Supplementary Tables 5 and 6), when co-cultured in the presence of fibroblasts from negative nodes, which were involved in functions as cell cycle, regulation of progression through cell cycle, and positive regulation of cell proliferation (Table 2 (MDA.FN(−))). MDA-MB231 cells co-cultured with fibroblasts from positive nodes had 188 (99 downmodulated and 89 upmodulated, Supplementary Tables 6 and 7) genes regulated, which were involved in transcription, mRNA splicing, via spliceosome, reponse to stress (Table 2 (MDA.FN(+))). Among the differentially expressed genes 77 transcripts were commonly modulated in MDA-MB231 following co-culture with fibroblasts, irrespective whether originated from uninvolved or involved nodes (Supplementary Table 6).
Table 2.
Functional categories (biological process) enriched in genes modulated in MDA MB231 cells co-cultured with fibroblasts from uninvolved lymph nodes [MDA.FN(-)] (A) or involved nodes [MDA.FN(+)] (B)
| (A) | |||
| Biological Process | Genes over-expressed in MDA.FN (-) | Genes under-expressed in MDA.FN (-) | R |
| Humoral immune response | IL6 | RFXANK | 4 |
| Respiratory gaseous exchange | COX5B, HNMT | 4 | |
| Regulation of transcription from RNA polymerase II promoter | TFDP1 | LITAF, SOD2, TEF | 40 |
| SMARCD3, CITED2 | |||
| Brain development | CDK5RAP2, GPR56 | 7 | |
| Positive regulation of I-kappaB kinase/NF-kappaB cascade | SLC20A1 | LITAF, TRADD, RHOC | 28 |
| Positive regulation of cell proliferation | TGFB2, IL6 CUL3 | STIM1 | 29 |
| Generation of precursor metabolites and energy | EHHADH | WFS1 | 11 |
| JNK cascade | DUSP10 | PAK1 | 11 |
| Response to stress | DUSP10, PRKRIR | SNN | 22 |
| Cell cycle | SH3BP4, CTCF, E2F3 | RIF1, SUFU, STIM1 | 127 |
| TFDP1, CUL3 | PARD6A | ||
| Lipid metabolism | SOAT1, HMGCS1, ACSL3 | 51 | |
| Nuclear mRNA splicing, via spliceosome | SF3B4, LSM3, SFRS3 | 32 | |
| Regulation of progression through cell cycle | E2F3, TFDP1, UBE2V2 | PSMD8 | 71 |
| RBBP6 | |||
| Sensory perception of sound | PTPN11 | WFS1 | 22 |
| (B) | |||
| Biological process | Genes over-expressed in MDA.FN (+) | Genes under-expressed in MDA/FN (+) | R |
| Nuclear mRNA splicing, via spliceosome | SF3B4, LSM3, HNRPH3 | 32 | |
| TARDBP, SFRS6, SFRS3 | |||
| SFRS2 | |||
| Regulation of transcription, DNA-dependent | SOX17, TARDBP | ZNF19, IRF7 | 375 |
| Antigen processing, endogenous antigen via MHC class I | TRPC4AP, HLA-F | 4 | |
| Response to stress | DUSP10 | AHSA1, SNN, PTK2B | 22 |
| Brain development | CDK5RAP2, GPR56 | 7 | |
| Response to DNA damage stimulus | RIF1, IRF7 | 7 | |
| Protein targeting | TLOC1 | KATNB1 | 8 |
| Excretion | TACR2, NEDD4L | 9 | |
| RNA splicing | SF3B4, HNRPH3, SFRS2 | 21 | |
| Transcription | SOX17, TARDBP | TEF, ZNF19, SMARCD3 | 315 |
| IRF7 | |||
| Protein ubiquitination | NEDD4L | VCP | 12 |
| Regulation of GTPase activity | GDI2 | CENTG3 | 13 |
Reference (R) stands for the number of genes involved in that specific function that were represented on the cDNA microarray platform (http://vortex.cs.wayne.edu:8080/index.jsp; corrected p value < 0.05). Genes found differentially expressed in MDA.FN co-cultured cells as compared with MDA mono-cultured cells are shown
Unsupervised clustering using the differentially expressed genes allowed a clear separation of breast cancer cells into two branches, one comprising all three samples of MDA-MB231 cells co-cultured with fibroblasts and the other one, samples of MDA-MB231 mono-cultured cells (Fig. 3).
Fig. 3.
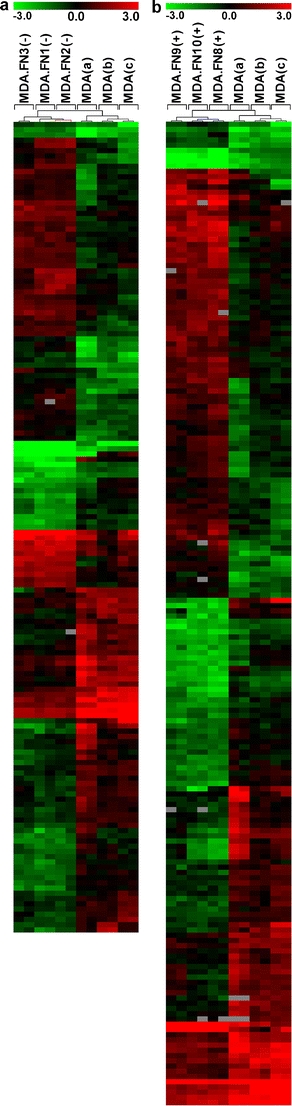
Unsupervised hierarchical clustering of MDA-MB231 cells cultured alone (MDA) or co-cultured with fibroblasts from uninvolved (a) [MDA231.FN(−)] or involved nodes (b) [MDA231.FN(+)]. MDA-MB231 cells were cultured alone or with fibroblasts from uninvolved (samples 1, 2, and 3) or involved nodes (samples 8, 9, and 10). Three independent assays with dye swap were performed for each comparison. The upper colored bar indicates the variation in gene expression in target samples (MDA-MB231) as compared with reference cells (HB4A), i.e., red more expressed and green less expressed in target samples. Two branches were identified, one including co-cultured MDA-MB231 cells and another one, MDA-MB231 cells cultured alone
We have also compared the phenotypes of MDA-MB231 cells cultured in the presence or absence of fibroblasts from positive nodes using GSEA and enrichment in three gene sets were found, including protease inhibitor activity (Supplementary Table 4).
We have then re-analyzed the expression of selected genes in MDA-MB231 samples using RT-PCR. Selection criteria were based on differential regulation in cancer cells by fibroblasts from positive or negative nodes or both (considering fold change of the ratio >2) as well as on their function. Considering microarray results, FN3K and SOD2; SERPINB2 and SPINT2; and HNMT, COMT, and IL6 were more expressed in MDA-MB231 cells co-cultured with fibroblasts from negative nodes; positive nodes; or both, respectively. FN3K (fructosamine 3 kinase), SOD2 (superoxide dismutase 2), HNMT (histamine N-methyltransferase), and COMT (catechol-O-methyltransferase) code for enzymes involved in cellular defense; IL6 (Interleukin 6) codes for an inflammatory cytokine involved in proliferation and migration; SERPIN B2 (serpin peptidase inhibitor, clade B (ovalbumin), member 2, also known as PAI2); and SPINT2 (serine peptidase inhibitor, Kunitz type, 2; HAI2), code for proteins implicated in cell invasion and migration. In this new set of experiments FN3K, SOD2, HNMT, and COMT were confirmed less expressed in MDA-MB231 cells co-cultured with fibroblasts from both positive as well as from negative nodes (Fig. 4), indicating that nodal fibroblasts irrespective whether previously primed or not by malignant cells exert similar effects on breast cancer cells.
Fig. 4.
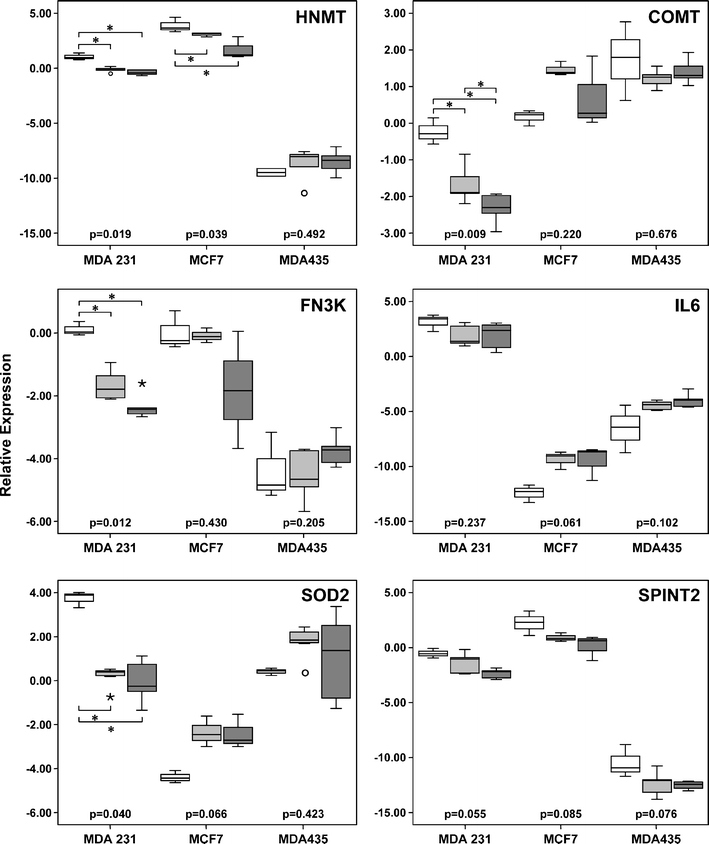
Expression of HNMT, COMT, FN3K, IL6, SOD2, and SPINT2 in breast cancer cells. MCF7, MDA-MB231 (MDA 231), and MDA-MB 435 (MDA 435) cells were cultured alone or co-cultured with fibroblasts from negative or positive nodes for two or three cell passages and samples co-cultured with fibroblasts from each individual patient were pooled for expression analysis. Three to five independent experiments were performed. Expression of HNMT, COMT, FN3K, IL6, SOD2, and SPINT2 was verified by real-time RT-PCR and calculated as relative expression to HB4A cells. Results in the y-axis represent the log2 relative expression. p value inside the figure, Kruskal–Wallis test; * (over or below the horizontal brackets): p ≤ 0.05, Mann–Whitney test. Box plot displays the distribution of all values between bars (25th, 50th, and 75th quartiles inside the box), except outliers (open circle 1.5–3.0 box lengths from the 75th quartile, *: >3.0 box lengths from the 75th quartile). White box breast cancer cells cultured alone; light gray box breast cancer cells co-cultured with fibroblasts from negative nodes; dark gray box breast cancer cells co-cultured with fibroblasts from positive nodes
Low mRNA levels of FN3K (fructosamine 3 kinase) and SOD2 (superoxide dismutase 2), enzymes involved in defensive cellular mechanisms, were found in colon cancer tissue with respect to normal surrounding mucosa [30] and in tumor cells obtained from node metastases, as compared with parental cells [14], respectively. COMT, catechol-O-methyltransferase, catalyzes an inactivation step in the estrogen pathway. Estrone and estradiol can form catechol estrogen metabolites and catechol estrogen quinones, which react with DNA to form depurinating adducts, hence, low COMT activity may dispose to mutations [31]. HNMT (histamine N-methyltransferase) takes part is histamine catabolism, which may be decreased in the colonic mucosa of patients with colonic adenoma, leading to increased histamine concentration in these patients [32]. One possibility would be that downregulation of these four enzymes might contribute to the formation of damage products in MDA-MB231 cells co-cultured with fibroblasts.
We have then verified whether these observations concerning cell proliferation and gene expression changes could be generalized and fibroblasts would have the same influence over MDA-MB435 cells and MCF7 cells. In accordance with our data in MDA MB231 cells, cell viability from both cancer lineages was enhanced after co-culture with fibroblasts (Fig. 1b). Similarly, MDA-MB435 cells, previously grown as lymph node metastasis in xenografts, were shown to increase their growth rate, as compared with parental cells maintained in cell culture [33]. However, most studies evaluating the proliferation process have used as a source fibroblasts derived from the breast tissue itself, and not from the lymph nodes. Consistent with our present results, fibroblasts from malignant tumor tissue and their normal adjacent counterparts, as well as fibroblasts from normal tissue recovered from reduction mammoplasties may all stimulate proliferation of breast cancer cell lines, through paracrine regulation [34]. Additionally, no differential influence of normal mammary fibroblasts and mammary-cancer-associated fibroblasts in cell viability was described [35]. On the other hand, it was also demonstrated that stromal fibroblasts from normal breast, maintained in a high cell density, may inhibit MCF7 cell proliferation [3], indicating that the proportion of each cell type is important in regulating the proliferation process. Although such cellular ratio may be observed in desmoplastic tumors, it is not common in the involved nodes. Considering that our co-culture assays utilized a ratio of three breast cancer cells to one fibroblast, to simulate the regional metastasis, this inhibition effect was not to be expected.
COMT, FN3K, and SOD2 were not modulated in MDA-MB435 as well as in MCF7 cells co-cultured with fibroblasts (Fig. 4). HNMT was downregulated in MCF7 grown in the presence of fibroblasts, in accordance with data from MDA-MB231 cells (Fig. 4). Additionally, IL6 (Fig. 4) as well as SERPINB2 (data not shown), were not confirmed regulated in breast cancer cell lines co-cultured with nodal fibroblasts. Hence, there was not a common transcriptional response of breast cancer cell lines to the presence of nodal fibroblasts, suggesting that the inter-relationships between stromal and cancer cells are heterogenous and probably dependent on the subtype of tumor. We have also analyzed the transcriptional profile of MCF10A mammary epithelial cells co-cultured with nodal fibroblasts and cultured alone (data not shown) and compared with MDA-MB231 co-cultured and mono-cultured cells. In agreement with our present results, less than 4% of genes (indicating just a small overlap) were commonly regulated in both mammary cell lines, by the presence of fibroblasts.
Although SPINT2 was not modulated in breast cancer cells co-cultured with fibroblasts from negative nodes, it was downregulated in all the three cell lines, upon the presence of fibroblasts from positive nodes (p ≤ 0.05; Mann–Whitney test). SPINT2 regulates hepatocyte growth factor (HGF) activity through inhibition of HGF activator. Stromal fibroblasts are the main source of pro-HGF in the body, which following activation, has an important role in cancer metastasis and tumor growth. Elimination of HAI-2 expression, in MDA-MB-231 cells was previously shown to be associated with enhanced migratory, proliferative, and invasive nature of these cells [36].
To exploit potential differences in the interaction between fibroblasts from positive and negative nodes and the malignant cells we have also analyzed expression of genes involved in two specific functions, JNK cascade and response to stress (Table 2 (MDA.FN(−)/MDA.FN(+))), which may be mediating the intracellular signaling initiated by factors secreted by the fibroblasts, including TGFB [15, 29]. We have then compared the expression of six genes, DUSP10 (dual specificity phosphatase 10); PAK1 (p21 protein (Cdc42/Rac)-activated kinase 1); PRKRIR (protein kinase, interferon-inducible double-stranded RNA dependent inhibitor), SNN (stannin), AHSA1 (AHA1, activator of heat shock 90 kDa protein ATPase homolog 1 (yeast)), and PTK2B (PTK2B protein tyrosine kinase 2 beta) in all the three cell lines co-cultured with fibroblasts from involved or uninvolved nodes; however, no differences were encountered. These observations further support the hypothesis that fibroblasts from positive and negative nodes exert a similar effect in a specific breast cancer line.
Just a few studies have dealt with gene expression regulation in breast cancer nodal metastasis: Montel et al. [14] have compared MDA MB435 cells and nodal metastasis established from xenografts and Ellsworth et al. [37] have analyzed microdissected tumor cells from the primary tumor and paired nodal metastasis. These studies have added information about regulation resulting from secreted factors and cell–cell contact in a specific microenvironment [14]. The model we have used, co-culture of breast cancer cells and nodal fibroblasts, may contribute information on gene modulation through secreted factors. Additionally, it allows the independent analysis of both malignant cells and fibroblasts. Hence, gene expression regulation in the lymph node microenvironment through soluble factors and cell contact may be complementary, and dissecting this mechanism may help determining not only the molecular targets but also the best timing for interfering in the process.
In summary, fibroblasts from both involved and uninvolved nodes may similarly induce breast cancer cells viability. Transcriptional changes induced in the cancer cells by the fibroblasts from positive and negative nodes are very much alike in a specific breast cancer cell line (MDA-MB231, MDA-MB435, and MCF7). However, fibroblasts effects are distinct in each one of the breast cancer lineages, suggesting that the inter-relationships between stromal and cancer cells are dependent on the intrinsic subtype of the tumor. Breast cancer cells may also interfere in the transcriptional profile of nodal fibroblasts, but probably in a reversible way, as no major differences are detected between fibroblasts from negative and positive nodes, the latter having had a previous contact with malignant cells in vivo.
Electronic supplementary materials
Below is the link to the electronic supplementary material.
Primers used in RT-PCR. (PDF 20 kb)
Differentially expressed genes between fibroblasts from involved [FN(+): samples 8, 9, 10] as compared to fibroblasts from uninvolved lymph nodes [FN(-): samples 1, 2, 3] from six breast cancer patients. (Student t test, p ≤ 0.01, FDR ≤ 0.01; Fc ≥ 2). Fc: fold change of the ratio. (-): less expressed in fibroblasts from positive nodes. (PDF 65 kb)
Differentially expressed genes between fibroblasts from involved lymph nodes [FN(+): samples 8, 9, 10] co-cultured with MDA-MB231 cells [FN(+).MDA] or cultured alone. Fc: fold change of the ratio FN(+).MDA/FN(+). Three independent assays were performed for each comparison and a paired t test was used to evaluate the data (adjusted p-value ≤ 0.01; Fc ≥ 2; FDR ≤ 0.24). (-): less expressed in co-cultured cells. (PDF 83 kb)
Gene sets associated with fibroblasts from positive nodes co-cultured in the presence of MDA-MB231 cells [FN(+).MDA vs FN(+)] and MDA.MB231 cells co-cultured with fibroblasts from positive nodes [MDA.FN(+) vs FN(+). Microarray data was analyzed using GSEA and all gene sets with gene ontology annotation at molecular function, cellular component and biological process; p<0.01, was considered significant; no gene sets satisfied a FDR <0.25. (PDF 8 kb)
Differentially expressed genes between MDA MB231 cells (MDA) co-cultured with fibroblasts from uninvolved lymph nodes [MDA.FN(-)] or cultured alone. MDA MB231 cells were cultured alone or in the presence of fibroblasts from uninvolved nodes obtained from three breast cancer patients (samples 1, 2, 3). Seventy eight genes differentially expressed by MDA MB231 cells exclusively when co-cultured with fibroblasts from uninvolved nodes (but not from involved nodes) are shown. Three independent assays were performed for each comparison and Student t test was used to evaluate the data (adjusted p ≤ 0.01, FDR ≤ 0.01, and Fc ≥ 2). Fc: fold change of the ratio. (-): less expressed. (PDF 100 kb)
Differentially expressed genes between MDA MB231 cells co-cultured with fibroblasts from both uninvolved [MDA.FN(-)] or involved nodes [MDA.FN(+)] as compared with MDA MB231 cells cultured alone. Seventy seven genes were commonly modulated in MDA cells in the presence of fibroblasts originated from involved as well as from uninvolved lymph nodes. Three independent assays were performed for each comparison and Student t test was used to evaluate the data (adjusted p ≤ 0.01, FDR ≤ 0.01, and Fc ≥ 2). Fc: fold change of the ratio. (-): less expressed. (PDF 97 kb)
Differentially expressed genes between MDA MB231 cells co-cultured with fibroblasts from involved lymph nodes [MDA.FN(+)] or cultured alone. MDA MB231 cells were cultured alone or in the presence of fibroblasts from an involved node obtained from three breast cancer patients (samples 8, 9, 10). One hundred and eleven genes were exclusively differentially expressed by MDA MB231 cells when co-cultured with fibroblasts from involved nodes (but not from uninvolved nodes). Three independent assays were performed for each comparison and Student t test was used to evaluate the data (adjusted p ≤ 0.01, FDR ≤ 0.01, and Fc ≥ 2). Fc: fold change of the ratio. (-): less expressed. (PDF 103 kb)
Proliferation curve of fibroblasts from uninvolved and involved lymph nodes from breast cancer patients. Fibroblasts obtained from three patients without any involved nodes (FN(−): samples 1, 2, 3), and from an involved lymph node (FN(+), as detected by histopathological exam) from another three patients (samples 8, 9, 10), were cultured. After three cell passages, immunocytochemistry revealed positive expression of vimentin. Each point and bar represents the mean and SD of three independent assays performed in triplicate. WST1 kit was used and optical density was transformed to cell number based on a previous calibration curve. Proliferation curves detected no differences in cell growth between fibroblasts from positive and negative nodes (p = 0.5204, Mann–Whitney test). (PDF 44 kb)
Expression of PAK1, DUSP10, PRKRIR, SNN, AHSA1, and PTK2B in breast cancer cells co-cultured with fibroblasts from negative and negative nodes. MDA-MB231 (MDA 231), MCF7, and MDA-MB 435 (MDA 435) cells were co-cultured with fibroblasts from ten patients (five with involved nodes and five with uninvolved nodes) for two or three cell passages. Breast cancer cells co-cultured with fibroblasts from each individual patient had their RNA extracted and equal amounts were pooled for expression analysis. Expression of PAK1, DUSP10, PRKRIR, SNN, AHSA1, and PTK2B was verified by real-time RT-PCR and calculated as relative values to HB4A cells. Results shown in the y-axis represent the log2 expression values (p values inside the figure, Mann–Whitney test). White box breast cancer cell co-cultured with fibroblasts from negative nodes; gray box breast cancer cells co-cultured with fibroblasts from positive nodes. No differences were found in gene expression values. (PDF 49 kb)
Acknowledgments
The authors would like to acknowledge the helpful assistance of Dr. Igor Moysés Longo Snitcovsky and Dr. Andrea Hanada Otake for critical review and important suggestions to the manuscript, Mr. Arthur William Alvarenga for performing some RT-PCR experiments; Mr. Renato Puga for helping with bioinformatics data; Mrs. Maria José Gonçalves Benevides for secretarial help. This work was supported by Fundação de Amparo à Pesquisa do Estado de São Paulo (FAPESP), Coordenação de Aperfeiçoamento de Pessoal de nível Superior (CAPES), and Conselho Nacional de Desenvolvimento Científico e Tecnológico (CNPq).
Open Access
This article is distributed under the terms of the Creative Commons Attribution Noncommercial License which permits any noncommercial use, distribution, and reproduction in any medium, provided the original author(s) and source are credited.
Footnotes
Rosângela Portilho Costa Santos, Ticiana Thomazine Benvenutti, Suzana Terumi Honda, and Paulo Roberto Del Valle participated equally in this work.
References
- 1.Shekhar MPV, Wrdell J, Santner SJ, Pauley RJ, Tait L. Breast stroma plays a dominant regulatory role in breast epithelial growth and differentiation: implications for tumor development and progression. Cancer Res. 2001;61:1320–1326. [PubMed] [Google Scholar]
- 2.Lefebvre MF, Guillot C, Crepin M, Saez S. Influence of tumor derived fibroblasts and 1, 25-dihydroxyvitamin D3 on growth of breast cancer cell lines. Breast Cancer Res Treat. 1995;33:189–197. doi: 10.1007/BF00665943. [DOI] [PubMed] [Google Scholar]
- 3.Dong-Le Bourhis X, Berthois Y, Millot G, Degeorges A, Sylvi M, Martin PM, Calvo F. Effect of stromal and epithelial cells derived from normal and tumorous breast tissue on the proliferation of human breast cancer cell lines in co-culture. Int J Cancer. 1997;71:42–48. doi: 10.1002/(SICI)1097-0215(19970328)71:1<42::AID-IJC9>3.0.CO;2-3. [DOI] [PubMed] [Google Scholar]
- 4.Sadlonova A, Novak Z, Johnson MR, Bowe DB, Gault SR, Page GP, Thottassery JV, Welch DR, Frost AR. Breast fibroblasts modulate epithelial cell proliferation in three-dimensional in vitro co-culture. Breast Cancer Res. 2005;7:46–59. doi: 10.1186/bcr949. [DOI] [PMC free article] [PubMed] [Google Scholar]
- 5.Wang TN, Albo D, Tiszynski GP. Fibroblasts promote breast cancer cell invasion by upregulating tumor matrix metalloproteinase-9 production. Surgery. 2002;132:220–225. doi: 10.1067/msy.2002.125353. [DOI] [PubMed] [Google Scholar]
- 6.Kunz-Schughart LA, Heyder P, Schroeder J, Knuechel R. A heterologous 3-D coculture model of breast tumor cells and fibroblasts to study tumor-associated fibroblast differentiation. Exp Cell Res. 2001;266:74–86. doi: 10.1006/excr.2001.5210. [DOI] [PubMed] [Google Scholar]
- 7.Hu M, Yao J, Carroll DK, Weremowicz S, Chen H, Carrasco D, Richardson A, Violette S, Nikolskaya T, Nikolsky Y, Bauerlein EL, Hahn WC, Gelman RS, Allred C, Bissell MJ, Schnitt S, Polyak K. Regulation of in situ to invasive breast carcinoma transition. Cancer Cell. 2008;13:394–406. doi: 10.1016/j.ccr.2008.03.007. [DOI] [PMC free article] [PubMed] [Google Scholar]
- 8.Camps JL, Chang SM, Hsu TC, Freeman MR, Hong SJ, Zhau HE, von Eschenbach AC, Chung LWK. Fibroblast-mediated acceleration of human epithelial tumor growth in vivo. Proc Natl Acad Sci USA. 1990;87:75–79. doi: 10.1073/pnas.87.1.75. [DOI] [PMC free article] [PubMed] [Google Scholar]
- 9.Krtolica A, Parrinello S, Lockett S, Desprez PY, Campisi J. Senescent fibroblasts promote epithelial cell growth and tumorigenesis: a link between cancer and aging. Proc Natl Acad Sci USA. 2001;98:12072–12077. doi: 10.1073/pnas.211053698. [DOI] [PMC free article] [PubMed] [Google Scholar]
- 10.Orimo A, Gupta P, Sgroi D, Arenzana-Seisdedos F, Delaunay R, Naeem V, Carey A, Richardson R, Weinberg RA. Stromal fibroblasts present in invasive human breast carcinomas promote tumor growth and angiogenesis through elevated SDF-1/CXCL12 secretion. Cell. 2005;121:335–348. doi: 10.1016/j.cell.2005.02.034. [DOI] [PubMed] [Google Scholar]
- 11.Kuperwasser C, Chavarria T, Wu M, Magrane G, Gray JW, Carey L, Richardson A, Weinberg RA. Reconstruction of functionally normal and malignant human breast tissues in mice. Proc Natl Acad Sci USA. 2004;101:4966–4971. doi: 10.1073/pnas.0401064101. [DOI] [PMC free article] [PubMed] [Google Scholar]
- 12.Patocs A, Zhang L, Xu Y, Weber F, Caldes T, Mutter GL, Platzer P, Eng C. Breast-cancer stromal cells with TP53 mutations and nodal metastases. N Engl J Med. 2007;357:2543–2551. doi: 10.1056/NEJMoa071825. [DOI] [PubMed] [Google Scholar]
- 13.LeBedis C, Chen K, Fallavollita L, Boutros T, Brodt P. Peripheral lymph node stromal cells can promote growth and tumorigenicity of breast carcinoma cells through the release of IGF-I and EGF. Int J Cancer. 2002;100:2–8. doi: 10.1002/ijc.10481. [DOI] [PubMed] [Google Scholar]
- 14.Montel V, Mose ES, Tarin D. Tumor-stromal interactions reciprocally modulate gene expression patterns during carcinogenesis and metastasis. Int J Cancer. 2006;119:251–263. doi: 10.1002/ijc.21757. [DOI] [PubMed] [Google Scholar]
- 15.Rozenchan PB, Carraro DM, Brentani H, de Carvalho Mota LD, Bastos EP, Ferreira EN, Torres CH, Katayama ML, Roela RA, Lyra EC, Soares FA, Folgueira MA, Góes JC, Brentani MM. Reciprocal changes in gene expression profiles of cocultured breast epithelial cells and primary fibroblasts. Int J Cancer. 2009;125:2767–2777. doi: 10.1002/ijc.24646. [DOI] [PubMed] [Google Scholar]
- 16.Brentani RR, Carraro DM, Verjovski-Almeida S, Reis EM, Neves EJ, de Souza SJ, Carvalho AF, Brentani H, Reis LF. Gene expression arrays in cancer research: methods and applications. Crit Rev Oncol Hematol. 2005;54:95–105. doi: 10.1016/j.critrevonc.2004.12.006. [DOI] [PubMed] [Google Scholar]
- 17.Folgueira MA, Carraro DM, Brentani H, Patrão DF, Barbosa EM, Netto MM, Caldeira JR, Katayama ML, Soares FA, Oliveira CT, Reis LF, Kaiano JH, Camargo LP, Vêncio RZ, Snitcovsky IM, Makdissi FB, e Silva PJ, Góes JC, Brentani MM. Gene expression profile associated with response to doxorubicin-based therapy in breast cancer. Clin Cancer Res. 2005;11:7434–7443. doi: 10.1158/1078-0432.CCR-04-0548. [DOI] [PubMed] [Google Scholar]
- 18.Roela RA, Carraro DM, Brentani HP, Kaiano JH, Simão DF, Guarnieiro R, Lopes LF, Borojevic R, Brentani MM. Gene stage-specific expression in the microenvironment of pediatric myelodysplastic syndromes. Leuk Res. 2007;31(5):79–89. doi: 10.1016/j.leukres.2006.10.007. [DOI] [PubMed] [Google Scholar]
- 19.Maschietto M, de Camargo B, Brentani H, Grundy P, Sredni ST, Torres C, Mota LD, Cunha IW, Patrão DF, Costa CM, Soares FA, Brentani RR, Carraro DM. Molecular profiling of isolated histological components of wilms tumor implicates a common role for the Wnt signaling pathway in kidney and tumor development. Oncology. 2008;75:81–91. doi: 10.1159/000155210. [DOI] [PubMed] [Google Scholar]
- 20.Castro NP, Osorio CA, Torres C, Bastos EP, Mourao-Netto M, Soares FA, Brentani HP, Carraro DM. Evidence that molecular changes in cells occur before morphological alterations during the progression of breast ductal carcinoma. Breast Cancer Res. 2008;10:R87. doi: 10.1186/bcr2157. [DOI] [PMC free article] [PubMed] [Google Scholar]
- 21.Storey JD. A direct approach to false discovery rates. J Roy Stat Soc B. 2002;64:479–498. doi: 10.1111/1467-9868.00346. [DOI] [Google Scholar]
- 22.Saeed AI, Sharov V, White J, Li J, Liang W, Bhagabati N, Braisted J, Klapa M, Currier T, Thiagarajan M, Sturn A, Snuffin M, Rezantsev A, Popov D, Ryltsov A, Kostukovich E, Borisovsky I, Liu Z, Vinsavich A, Trush V, Quackenbush J. TM4: a free, open-source system for microarray data management and analysis. Biotechniques. 2003;34:374–378. doi: 10.2144/03342mt01. [DOI] [PubMed] [Google Scholar]
- 23.Draghici S, Khatri P, Bhavsar P, Shah A, Krawetz SA, Tainsky MA. Onto-tools, the toolkit of the modern biologist: onto-express, onto-compare, onto-design and onto-translate. Nucleic Acids Res. 2003;31:3775–3781. doi: 10.1093/nar/gkg624. [DOI] [PMC free article] [PubMed] [Google Scholar]
- 24.Subramanian A, Tamayo P, Mootha VK, Mukherjee S, Ebert BL, Gillette MA, Paulovich A, Pomeroy SL, Golub TR, Lander ES, Mesirov JP. Gene set enrichment analysis: a knowledge-based approach for interpreting genome-wide expression profiles. Proc Natl Acad Sci USA. 2005;102:15545–15550. doi: 10.1073/pnas.0506580102. [DOI] [PMC free article] [PubMed] [Google Scholar]
- 25.Vandesompele J, De Preter K, Pattyn F, Poppe B, Van Roy N, De Paepe A, Speleman F. Accurate normalization of real-time quantitative RT-PCR data by geometric averaging of multiple internal control genes. Genome Biol. 2002;3:0034.1–0034.11. doi: 10.1186/gb-2002-3-7-research0034. [DOI] [PMC free article] [PubMed] [Google Scholar]
- 26.Pfaffl MW. A new mathematical model for relative quantification in real-time RT-PCR. Nucleic Acids Res. 2001;29:2002–2007. doi: 10.1093/nar/29.9.e45. [DOI] [PMC free article] [PubMed] [Google Scholar]
- 27.Singer CF, Gschwantler-Kaulich D, Fink-Retter A, Haas C, Hudelist G, Czerwenka K, Kubista E. Differential gene expression profile in breast cancer-derived stromal fibroblasts. Breast Cancer Res Treat. 2008;110:273–281. doi: 10.1007/s10549-007-9725-2. [DOI] [PubMed] [Google Scholar]
- 28.Psaila B, Lyden D. The metastatic niche: adapting the foreign soil. Nat Ver Cancer. 2009;9(4):285–293. doi: 10.1038/nrc2621. [DOI] [PMC free article] [PubMed] [Google Scholar]
- 29.Stuelten CH, Busch JI, Tang B, Flanders KC, Oshima A, Sutton E, Karpova TS, Roberts AB, Wakefield LM, Niederhuber JE. Transient tumor-fibroblast interactions increase tumor cell malignancy by a TGF-Beta mediated mechanism in a mouse xenograft model of breast cancer. PLoS ONE. 2010;5(3):e9832. doi: 10.1371/journal.pone.0009832. [DOI] [PMC free article] [PubMed] [Google Scholar]
- 30.Caruso MG, Notarnicola M, Altomare DF, Misciagna G. Gene expression of fructosamine 3 kinase in patients with colorectal cancer. Oncology. 2007;73:72–75. doi: 10.1159/000120631. [DOI] [PubMed] [Google Scholar]
- 31.Lu F, Zahid M, Saeed M, Cavalieri EL, Rogan EG. Estrogen metabolism and formation of estrogen-DNA adducts in estradiol-treated MCF-10F cells. The effects of 2,3,7,8-tetrachlorodibenzo-p-dioxin induction and catechol-O-methyltransferase inhibition. J Steroid Biochem Mol Biol. 2007;105:150–158. doi: 10.1016/j.jsbmb.2006.12.102. [DOI] [PMC free article] [PubMed] [Google Scholar]
- 32.Kuefner MA, Schwelberger HG, Hahn EG, Raithel M. Decreased histamine catabolism in the colonic mucosa of patients with colonic adenoma. Dig Dis Sci. 2008;53:436–442. doi: 10.1007/s10620-007-9861-x. [DOI] [PubMed] [Google Scholar]
- 33.Lee H, Lin EC, Liu L, Smith JW. Gene expression profiling of tumor xenografts: in vivo analysis of organ-specific metastasis. Int J Cancer. 2003;107:528–534. doi: 10.1002/ijc.11428. [DOI] [PubMed] [Google Scholar]
- 34.van Roozendaal KE, Klijn JG, van Ooijen B, Claassen C, Eggermont AM, Henzen-Logmans SC, Foekens JA. Differential regulation of breast tumor cell proliferation by stromal fibroblasts of various breast tissue sources. Int J Cancer. 1996;65:120–125. doi: 10.1002/(SICI)1097-0215(19960103)65:1<120::AID-IJC20>3.0.CO;2-J. [DOI] [PubMed] [Google Scholar]
- 35.Lebret SC, Newgreen DF, Thompson EW, Ackland ML. Induction of epithelial to mesenchymal transition in PMC42-LA human breast carcinoma cells by carcinoma-associated fibroblast secreted factors. Breast Cancer Res. 2007;9(1):R19. doi: 10.1186/bcr1656. [DOI] [PMC free article] [PubMed] [Google Scholar]
- 36.Parr C, Jiang WG. Hepatocyte growth factor activation inhibitors (HAI-1 and HAI-2) regulate HGF-induced invasion of human breast cancer cells. Int J Cancer. 2006;119:1176–1183. doi: 10.1002/ijc.21881. [DOI] [PubMed] [Google Scholar]
- 37.Ellsworth RE, Seebach J, Field LA, Heckman C, Kane J, Hooke JA, Love B, Shriver CD. A gene expression signature that defines breast cancer metastases. Clin Exp Metastasis. 2009;26:205–213. doi: 10.1007/s10585-008-9232-9. [DOI] [PubMed] [Google Scholar]
Associated Data
This section collects any data citations, data availability statements, or supplementary materials included in this article.
Supplementary Materials
Primers used in RT-PCR. (PDF 20 kb)
Differentially expressed genes between fibroblasts from involved [FN(+): samples 8, 9, 10] as compared to fibroblasts from uninvolved lymph nodes [FN(-): samples 1, 2, 3] from six breast cancer patients. (Student t test, p ≤ 0.01, FDR ≤ 0.01; Fc ≥ 2). Fc: fold change of the ratio. (-): less expressed in fibroblasts from positive nodes. (PDF 65 kb)
Differentially expressed genes between fibroblasts from involved lymph nodes [FN(+): samples 8, 9, 10] co-cultured with MDA-MB231 cells [FN(+).MDA] or cultured alone. Fc: fold change of the ratio FN(+).MDA/FN(+). Three independent assays were performed for each comparison and a paired t test was used to evaluate the data (adjusted p-value ≤ 0.01; Fc ≥ 2; FDR ≤ 0.24). (-): less expressed in co-cultured cells. (PDF 83 kb)
Gene sets associated with fibroblasts from positive nodes co-cultured in the presence of MDA-MB231 cells [FN(+).MDA vs FN(+)] and MDA.MB231 cells co-cultured with fibroblasts from positive nodes [MDA.FN(+) vs FN(+). Microarray data was analyzed using GSEA and all gene sets with gene ontology annotation at molecular function, cellular component and biological process; p<0.01, was considered significant; no gene sets satisfied a FDR <0.25. (PDF 8 kb)
Differentially expressed genes between MDA MB231 cells (MDA) co-cultured with fibroblasts from uninvolved lymph nodes [MDA.FN(-)] or cultured alone. MDA MB231 cells were cultured alone or in the presence of fibroblasts from uninvolved nodes obtained from three breast cancer patients (samples 1, 2, 3). Seventy eight genes differentially expressed by MDA MB231 cells exclusively when co-cultured with fibroblasts from uninvolved nodes (but not from involved nodes) are shown. Three independent assays were performed for each comparison and Student t test was used to evaluate the data (adjusted p ≤ 0.01, FDR ≤ 0.01, and Fc ≥ 2). Fc: fold change of the ratio. (-): less expressed. (PDF 100 kb)
Differentially expressed genes between MDA MB231 cells co-cultured with fibroblasts from both uninvolved [MDA.FN(-)] or involved nodes [MDA.FN(+)] as compared with MDA MB231 cells cultured alone. Seventy seven genes were commonly modulated in MDA cells in the presence of fibroblasts originated from involved as well as from uninvolved lymph nodes. Three independent assays were performed for each comparison and Student t test was used to evaluate the data (adjusted p ≤ 0.01, FDR ≤ 0.01, and Fc ≥ 2). Fc: fold change of the ratio. (-): less expressed. (PDF 97 kb)
Differentially expressed genes between MDA MB231 cells co-cultured with fibroblasts from involved lymph nodes [MDA.FN(+)] or cultured alone. MDA MB231 cells were cultured alone or in the presence of fibroblasts from an involved node obtained from three breast cancer patients (samples 8, 9, 10). One hundred and eleven genes were exclusively differentially expressed by MDA MB231 cells when co-cultured with fibroblasts from involved nodes (but not from uninvolved nodes). Three independent assays were performed for each comparison and Student t test was used to evaluate the data (adjusted p ≤ 0.01, FDR ≤ 0.01, and Fc ≥ 2). Fc: fold change of the ratio. (-): less expressed. (PDF 103 kb)
Proliferation curve of fibroblasts from uninvolved and involved lymph nodes from breast cancer patients. Fibroblasts obtained from three patients without any involved nodes (FN(−): samples 1, 2, 3), and from an involved lymph node (FN(+), as detected by histopathological exam) from another three patients (samples 8, 9, 10), were cultured. After three cell passages, immunocytochemistry revealed positive expression of vimentin. Each point and bar represents the mean and SD of three independent assays performed in triplicate. WST1 kit was used and optical density was transformed to cell number based on a previous calibration curve. Proliferation curves detected no differences in cell growth between fibroblasts from positive and negative nodes (p = 0.5204, Mann–Whitney test). (PDF 44 kb)
Expression of PAK1, DUSP10, PRKRIR, SNN, AHSA1, and PTK2B in breast cancer cells co-cultured with fibroblasts from negative and negative nodes. MDA-MB231 (MDA 231), MCF7, and MDA-MB 435 (MDA 435) cells were co-cultured with fibroblasts from ten patients (five with involved nodes and five with uninvolved nodes) for two or three cell passages. Breast cancer cells co-cultured with fibroblasts from each individual patient had their RNA extracted and equal amounts were pooled for expression analysis. Expression of PAK1, DUSP10, PRKRIR, SNN, AHSA1, and PTK2B was verified by real-time RT-PCR and calculated as relative values to HB4A cells. Results shown in the y-axis represent the log2 expression values (p values inside the figure, Mann–Whitney test). White box breast cancer cell co-cultured with fibroblasts from negative nodes; gray box breast cancer cells co-cultured with fibroblasts from positive nodes. No differences were found in gene expression values. (PDF 49 kb)