Abstract
Non-destructive measurements of contaminated soil core samples are desirable prior to destructive measurements because they allow obtaining gross information from the core samples without touching harmful chemical species. Medical X-ray computed tomography (CT) and time-domain low-field nuclear magnetic resonance (NMR) relaxometry were applied to non-destructive measurements of sandy soil core samples from a real site contaminated with heavy oil. The medical CT visualized the spatial distribution of the bulk density averaged over the voxel of 0.31 × 0.31 × 2 mm3. The obtained CT images clearly showed an increase in the bulk density with increasing depth. Coupled analysis with in situ time-domain reflectometry logging suggests that this increase is derived from an increase in the water volume fraction of soils with depth (i.e., unsaturated to saturated transition). This was confirmed by supplementary analysis using high-resolution micro-focus X-ray CT at a resolution of ∼10 μm, which directly imaged the increase in pore water with depth. NMR transverse relaxation waveforms of protons were acquired non-destructively at 2.7 MHz by the Carr–Purcell–Meiboom–Gill (CPMG) pulse sequence. The nature of viscous petroleum molecules having short transverse relaxation times (T2) compared to water molecules enabled us to distinguish the water-saturated portion from the oil-contaminated portion in the core sample using an M 0–T2 plot, where M 0 is the initial amplitude of the CPMG signal. The present study demonstrates that non-destructive core measurements by medical X-ray CT and low-field NMR provide information on the groundwater saturation level and oil-contaminated intervals, which is useful for constructing an adequate plan for subsequent destructive laboratory measurements of cores.
Keywords: FFD direct push, Heavy oil, NMR, X-ray CT, Vadose zone
Introduction
Contaminated soils confined in core sample tubes are often toxic and harmful. It is thus desirable to be able to collect data on hydrological properties or contaminated intervals by non-destructive measurements of sealed cores without touching harmful chemical species. The collected data are useful for planning subsequent destructive measurements of the cores such as gas chromatography. We propose the use of two non-destructive measurement methods: medical X-ray computed tomography (CT) and time-domain low-field nuclear magnetic resonance (NMR) relaxometry. X-ray CT visualizes the three-dimensional (3-D) distribution of the bulk density within the soil core samples (Petrovic et al. 1982). Because the bulk density is significantly different between saturated and unsaturated porous soils, the degree of water saturation can be detected by X-ray CT (Crestana et al. 1985; Anderson et al. 1988; Tollner and Verma 1989). Thus, CT enables tracing the increase in the water volume fraction in soil core samples with increasing depth, which is important hydrological information for the site. Although some previous CT studies on soil cores exist (Peyton et al. 1992; Fohrer et al. 1999; Jassogne et al. 2007; Taina et al. 2008), there are very few studies on the application of CT to meter-scale-long soil cores sampled from real vadose zones. In the present study, we performed extensive 3-D medical CT imaging of real cores (total length as long as ∼20 m) to demonstrate the successful detection of changes in water volume fraction with depth.
Time-domain low-field NMR relaxometry (not imaging) using permanent magnets (e.g., Anferova et al. 2004) is another promising non-destructive method for soil analysis. Proton transverse relaxation time (i.e., decay constant, T2) of viscous oil molecules is significantly smaller than that of less viscous water molecules (e.g., Dunn et al. 2002). Thus, it is possible to distinguish oil-contaminated soils from clean or water-saturated soils by the time-domain data analysis. The basic idea for the use of low-field NMR to analyze oil-contaminated soils was proposed by Hedberg et al. (1993), Daughney et al. (2000), van der Zwaag et al. (2001), Hertzog et al. (2007), and Bryar and Knight (2008). However, there are few studies on applications to real oil-contaminated soil cores. In the present study, we performed extensive NMR measurements of the real cores contaminated with heavy oil, the same ones analyzed by X-ray CT, to demonstrate the successful detection of oil-contaminated portions of the long cores.
Other extensive, systematic measurements in addition to medical CT and NMR were carried out. In situ measurements using a direct push system equipped with a fuel fluorescence detector (FFD) and electrical conductivity (EC) sensor, as well as time-domain reflectometry (TDR) logging were performed at the contamination site. Destructive measurement of the total petroleum hydrocarbon (TPH) using gas chromatography-flame ionization detector (GC–FID) was carried out in a laboratory to quantify the oil contamination. High-resolution micro-focus X-ray CT (e.g., Seignez et al. 2010) was also performed to supplement the low-resolution medical CT. The extensive data thus obtained using these other techniques were used to assist in the analysis and interpretation of data by medical CT and NMR.
Description of X-ray CT and NMR Systems
X-ray CT System
The measuring principle of X-ray CT and specification of the medical and micro-focus X-ray CT apparatus used are outlined. The CT system (Fig. 1a) used in the present study is a medical whole-body scanner, W2000, manufactured by Hitachi Medical Co. (Tokyo, Japan). It is a third-generation type scanner, with an X-ray tube radiating a two-dimensional X-ray fan beam and a xenon gas detector array. The X-ray tube and detector array embedded in the gantry rotate 360° in 4 s. The intensity of the decayed X-rays penetrating the absorber (i.e., core samples) is measured by the gas detector array. The one-dimensional distribution of the X-ray intensity on the array is recorded as X-ray projection data for each X-ray penetration path. After a mathematical image reconstruction process using the projection data (∼16 s), a 2-D X-ray CT image (i.e., slice) is obtained. Thus, 4 + 16 = 20 s are required to obtain a single slice. The next CT slice for the adjacent portion of the core is obtained by moving the core on the patient’s bed in the longitudinal direction. Beam hardening, one of the most serious artifacts of medical CT, is suppressed by special data processing during image reconstruction (Nakashima 2003).
Fig. 1.
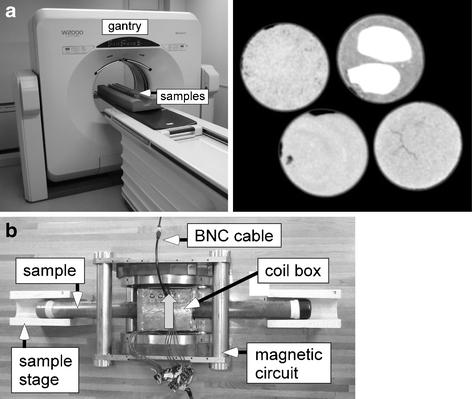
Photographs of the non-destructive measurement systems used. a Gantry unit of the medical X-ray CT system. Four core sample tubes (length ∼1 m, outside diameter 44 mm) from the A12 point are placed in the long urethane foam on the patient bed. An example of a two-dimensional CT image of the four core samples (diameter, 42 mm) is shown rightward. b Magnetic circuit unit using NeFeB and a radio-frequency coil box of the low-field NMR system. A core sample tube (length ∼70 cm, outside diameter 44 mm) is inserted in the coil box. The grey arrow is the direction of the static magnetic field
The CT images obtained show a spatial distribution of the linear X-ray absorption coefficient having a dimension of the reciprocal of the length. The linear X-ray absorption coefficient is conventionally converted into a dimensionless CT number in Hounsfield units (HU) considering air and water to be standards (e.g., Taina et al. 2008). For example, the linear X-ray absorption coefficients of bulk samples of air, water, and quartz are −1,000, 0, and 1,900 HU, respectively.
The linear X-ray absorption coefficients increase with increasing bulk density and atomic number of the sample (e.g., Nakashima 2000). For example, the two bright objects (pebbles) embedded in the right-top core in Fig. 1a can be readily identified owing to the significant high density compared to the less dense porous sandy matrix. However, it should be noted that it is technically difficult to distinguish between contaminated soils having oil-filled pores and clean soils having water-filled pores. This is because the difference in the atomic number and bulk density between petroleum and water is almost negligible, rendering such discrimination difficult. We have measured bulk samples of heavy crude oil by the same CT system as in Fig. 1a to obtain CT numbers of –120 HU (sulfur 0.3 wt.%) and –60 HU (sulfur 3 wt.%). These values are very close to the CT number of bulk water (i.e., 0 HU). We have also measured a water-saturated homogeneous sand sample with porosity of ∼30 vol.% taken from the A1 point of Fig. 2; the obtained CT number of the bulk sand sample obeyed the Gaussian distribution (e.g., Tsuchiyama et al. 2005; Jin et al. 2006) with a standard deviation of ∼50 HU at the voxel dimension of 0.31 × 0.31 × 2 mm3. The fluctuation of ∼50 HU of the macroscopically homogeneous sample is derived from the partial volume effect (Ketcham and Carlson 2001) of the porous sand sample. To overcome the undesirable fluctuation and to successfully distinguish a Gaussian distribution of the oil-contaminated sand from the neighboring one of the water-saturated sand, the CT number difference of ∼2×(standard deviation)/(porosity) ≈300 HU is needed between bulk oil and bulk water. Unfortunately, the difference measured was as small as 120 and 60 for sulfur 0.3 and 3 wt.%, respectively. Thus, due to the small difference in CT number, it is technically difficult to distinguish between oil-contaminated soils and clean water-saturated soils. Although this is not the case of the present study, suppose that the groundwater contamination by heavy ions occurs. Because the CT number of the contaminated groundwater increases by the strong X-ray absorption of the heavy elements (Goldstein et al. 2007), the detection of the oil-contaminated core portion by X-ray CT becomes more feasible. For example, the CT number of the bulk MnCl2 aqueous solution of 1 mol/L is ∼300 HU (Nakashima 2000), satisfying the condition calculated above. Thus, if MnCl2 of 1 mol/L exists only in pore water (not in oil), the discrimination of oil-contaminated soils from soils saturated by Mn-contaminated groundwater is possible by X-ray CT.
Fig. 2.
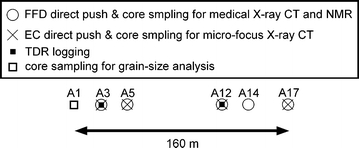
Location map where direct push probing, TDR logging, and core sampling were performed. Associated with the EC probing, the groundwater was sampled at the A17 point using the same direct push machine
Another type of X-ray CT, micro-focus X-ray CT, is useful to image microscopic pores (Macedo et al. 1998) that cannot be imaged by the low-resolution medical CT shown in Fig. 1a. We used a micro-focus CT system, SMX-225S, by Shimadzu (Kyoto, Japan). The photo of the CT system is omitted because it has been published elsewhere (Nakashima and Nakano 2008). A three-dimensional cone beam X-ray (not a 2-D fan beam) from an X-ray tube penetrates a rotating small sand sample of ∼1 cm3, and 3-D CT images were reconstructed by a computer in a few hours. The directivity of the X-ray beam cone is tuned as fine as possible to achieve micrometer-scale-high resolution, so that the photon flux of the X-ray beam becomes small. Thus, it was impossible to penetrate a large soil core (outside diameter, 44 mm), and re-sampling of the soil by opening the sealed core was needed. Although micro-focus CT imaging is not non-destructive, pore-scale imaging by the micro-focus CT was employed in the present study to confirm the predictions of the medical CT that the soil pore space is occupied by more water with increasing sampling depth of the core. High-resolution CT images enable us to perform the quantitative pore-scale analysis (e.g., Peth 2010). In the present study, quantitative electric current computer simulation using the micro-CT images was carried out to confirm the image accuracy by comparing the simulated formation factor (i.e., normalized resistivity) of the water-saturated soils with the formation factor measured by the in situ electrical conductivity direct push method.
The reliability of the X-ray CT apparatus as a measuring tool is satisfactory. For example, the reference materials (bulk air and bulk water) were imaged by the medical CT to obtain a Gaussian distribution of the CT number histogram with a standard deviation of as small as ∼6 HU. The most serious error in the obtained CT number is derived from the porous sample (not CT apparatus); it is the partial volume effect governed by the ratio of the pore size to the voxel dimension (Ketcham and Carlson 2001). As mentioned above, the CT number fluctuation by the partial volume effect is as large as ∼50 HU for the sand sample imaged by the medical CT system; the fluctuation is also large for high-resolution micro-focus CT. This undesirable fluctuation is also discussed in the present study.
NMR System
The measuring principle of NMR relaxometry and specification of the NMR apparatus used are briefly described. The principle of time-domain NMR relaxometry used in the present study is to measure the transient relaxation of protons of pore fluid molecules to quantify the fluid amount using the amplitude of the obtained transient signal and to discriminate oil from water by the difference in the transverse relaxation time, T2 (e.g., Dunn et al. 2002). The low-field NMR system used in the present study consists of a NeFeB permanent magnet and a home-built radio-frequency coil box (Fig. 1b). The BNC cable in Fig. 1b is connected to the spectrometer unit with a personal computer. The strength of the magnetic field at the center of the magnetic circuit is 0.064 T, and the corresponding proton Larmor frequency is 2.7 MHz. Protons in the soil samples (i.e., 1H nuclei of water and petroleum molecules) are magnetized in the direction of the static magnetic field, as shown by the arrow in Fig. 1b. The diameter of the solenoid coil in the shielded coil box is 54 mm, in which can be inserted a long soil core of outside diameter 44 mm. The solenoid coil is made by 35-turns coated copper wire of diameter 0.75 mm and the length is about 60 mm, which is the size of the sensed region in the longitudinal direction. The nuclear spins of the protons are excited by the electromagnetic waves of the resonant frequency made by the solenoid coil in Fig. 1b, and the subsequent relaxation process is detected based on Faraday’s law of induction using the same coil.
A conventional Carr–Purcell–Meiboom–Gill (CPMG) pulse sequence (e.g., Coates et al. 2001) was used to acquire data on the transient transverse relaxation of protons. The obtained CPMG data, x(t), was time-series data acquired at a constant sampling interval (i.e., echo spacing). A model assuming a single exponential decay predicts that x(t) obeys:
 |
1 |
where t is the time and M 0 is the initial amplitude in arbitrary units. Multi-exponential fitting was not needed in the present study because only core portions with pores completely filled with water or with oil were measured, and portions with pores filled with a mixture of water and oil were not measured. The quantity M 0 is proportional to the amount of 1H in the sensed region of the solenoid coil system and can be quantified if calibration was performed. The quantity T2 is a measure of the microscopic mobility of fluid molecules activated by thermal energy and decreases with increasing pore fluid viscosity (e.g., Coates et al. 2001). Thus, it is possible to discriminate viscous oil from less viscous water by the difference of the fitted T2 values.
The data reproducibility of the NMR apparatus used was checked as follows using two reference materials (bulk water and water-saturated clean sand sampled from the site studied). About ten CPMG measurements were repeated for each reference sample to calculate the statistical fluctuation of M 0 and T2 values. The results showed that the ratios of the standard deviation to the average are less than ∼6% (typically ∼3%) for M 0 and T2, and thus the data reproducibility is satisfactory. The error by least-squares fitting to Eq. 1 is more serious than the data reproducibility and is discussed quantitatively in the present study.
Application to an Oil-Contaminated Site
In Situ Measurements by Direct Push and TDR Logging
The site condition and in situ measurements performed at the site are described. The positions of the exploration and core sampling of the oil-contaminated site studied are shown in Fig. 2. The site is a vacant lot which used to be a petroleum facility in Honshu Island, Japan. The site consists of well-sorted medium to coarse sands as revealed by the conventional grain-size analysis of A1 point core samples (Fig. 3) using a LA-300 laser diffraction particle size distribution analyzer (Horiba, Kyoto, Japan). The groundwater table is located 0.7- to 1.0-m deep, depending on the weather or rainfall. Petroleum contamination into the very shallow subsurface (a few meters deep) occurred due to a natural hazard. We performed systematic and extensive in situ geophysical measurements and direct push measurements at the site to evaluate the spatial extent and quality of the oil contamination (Jinguuji et al. 2008; Yokota et al. 2008; Jinguuji and Uchida 2009; Mitsuhata et al. 2009; Sato et al. 2009).
Fig. 3.
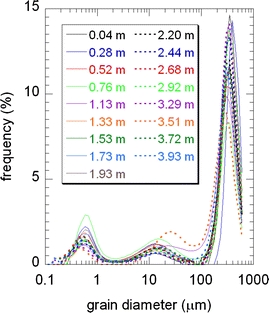
Grain size distributions of seventeen sand samples of the A1 point cores wherein no oil contamination was found. The sampling depth is indicated. The sum of the frequency over 64 bins along the grain diameter axis is 100%. Note that the grain size distribution is almost depth independent and the statistical mode of the histogram is as coarse as about 300 μm
One of the important data sets obtained in the above mentioned in situ measurements is FFD/EC data obtained by the direct push technique. The FFD technique is based on fluorescence spectroscopy of petroleum molecules stimulated by ultraviolet light (Lieberman 1998). Two spectroscopic bands were available for the FFD probe used (Vertek, VT, USA): low-wavelength FFD (280–450 nm, LFFD) and high-wavelength FFD (over 450 nm, HFFD), which are respectively sensitive to light oil and heavy oil. The EC method measures the current and voltage using four electrodes on the probe surface according to the conventional Wenner method. By pushing the probes equipped with the FFD and EC sensors into the ground, it is possible to obtain the depth profile of the oil contamination and electrical conductivity. The FFD and EC probings were performed by two direct push machines, 6625CPT and 6610DT (Geoprobe Systems, KS, USA), respectively, at the points indicated in Fig. 2 (Mitsuhata et al. 2009; Sato et al. 2009). Some of the obtained FFD and EC data were used in the present study to show the depth interval of the oil contamination and to check the accuracy of the CT-based formation factor simulations, respectively.
Another important data set relevant to the present study is the depth profile of the water volume fraction measured by TDR logging. The TDR technique is based on the fact that the velocity of an electromagnetic wave depends on the water content of porous soils (Topp and Davis 1985). The TDR logging system was developed and in situ measurements were performed in the boreholes at the A3 and A12 points in Fig. 2 (Jinguuji, unpublished data). A part of the TDR data was used in the present study to calibrate the NMR signal amplitude (i.e., M 0) to the water volume fraction of the core samples.
Laboratory Measurements by X-ray CT and NMR
The laboratory measurements of the soil core samples performed mainly by medical CT and low-field NMR and additionally by micro-focus CT and GC–FID are described. Soil cores, each ∼1 m in length, were sampled down to a depth of 4 m at six points (Fig. 2) using the direct push machine 6610DT. The core sample tube (outside diameter 44 mm, inside diameter 42 mm) was made of transparent plastic and was capped and sealed at both ends immediately to prevent water evaporation. We carried out the non-destructive measurements at a laboratory using the medical X-ray CT and NMR shown in Fig. 1 for the soil cores from five points, namely A3, A5, A12, A14, and A17 (the total length was as long as ∼4 × 5 ≈ 20 m). To supplement the CT and NMR data, the A1 point core sample without contamination was used for the conventional grain size distribution analysis (Fig. 3).
Four cores, each ∼1 m in length from a single sampling point, were placed on a patient’s bed of the CT scanner (Fig. 1a) and imaged simultaneously. The imaging conditions of the medical CT used were as follows. The acceleration voltage of the X-ray tube was 120 kV, the tube current was 75 mA, the number of X-ray projections was 3,000, and the Shepp–Logan reconstruction filter was used. The field of view was 160 mm in diameter, and the slice image consists of 512 × 512 voxels with a slice thickness of 2 mm, indicating that the voxel dimension was 0.31 × 0.31 × 2 mm3. In total, ∼2,100 slices were collected as 16-bit grey-scale 2-D TIFF images for the five sampling points. Voxels corresponding to the sandy sediment were chosen from the original 512 × 512-voxels image as a region of interest. The chosen sub-images were converted into 8-bit grey scale and stacked in the longitudinal direction of the core to obtain a 3-D image of each core. An original Mathematica® program, Itrimming16to8.nb, was used in this image processing, which is publicly available on the authors’ website, http://staff.aist.go.jp/nakashima.yoshito/progeng.htm. The 3-D CT image of each core was carefully examined to trace the CT number increase with depth derived from the increase in the degree of water saturation with depth.
In the NMR measurements, we examined all the cores from the A3, A5, A12, A14, and A17 points carefully to choose 16 portions where heavy oil contamination was observed and 28 portions where no significant contamination occurred. Nine of the 28 portions mentioned above were core portions of the vadose zone (i.e., 0- to 1-m depth) where a low degree of water saturation was expected. Each core of ∼1-m length was inserted into a coil box (Fig. 1b), and the transverse relaxation of protons of the chosen portion was measured non-destructively in a laboratory using the CPMG pulse sequence. Acquisition parameters for the CPMG measurements were as follows. The duration of the radio-frequency pulse was 60 μs, the echo spacing (i.e., time interval between π-pulses) was 300 μs, the repetition time of the CPMG pulse sequence was 2 s, and the number of the signal stacking was 128. Thus, the total time required for the data acquisition was 2 × 128 = 256 s for each portion. Frequency tuning and impedance matching of the coil box were carefully performed for each portion of the cores. The quantity M 0 was determined as the amplitude of the raw CPMG time-series data (i.e., CPMG value as t → 0). The obtained M 0 value is in arbitrary units (not in hydrogen density) and should be converted to the corresponding water or oil fraction by calibration. Because the viscosity and hydrogen number per bulk fluid volume are different for water and petroleum molecules, different calibration coefficients are needed for water- and oil-saturated cores. The calibration of the water volume fraction was carried out using the TDR logging data; that of the oil weight fraction was performed using GC–FID data, as mentioned further below. The relaxation time T2 was obtained by least-squares fitting of x(t) to Eq. 1. The set of M 0 and T2 values are plotted on a two-dimensional M 0–T2 plane to distinguish clean core portions and oil-contaminated core portions.
After the non-destructive measurements, we opened the cores to take photographs with a digital camera and re-sampled a small quantity of sandy sediments for the micro-focus X-ray CT imaging and the TPH analysis. Micro-focus CT was performed for 12 samples from A3, A5, A12, and A17 point cores. For this, a small volume of sand was placed in a cylindrical plastic sample case (outside diameter 1 cm, length 3 cm) and imaged by the micro-focus CT system, SMX-225S. The 12 samples for the micro-focus CT include partially saturated samples from the vadose zone and fully saturated samples from beneath the water table. The imaging conditions were as follows: the acceleration voltage was 130 kV, the tube current was 0.13 mA, the number of X-ray projections was 600, and a Laks reconstruction filter was used. The duration of X-ray exposure (i.e., time required for 360° sample rotation) was 640 s and the geometrical magnification factor was 14. The reconstructed 2-D slice image consists of 1,024 × 1,024 voxels, and each voxel was a cube of 10.23 μm3. About 600 slices of 16-bit grey-scale TIFF were collected for each sample. The same image processing mentioned previously using the Itrimming16to8.nb program was performed to obtain an 8-bit 3-D image of the region of interest.
To supplement the NMR data, the following destructive analysis was also performed in a laboratory. Sandy sediments, each 200 g in weight, were sampled from the A3, A5, A12, and A17 point cores. The TPH concentration was measured for the samples using the GC–FID method (Nishiwaki and Kawabe, unpublished data). A part of the GC–FID data was used in the present study to calibrate the CPMG signal amplitude in arbitrary units, M 0, with respect to the TPH concentration in milligrams per kilogram.
Results
X-ray CT
The results by the medical and micro-focus CT are summarized for the most part in terms of the detection of the groundwater saturation level. The results of the medical X-ray CT analysis for the A3 and A12 points are shown by Figs. 4 and 5, combined with the results obtained using a digital camera, FFD, and NMR. Although we also obtained the same data as in Figs. 4 and 5 for other points A5, A14, and A17, they are omitted from this report due to length limitations. In the figures, the photo on the left column taken with a digital camera shows the open core after non-destructive measurements by medical CT and NMR. The longitudinal-to-transverse ratio of the core dimension is reduced in the photos by anisotropic enlargement to display the sedimentary structure of the core more clearly. The cross-sections of the core CT images parallel to the longitudinal direction are shown in the center column. The transverse dimension of the sandy sediments of the core is 42 mm for the CT image. The 8-bit grey-scale image (e.g., see Fig. 1a) is converted to a rainbow color in Hounsfield units (–500 to 1,900 HU). So, for example, the white pebbles in Fig. 1a are seen as red in Figs. 4 and 5. The longitudinal-to-transverse ratio of the core CT images in Figs. 4 and 5 is also reduced to show the sedimentary structure within the core. As a result, the red pebbles mentioned above are unusually oblate in shape.
Fig. 4.
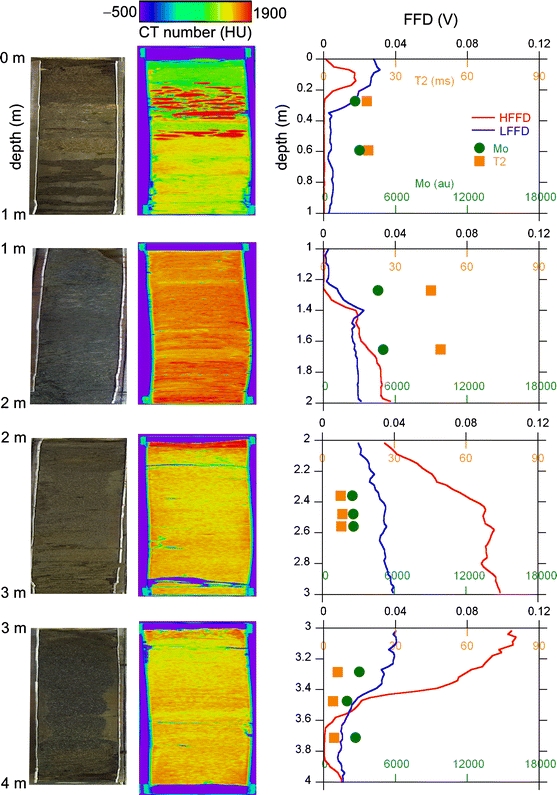
Unified results of the analyses at the A3 point using a digital camera, medical X-ray CT, FFD, and NMR
Fig. 5.
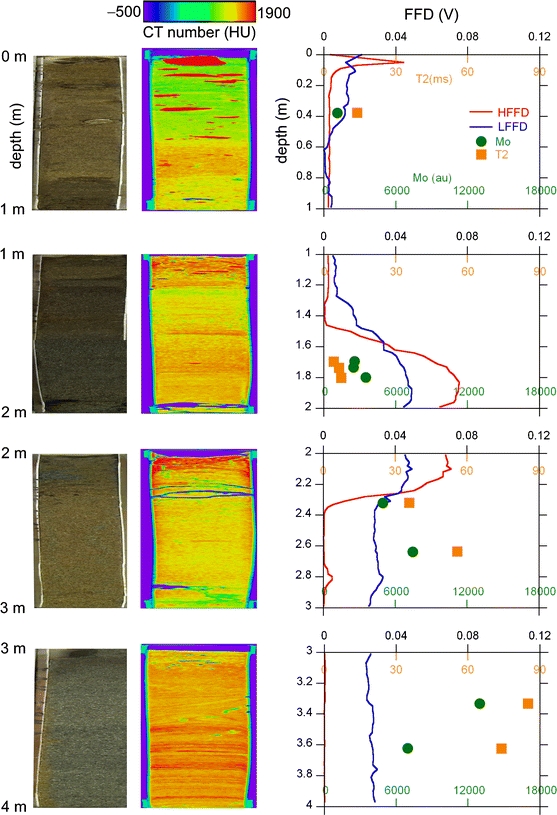
Same as Fig. 4 but for the A12 point
The longitudinal dimension of the core is significantly less than 1 m. The real longitudinal lengths of the recovered four core samples were 66, 78, 75, and 63 cm for the interval of 0–1, 1–2, 2–3, and 3–4 m, respectively, in Fig. 4; they were 63, 75, 72, and 90 cm for the interval of 0–1, 1–2, 2–3, and 3–4 m, respectively, in Fig. 5. This implies that the soil core was compressed considerably by percussion during sampling and/or some soils were lost during the removal operation of the soil-filled sample tube from the direct push machine. Assuming that only uniform compression of the soil occurred, the digital camera photo and medical CT image were elongated uniformly to 1 m in Figs. 4 and 5 to fit the in situ FFD data that are free from the problem of soil compression/loss. The undesirable effects of the loss and inhomogeneous compression cannot be corrected by this uniform elongation. Thus, it should be noted that an inevitable error occurs when comparing the core depth with the direct push depth.
The HFFD direct push data successfully detected zones contaminated with heavy oil at around 3-m depth for the A3 point (Fig. 4) and around 2-m depth for the A12 point (Fig. 5). The FFD signal spikes at depths shallower than 50 cm are ghost signals derived from the undesirable detection of sunlight. Figures 4 and 5 demonstrate that there is no significant correlation between the oil contamination (FFD data) and the X-ray CT image. This is a consequence of the fact that the linear X-ray absorption coefficients of petroleum and water are almost the same.
Most importantly, Figs. 4 and 5 clearly detected the transition from the vadose zone to the water-saturated zone as an increase in the CT number with increasing depth. The CT number of the soil matrix changed systematically from ∼1,000 HU (green) at ∼0-m depth to ∼1,400 HU (yellow) at ∼1-m depth. The same systematic change was also observed for the core CT images of other points, A5, A14, and A17. In terms of the physics of the X-ray absorption, the CT number increased with the bulk density averaged over the voxel of 0.31 × 0.31 × 2 mm3. Thus, if the pore water volume increases in the voxel, it can be detected as an increase of the CT number. The systematic change of the CT number of the soil matrix from 0- to 1-m depth described above is a consequence of this physics. The increase in the CT number with an increase in the degree of water saturation found in previous studies (Crestana et al. 1985; Anderson et al. 1988; Tollner and Verma 1989) has been confirmed for real long core samples in the present study.
The increase in the CT number with depth was analyzed more quantitatively as follows. A region of interest of 1002 voxels was chosen from each slice, and the CT number of the chosen region was averaged. To avoid the undesirable choice of voxels of macroscopic voids/cracks filled with air/water with very small CT numbers and of pebbles with very large CT numbers, only voxels ranging from 100 to 1,800 HU were averaged. The obtained average represents the bulk density or water volume fraction of the soil matrix at the specific depth. The depth profile of the averaged CT number is shown in Fig. 6 for the A3 and A12 points. The soils in the cores had loosened during transport from the site to the laboratory, and this is responsible for the unusual drops in the CT numbers at the core ends (i.e., 0-, 1-, and 2-m depth). As previously described, the standard deviation of the Gaussian CT number distribution is ∼50 HU for the macroscopically homogeneous sand sample imaged by the medical CT system at the voxel dimension of 0.31 × 0.31 × 2 mm3. This value of 50 HU is shown as a half-length of the error bar in Figs. 6a, b. Although such undesirable fluctuation derived from the partial volume effect exists, the obtained CT depth profile reconfirms the increase of the soil matrix CT number with depth in Figs. 4 and 5, except for the unusual drops at the core ends.
Fig. 6.
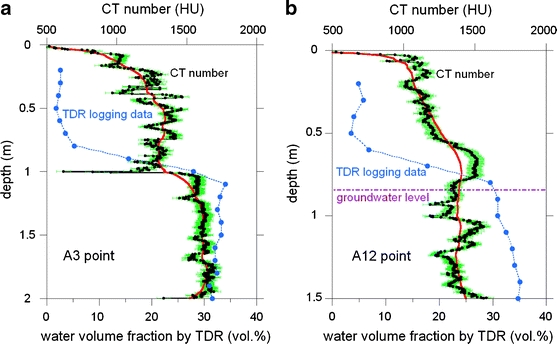
Depth profiles of the averaged CT number of the core samples and of the in situ water volume fraction obtained by TDR logging at the A3 (a) and A12 (b) points. The red curve was obtained by smoothing the black profile of the CT number. The half-length of the green error bar is 50 HU. The groundwater level (0.85-m depth) measured at the A12 point by inserting a long wooden rod into the borehole is also indicated in b
The depth profile of the averaged CT number shown in Fig. 6 was checked with other data, namely, TDR logging data. The depth profile of the water volume fraction measured by in situ TDR logging at the boreholes of the A3 and A12 points is plotted in Fig. 6. The groundwater level was at a depth of 0.85 m at the A12 point and agreed well with the TDR data, indicating that the soil is saturated completely with water below ∼1 m. This demonstrates the reliability of the TDR logging data. Figure 6 shows a clear correlation between the profile of the CT number and that of the water volume fraction. The smoothed CT number in red increases with depth to the ground water level located at ∼1-m depth and becomes constant below ∼1 m. The depth profile of the water volume fraction revealed by the TDR logging is responsible for this behavior of the CT number. The difference of the smoothed CT number at 0.3 and 1.5 m depth is ∼400 HU for the A3 point and ∼300 HU for the A12 point. On the other hand, the TDR data imply that the water volume fraction increased by ∼30 vol.% between a depth of 0.3 and 1.5 m. The CT numbers of the bulk air and water are –1,000 and 0 HU, respectively. Thus, the increase in the water volume fraction of 30 vol.% at the expense of the air volume fraction theoretically predicts the increase of the CT number of (0–(−1,000)) ×0.3 ≈ 300 HU. This predicted value agrees well with the measured difference in the CT number of ∼300 and ∼400 HU, supporting our interpretation that an increase in the CT number with increasing depth observed by the medical CT is derived from the transition from the vadose zone to the water-saturated zone.
The increase in the pore water fraction with depth was confirmed directly by pore-scale 3-D imaging using high-resolution micro-focus CT (Fig. 7). The voxel dimension of Fig. 7 is 10.23 μm3, much smaller than that of the medical CT of 0.312 × 2 mm3. This high-resolution CT technique could visualize the water in small pores in the soil samples. As predicted by Fig. 3, the soil is a random packing of medium to coarse sand grains, and the pores are filled with air or water. The gross positions of typical constituents of sand samples (air, water, quartz grain, and iron oxide grain) are indicated by solid arrows in the histogram of Fig. 7. Figure 7 shows that the number of pore water voxels in green at a 3.86-m depth is large compared with that of the 0.14-m depth at the A17 point. The increase in the water voxels at the expense of air voxels with increasing depth was observed for the micro-focus CT images of the samples from other points, namely, A3, A5, and A12. Taking the difference of the two histograms in Fig. 7, the increase in the water voxels was estimated to be ∼30 vol.%. This value agrees well with the difference of the water volume fraction between 0.3- and 1.5-m depth estimated by TDR logging as described above, again supporting our interpretation that an increase in the CT number with increasing depth observed by the medical CT is derived from the transition from the vadose zone to the water-saturated zone.
Fig. 7.
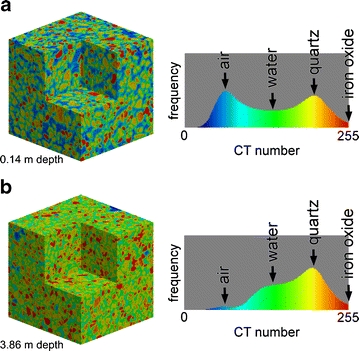
3-D micro-focus CT images of samples from the A17 point. The sampling depth is 0.14 m for a and 3.86 m for b. Each image dimension is 5003 voxels = 5.13 mm3. The histogram of the voxel values (i.e., dimensionless 8-bit CT number, not in HU) is also shown
The histogram of Fig. 7 shows that the quartz and air component obey the Gaussian distributions with large standard deviations derived from the undesirable partial volume effect. For example, the ratio of the standard deviation to the average for the quartz component is about 50 HU/1,500 HU ≈ 0.03 for the medical CT data (Fig. 6a, b); the ratio is as large as ∼0.1 for the micro-focus CT data of Fig. 7. The smaller dimension of the voxel of the micro-focus CT image is responsible for the larger fluctuation of the Gaussian distribution. Although such a large fluctuation in the CT number exists, the image precision of Fig. 7 is satisfactory as demonstrated by the following computer simulations.
The computer simulations were DC current simulations in the network of the conductive pore water voxels to predict the formation factor. The predicted value was compared with the measured value obtained by the in situ direct push measurement. First, the extraction of the water voxels was performed. The histogram for the 3.86-m depth in Fig. 7b consists of four components (i.e., air, water, quartz, and iron oxide). The iron oxide is omitted in the following because it is over-saturated (i.e., ≥255) in the 8-bit CT number histogram. Three components (i.e., air, water, and quartz) can be well approximated by Gaussian distributions, and the average, variance, and area were determined by the least-squares method (Fig. 8a). The interval of 99 to 167 in Fig. 8a, of which the area and mid-point are identical to those of the fitted Gaussian distribution for water, was assigned to water. Using this interval for water, cluster labeling image analysis (Nakashima et al. 2004; Nakashima et al. 2008) was applied to the system of 5003 voxels in Fig. 7b to extract the 3-D percolation network of the pore water. The volume fraction of the percolated pore water was 34.6 vol.%. Assuming that water is conductive and air and solid minerals are insulators, the formation factor or normalized resistivity of the porous media filled with water can be calculated by solving the 3-D Laplace equation for the steady-state electric current (Arns et al. 2001; Nakashima and Nakano 2008). The 3-D distribution of electrostatic potential of the 5003 voxels was determined numerically by the conventional successive over-relaxation method (Fig. 8b), and the local electric current can be calculated by taking the spatial gradient of the potential distribution. The sum of the local current flowing into (or out of) the 5003-voxels system is reciprocally proportional to the bulk resistivity of the porous sediment. Thus, the formation factor is calculated by normalizing the sum of the local current for Fig. 8b by that for the reference system with porosity of 100 vol.%. As a result, the formation factor of Fig. 8b was estimated to be 7.0. On the other hand, the EC direct push was performed at the A17 point, and the electrical conductivity of the soil was 2.20 mS/m at 3.86-m depth and 1.60 mS/m for the depth interval of 3.7 to 4.0 m. The groundwater was sampled at the interval of 2.5- to 3.0-m depth at the A17 point, and the electrical conductivity of the bulk groundwater was 13.5 mS/m. Thus, the formation factor is 13.5/2.20 ≈ 6.1 or 13.5/1.60 ≈ 8.4. These values agree well with the simulated value obtained by solving the Laplace equation (i.e., 7.0), demonstrating the acceptable accuracy of the obtained micro-focus CT images.
Fig. 8.
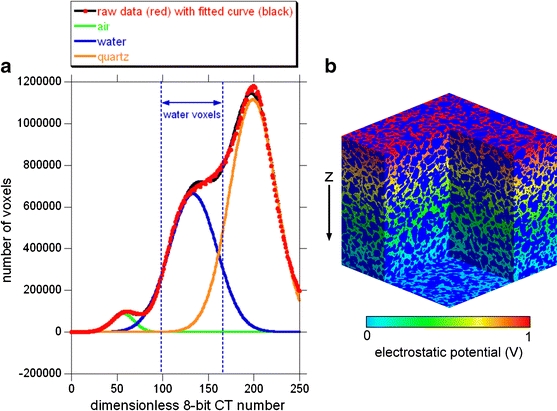
Extraction of the percolated water-filled pore network and results of the electric current simulation in the pore network for the image system of Fig. 7b. a Decomposition of the histogram of the dimensionless 8-bit CT number into three Gaussian components (i.e., air-, water-, and quartz-filled voxels) by the least-squares method. b Results of the numerically solved Laplace equation for the electrostatic potential distribution. The macroscopic potential difference of 1 V was applied along the z-direction. Dark blue, solid mineral grains and air-filled pores; light blue to red, local electrostatic potential of the percolated water-filled pore network. The dimension of the image system is 5003 voxels = 5.13 mm3
NMR
The results by the NMR relaxometry are summarized in terms of the detection of the oil-contaminated core portions. Examples of CPMG raw time-series data, x(t), are shown in Fig. 9. It is evident that T2 for the oil-contaminated portion is significantly smaller than that for the clean portion. This is a consequence of physics: that T2 of viscous oil molecules is smaller than that of the less viscous water molecules. The application of least-squares fitting to Eq. 1 using the noisy time-series data of Fig. 9 yields inevitable fitting errors. However, we have confirmed that the magnitude of the errors for M 0 and T2 is equal to or smaller than the dimension of the data points in Figs. 4, 5, 10, and 11. Thus, the error bar is omitted in these figures.
Fig. 9.
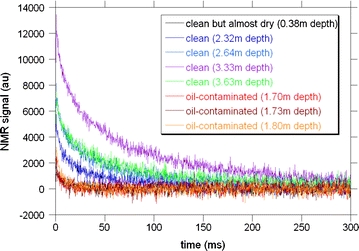
Eight examples of CPMG waveform data (arbitrary units) for soil cores from the A12 point. The depth of the measured core portions and the degree of oil contamination are indicated. Clean indicates that the pore fluid is water (not oil)
Fig. 10.
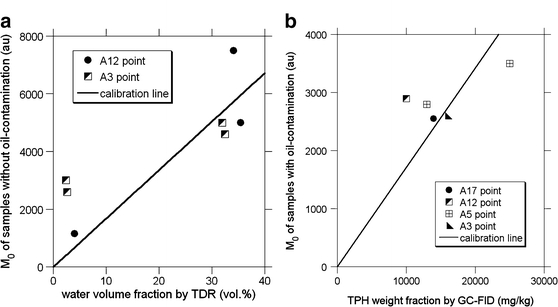
Calibration of NMR data. a Water volume fraction in volume percent versus M 0 in arbitrary units. b TPH weight fraction versus M 0. The correlation coefficients are 0.59 and 0.73 for a and b, respectively
Fig. 11.
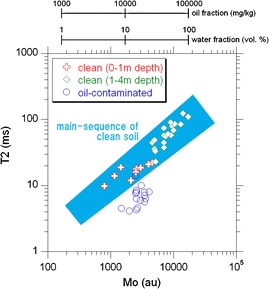
Plot of all 44 NMR data points (A3, A5, A12, A14, and A17) on the M 0 –T2 plane. The clean sample data points are grouped in two, based on the sampling depth (i.e., gross degree of water saturation). The quantity M 0 for clean and oil-contaminated samples is converted into the water volume fraction and oil weight fraction using Fig. 10a, b, respectively
The quantities M 0 and T2 were determined using x(t) data for each portion of the core and were plotted in Figs. 4 and 5. The soils in the core tube were compressed significantly by percussion during sampling and/or lost during the removal operation of the soil-filled sample tube from the direct push machine. Assuming that only uniform compression of the soil occurred, the depth position of the NMR data was corrected in Figs. 4 and 5 to fit the in situ HFFD/LFFD data that are free from the undesirable soil compression/loss. Effects of the loss and inhomogeneous compression cannot be corrected by this uniform elongation. Thus, the depth values of the NMR data points do not exactly equal those of the HFFD/LFFD direct push data points. For example, while according to the core observations by naked eyes the portion for the NMR data point at ∼3.7 m depth of the A3 point in Fig. 4 is obviously heavily contaminated with viscous oil, the HFFD data indicate that the contaminated interval is terminated at ∼3.6-m depth, and no significant contamination should be detected at 3.7-m depth. Whereas the portion for NMR data points at ∼2.3 m depth of the A12 point in Fig. 5 is evidently clean based on observation of the opened core, the HFFD data indicate that the heavy oil contamination survives down to a depth of ∼2.4 m. Although such small discrepancies of about 10 cm exist, Figs. 4 and 5 show that the T2 values for the depth points where HFFD detected the heavy oil contamination are systematically smaller than those where no contamination was detected by HFFD. This again is a consequence of the physics that T2 of viscous oil molecules is smaller than that of the less viscous water molecules.
The obtained M 0 value is in arbitrary units (not hydrogen density) and should be converted into water or oil fraction by calibration. Because the viscosity and hydrogen number per bulk fluid volume are different between water and petroleum molecules, two different calibration methods should be performed. The calibration of the water volume fraction was carried out using the TDR logging data at the A3 and A12 points. Seven depth points, wherein both NMR and TDR measurements were conducted, were used for the calibration. The cross-plot of the TDR data against NMR data enables the conversion of M 0 to water volume fraction (Fig. 10a). Another calibration for the oil weight fraction was performed by the use of the GC–FID data of the heavily contaminated soil samples from the A3, A5, A12, and A17 points. The results of the GC–FID analysis show that a significant amount of viscous heavy oil molecules having many carbon atoms exists at the site. For example, a soil sample from the A5 point contains C6–C12 oil of 530 mg/kg and C13–C44 oil of 24,470 mg/kg (TPH is 25,000 mg/kg). Five depth points where both NMR measurements and GC–FID analysis were performed were used for the calibration. The cross-plot of the GC–FID data against NMR data enables the conversion of M 0 to TPH (Fig. 10b).
The set of M 0 and T2 values were plotted on a two-dimensional M 0–T2 plane to distinguish between clean core portions and oil-contaminated core portions (Fig. 11). The calibration of Fig. 10 was incorporated in the horizontal axis. A few data points for clean (i.e., water saturated) samples show unusually large water fraction values (e.g., almost 100 vol.%). This is probably derived from the relatively small correlation coefficients of the calibration line (Fig. 10a). Figures 4, 5, and 6 show that the vadose zone or partially saturated zone is located at a depth of 0 to ∼1 m. This is confirmed by Fig. 11 in the form of small water fraction values for samples in the depth range of 0 to 1 m. The main sequence refers to a region in which all data points for clean soil samples without oil contamination fall. In the sequence, the quantity T2 increases with M 0 or the water volume fraction of the porous soil. This is a consequence of the underlying physics that proton relaxation time increases with an increasing degree of fluid saturation in porous media (Hedberg et al. 1993). The depth dependence of the pore size of the soil sediments of the site is another possible reason for the trends of the data points in the main sequence. However, the depth independence of the grain size distribution (Fig. 3) and pore CT images (Fig. 7) implies that the pore size distribution is also independent of depth. Thus, the effects of the depth dependence of the pore size on T2 values (e.g., Dunn et al. 2002) are negligible in the interpretation of the main sequence. Except for a single data point (i.e., 2.4-m depth of the A5 point), all data points for the contaminated portions are located beneath the region of the main sequence. This is due to the fact that the T2 of viscous oil molecules is smaller than that of the less viscous water molecules. Most importantly, Fig. 11 shows that (1) all data points of the clean core samples without oil contamination fall in the main-sequence and (2) almost all data points of the oil-contaminated samples are located out of the main sequence. This enables us to distinguish clean core portions from oil-contaminated portions non-destructively by means of time-domain low-field NMR relaxometry.
Discussion
X-ray CT
X-ray CT can visualize the internal structure of harmful contaminated cores that cannot be obtained by conventional observations of the core surface. For example, CT images in Figs. 4 and 5 revealed that many pebbles are embedded in the depth interval of 0 to 0.5 m and that the soil is significantly banded at the depth interval of 3 to 4 m of the A12 point core. The CT images also show that undesirable cracking occurred at ∼2.3-m depth of the A12 point core. These features as revealed by medical CT cannot be obtained by conventional observation methods of the core surface using a camera or with naked eyes. Thus, the present study successfully demonstrated that medical CT scanning is useful for soil core analysis without touching the harmful chemical species that might be present.
The medical X-ray CT analysis successfully detected the transition from the vadose zone to the water-saturated zone, in terms of the increase in the CT number with increasing depth (Figs. 4 and 5). Other supplemental data of TDR (Fig. 6) and micro-focus CT (Fig. 7) support the interpretation that the change in the water volume fraction is responsible for the systematic change of the CT number with depth. This interpretation is based on simple and robust physics that the CT number increases with an increase in the bulk density of the fluid-containing porous soil sample. Thus, the method described in the present study is applicable to soil cores from various sites.
The spatial distribution of groundwater governs material transport within and between vadose zones and saturated zones (e.g., Chen et al. 2002). Thus, the transition profile of the water volume fraction obtained by CT (Fig. 6) is important hydrological information for the site. This information is useful in formulating an adequate plan for a possible subsequent destructive analysis of the cores (e.g., time-consuming hydraulic permeability test using centrifugal force; van den Berg et al. 2009). Although no aquitard was detected at the site consisting of medium to coarse sand grains (Fig. 3), medical CT can be potentially used to identify high-porosity perched aquifers with low CT number underlain by a low-porosity aquitard with high CT number. X-ray CT can also potentially detect preferential flow paths (Luo et al. 2008; Mooney and Morris 2008) in soil cores that are one of the important hydrological structures. Thus, the CT method described in the present study is applicable to diverse hydrological studies on soil cores.
The current state-of-the-art of the micro-focus CT technique has advanced to a level so as to be able to clearly image the micrometer-scale pore structure of the soils as shown in Fig. 7. The obtained 3-D micro-focus CT image is sufficiently accurate to reproduce the measured formation factor value via computer simulations (Fig. 8). Thus, even though it is a destructive method, the use of micro-focus CT yields useful hydrological information to supplement the low-resolution medical CT data.
NMR
The most important result with respect to the NMR method examined is Fig. 11, clearly showing that oil-contaminated core portions can be detected as data points located out of the main sequence of the clean sand. This is based on the fact that the T2 of viscous heavy oil molecules is significantly smaller than that of less viscous water molecules. Because the physics is simple and robust, the method using the M 0–T2 plane proposed in the present study is applicable to cores from various sites contaminated with heavy oils. The detection of the oil contamination using the M 0–T2 plane is probably also applicable to the data analysis obtained by the surface nuclear magnetic resonance geophysical exploration (e.g., Fomenko et al. 2008). The acquisition time for each core portion was as short as 256 s. Thus, the CPMG–NMR technique is useful for the quick non-destructive evaluation of contaminated cores without touching harmful chemical species. For example, the method can be used to quickly choose a limited number of heavily contaminated core portions for more extensive analysis by other time-consuming destructive methods such as high-field NMR spectroscopy (e.g., Litvina et al. 2003; Santín et al. 2008).
During the non-destructive core measurement by NMR, the quantitative calibration data of M 0 (Fig. 10b) are not available yet. They are given by the subsequent destructive core analysis (e.g., GC–FID). However, the hydrogen number per oil molecule detectable by low-field NMR and the specific gravity of the bulk oil do not vary so considerably between oil species (e.g., Dunn et al. 2002). Thus, it is possible to draw an order-of-magnitude calibration line before the destructive chemical analysis of the oil species in the core.
The following points should be noted for oil detection using the M 0–T2 plane. First, the position of the main sequence is dependent on pore size and soil mineralogy (e.g., Nagashima 2006; Keating and Knight 2007). The quantity T2 for water-saturated porous media increases with increasing pore size and decreasing iron concentration of solid grains. For example, for fine-grained sandy sediments having smaller T2 compared with the medium to coarse sands (Fig. 3) of the site investigated, the main sequence would shift in the direction of the smaller T2 value in the M 0–T2 plane. Thus, accurate determination of the position of the main sequence site by site using several clean core portions is desirable.
Another point to be noted is that the position of data points for the oil-contaminated core portions could also shift in the M 0–T2 plane depending on the oil properties. This is due to the fact that T2 decreases with increasing viscosity of the oil molecules (e.g., Dunn et al. 2002). If the oil is more viscous, the data points for the oil-contaminated core portions in Fig. 11 would shift further away from the main sequence, rendering the discrimination of clean portions and oil-contaminated portions easier. On the other hand, if the oil is less viscous, the data points for the oil-contaminated core portions would shift in the direction of the larger T2 value in the M 0–T2 plane and become mixed with those for clean core portions. This implies that it could be difficult to distinguish clean cores from oil-contaminated cores for less viscous oils. Other methods, such as two-dimensional NMR (Freedman and Heaton 2004), could be a possible solution for the detection of less viscous oils in soil cores, even though it is more time consuming compared to the method using the M 0–T2 plane.
The major advantage of a low-field NMR system with a permanent magnet over a high-field NMR system with a superconducting magnet is that the former is compact and portable (Kose et al. 2004). The magnetic circuit in Fig. 1b is as light as ∼50 kg and can easily be transported to the contamination site by an automobile. Thus, although our NMR experiments were performed in a laboratory far from the contamination site, it is possible to carry out the same NMR measurements on-site. Such on-site NMR measurements would significantly accelerate the speed of non-destructive analysis of cores.
Conclusions
Two non-destructive measurement methods, medical X-ray CT and time-domain low-field NMR relaxometry, were applied to long soil core samples from a real oil-contaminated site, without the necessity of touching any harmful chemical species that may be present. The X-ray CT method successfully detected the transition from a partially water-saturated zone to a fully saturated zone with increasing depth, in terms of an increase in the CT number with depth. This detection is based on simple robust physics that the CT number increases with increasing bulk density of the fluid-containing porous soil sample. The time-domain NMR method successfully detected oil-contaminated core portions in terms of the relatively small T2 values compared with portions filled with clean water. This is based on simple and robust physics that the T2 of viscous heavy oil molecules is smaller than that of the less viscous water molecules. The two non-destructive methods are based on robust fundamental principles and are applicable to soil cores from various sites. The two methods provide information about the hydrological properties (change of the water volume fraction with depth) and contaminated core portions, which is useful to formulate an adequate plan for subsequent destructive laboratory measurements.
Acknowledgements
Comments by anonymous reviewers were very helpful. This study was financially supported by the Ministry of the Environment, Government of Japan.
Open Access
This article is distributed under the terms of the Creative Commons Attribution Noncommercial License which permits any noncommercial use, distribution, and reproduction in any medium, provided the original author(s) and source are credited.
References
- Anderson SH, Gantzer CJ, Boone JM, Tully RJ. Rapid non-destructive bulk density and soil–water content determination by computed tomography. Soil Science Society of America Journal. 1988;52:35–40. doi: 10.2136/sssaj1988.03615995005200010006x. [DOI] [Google Scholar]
- Anferova S, Anferov V, Rata DG, Blümich B, Arnold J, Clauser C, Blümler P, Raich H. A mobile NMR device for measurements of porosity and pore size distributions of drilled core samples. Concepts in Magnetic Resonance Part B Magnetic Resonance Engineering. 2004;23B:26–32. doi: 10.1002/cmr.b.20020. [DOI] [Google Scholar]
- Arns CH, Knackstedt MA, Pinczewski WV, Lindquist WB. Accurate estimation of transport properties from microtomographic images. Geophysical Research Letters. 2001;28:3361–3364. doi: 10.1029/2001GL012987. [DOI] [Google Scholar]
- Bryar TR, Knight RJ. NMR relaxation measurements to quantify immiscible organic contaminants in sediments. Water Resources Research. 2008;44:article number W02401. doi: 10.1029/2006WR005635. [DOI] [Google Scholar]
- Chen XM, Vanclooster M, Pan GX. Impact of soil water flux on vadose zone solute transport parameters. Communications in Soil Science and Plant Analysis. 2002;33:479–492. doi: 10.1081/CSS-120002758. [DOI] [Google Scholar]
- Coates GR, Xiao L, Prammer MG. NMR logging principles and applications. Houston: Gulf Professional; 2001. [Google Scholar]
- Crestana S, Mascarenhas S, Pozzi-Mucelli RS. Static and dynamic three-dimensional studies of water in soil using computed tomographic scanning. Soil Science. 1985;140:326–332. doi: 10.1097/00010694-198511000-00002. [DOI] [Google Scholar]
- Daughney CJ, Bryar TR, Knight RJ. Detecting sorbed hydrocarbons in a porous medium using proton nuclear magnetic resonance. Environmental Science & Technology. 2000;34:332–337. doi: 10.1021/es990637m. [DOI] [Google Scholar]
- Dunn K-J, Bergman DJ, LaTorraca GA. Nuclear magnetic resonance petrophysical and logging applications. New York: Pergamon; 2002. [Google Scholar]
- Fohrer N, Berkenhagen J, Hecker JM, Rudolph A. Changing soil and surface conditions during rainfall: single rainstorm/subsequent rainstorms. Catena. 1999;37:355–375. doi: 10.1016/S0341-8162(99)00026-0. [DOI] [Google Scholar]
- Fomenko VM, Shushakov OA, Kuskovskii VS. Detection of groundwater contamination with hydrocarbons. Russian Geology and Geophysics. 2008;49:183–186. doi: 10.1016/j.rgg.2008.02.003. [DOI] [Google Scholar]
- Freedman R, Heaton N. Fluid characterization using nuclear magnetic resonance logging. Petrophysics. 2004;45:241–250. [Google Scholar]
- Goldstein L, Prasher SO, Ghoshal S. Three-dimensional visualization and quantification of non-aqueous phase liquid volumes in natural porous media using a medical X-ray computed tomography scanner. Journal of Contaminant Hydrology. 2007;93:96–110. doi: 10.1016/j.jconhyd.2007.01.013. [DOI] [PubMed] [Google Scholar]
- Hedberg SA, Knight RJ, MacKay AL, Whittall KP. The use of nuclear magnetic resonance for studying and detecting hydrocarbon contaminants in porous rocks. Water Resources Research. 1993;29:1163–1170. doi: 10.1029/92WR02540. [DOI] [Google Scholar]
- Hertzog RC, White TA, Straley C. Using NMR decay-time measurements to monitor and characterize DNAPL and moisture in subsurface porous media. Journal of Environmental and Engineering Geophysics. 2007;12:293–306. doi: 10.2113/JEEG12.4.293. [DOI] [Google Scholar]
- Jassogne L, McNeill A, Chittleborough D. 3D-visualization and analysis of macro- and meso-porosity of the upper horizons of a sodic, texture-contrast soil. European Journal of Soil Science. 2007;58:589–598. doi: 10.1111/j.1365-2389.2006.00849.x. [DOI] [Google Scholar]
- Jin S, Nagao J, Takeya S, Jin Y, Hayashi J, Kamata Y, Ebinuma T, Narita H. Structural investigation of methane hydrate sediments by microfocus X-ray computed tomography technique under high-pressure conditions. Japanese Journal of Applied Physics. 2006;45:L714–L716. doi: 10.1143/JJAP.45.L714. [DOI] [Google Scholar]
- Jinguuji M, Uchida T. Detection and site characterization of oil contamination using 3D geophysical exploration and direct push method. Geotechnical Engineering Magazine. 2009;57:28–31. [Google Scholar]
- Jinguuji, M., Yokota, T., Mitsuhata, Y., & Uchida, T. (2008). Characterization of oil-contaminated site using high density 3D resistivity exploration and direct push technique. Proceedings of the 119th Society of Exploration Geophysics of Japan conference, pp. 149−152 (in Japanese).
- Keating K, Knight R. A laboratory study to determine the effect of iron oxides on proton NMR measurement. Geophysics. 2007;72:E27–E32. doi: 10.1190/1.2399445. [DOI] [Google Scholar]
- Ketcham RA, Carlson WD. Acquisition, optimization and interpretation of X-ray computed tomographic imagery: applications to the geosciences. Computers & Geosciences. 2001;27:381–400. doi: 10.1016/S0098-3004(00)00116-3. [DOI] [Google Scholar]
- Kose K, Matsuda Y, Kurimoto T, Hashimoto S, Yamazaki Y, Haishi T, Utsuzawa S, Yoshioka H, Okada S, Aoki M, Tsuzaki T. Development of a compact MRI system for trabecular bone volume fraction measurements. Magnetic Resonance in Medicine. 2004;52:440–444. doi: 10.1002/mrm.20135. [DOI] [PubMed] [Google Scholar]
- Lieberman SH. Direct-push, fluorescence-based sensor systems for in situ measurement of petroleum hydrocarbons in soils. Field Analytical Chemistry and Technology. 1998;2:63–73. doi: 10.1002/(SICI)1520-6521(1998)2:2<63::AID-FACT2>3.0.CO;2-F. [DOI] [Google Scholar]
- Litvina M, Todoruk TR, Langford CH. Composition and structure of agents responsible for development of water repellency in soils following oil contamination. Environmental Science & Technology. 2003;37:2883–2888. doi: 10.1021/es026296l. [DOI] [PubMed] [Google Scholar]
- Luo LF, Lin H, Halleck P. Quantifying soil structure and preferential flow in intact soil using X-ray computed tomography. Soil Science Society of America Journal. 2008;72:1058–1069. doi: 10.2136/sssaj2007.0179. [DOI] [Google Scholar]
- Macedo A, Crestana S, Vaz CMP. X-ray microtomography to investigate thin layers of soil clod. Soil and Tillage Research. 1998;49:249–253. doi: 10.1016/S0167-1987(98)00180-9. [DOI] [Google Scholar]
- Mitsuhata, Y., Ando, M., Ueda, T., Imasato, T., Takagi, K., & Sato, H. (2009). Applications of EM mapping geophysical technique to oil contaminated ground investigations. Proceedings of the 15th conference on the measures to prevent soil and groundwater contaminations (CD-ROM).
- Mooney SJ, Morris C. A morphological approach to understanding preferential flow using image analysis with dye tracers and X-ray computed tomography. Catena. 2008;73:204–211. doi: 10.1016/j.catena.2007.09.003. [DOI] [Google Scholar]
- Nagashima K. Influence of magnetic impurities on proton spin relaxation of water in clay. Applied Magnetic Resonance. 2006;30:55–73. doi: 10.1007/BF03166982. [DOI] [Google Scholar]
- Nakashima Y. The use of X-ray CT to measure diffusion coefficients of heavy ions in water-saturated porous media. Engineering Geology. 2000;56:11–17. doi: 10.1016/S0013-7952(99)00130-1. [DOI] [Google Scholar]
- Nakashima Y. Diffusivity measurement of heavy ions in Wyoming montmorillonite gels by X-ray computed tomography. Journal of Contaminant Hydrology. 2003;61:147–156. doi: 10.1016/S0169-7722(02)00138-9. [DOI] [PubMed] [Google Scholar]
- Nakashima Y, Nakano T. Rampo: random walk simulation for porous rocks. Chishitsu News. 2008;655:39–46. [Google Scholar]
- Nakashima Y, Kamiya S, Nakano T. Diffusion ellipsoids of anisotropic porous rocks calculated by X-ray computed tomography-based random walk simulations. Water Resources Research. 2008;44:article number W12435. doi: 10.1029/2008WR006853. [DOI] [Google Scholar]
- Nakashima Y, Nakano T, Nakamura K, Uesugi K, Tsuchiyama A, Ikeda S. Three-dimensional diffusion of non-sorbing species in porous sandstone: computer simulation based on X-ray microtomography using synchrotron radiation. Journal of Contaminant Hydrology. 2004;74:253–264. doi: 10.1016/j.jconhyd.2004.03.002. [DOI] [PubMed] [Google Scholar]
- Peth S. Applications of microtomography in soils and sediments. Developments in Soil Science. 2010;34:73–101. doi: 10.1016/S0166-2481(10)34003-7. [DOI] [Google Scholar]
- Petrovic AM, Siebert JE, Rieke PE. Soil bulk density analysis in three dimensions by computed tomographic scanning. Soil Science Society of America Journal. 1982;46:445–450. doi: 10.2136/sssaj1982.03615995004600030001x. [DOI] [Google Scholar]
- Peyton RL, Haeffner BA, Anderson SH, Gantzer CJ. Applying X-ray CT to measure macropore diameters in undisturbed soil cores. Geoderma. 1992;53:329–340. doi: 10.1016/0016-7061(92)90062-C. [DOI] [Google Scholar]
- Santín C, Knicker H, Fernández S, Menéndez-Duarte R, Álvarez MÁ. Wildfires influence on soil organic matter in an Atlantic mountainous region (NW of Spain) Catena. 2008;74:286–295. doi: 10.1016/j.catena.2008.01.001. [DOI] [Google Scholar]
- Sato, H., Tanaka, M., Mitsuhata, Y., Nakashima, Y., Jinguuji, M., & Nishiwaki, J. (2009). Measuring fuel contamination using direct push techniques with fuel fluorescence detector (FFD). Proceedings of the 15th conference on the measures to prevent soil and groundwater contaminations (CD-ROM).
- Seignez, N., Gauthier, A., Mess, F., Brunel, C., Dubois, M., & Potdevin, J. L. (2010). Development of plant roots network in polluted soils: an X-ray computed microtomography investigation. Water, Air, & Soil Pollution, 209, 199–207.
- Taina IA, Heck RJ, Elliot TR. Application of X-ray computed tomography to soil science: a literature review. Canadian Journal of Soil Science. 2008;88:1–20. [Google Scholar]
- Tollner EW, Verma BP. X-ray CT for quantifying water content at points within a soil body. Transactions of the ASAE. 1989;32:901–905. [Google Scholar]
- Topp GC, Davis JL. Measurement of soil–water content using time-domain reflectometry (TDR)—a field-evaluation. Soil Science Society of America Journal. 1985;49:19–24. doi: 10.2136/sssaj1985.03615995004900010003x. [DOI] [Google Scholar]
- Tsuchiyama A, Uesugi K, Nakano T, Ikeda S. Quantitative evaluation of attenuation contrast of X-ray computed tomography images using monochromatized beams. American Mineralogist. 2005;90:132–142. doi: 10.2138/am.2005.1552. [DOI] [Google Scholar]
- van den Berg EH, Perfect E, Tu C, Knappett PSK, Leao TP, Donat RW. Unsaturated hydraulic conductivity measurements with centrifuges: a review. Vadose Zone Journal. 2009;8:531–547. doi: 10.2136/vzj2008.0119. [DOI] [Google Scholar]
- van der Zwaag CH, Stallmach F, Skjetne T, Veliyulin E. NMR response of non-reservoir fluids in sandstone and chalk. Magnetic Resonance Imaging. 2001;19:543–545. doi: 10.1016/S0730-725X(01)00289-2. [DOI] [PubMed] [Google Scholar]
- Yokota, T., Jinguuji, M., Nakashima, Y., Mitsuhata, Y., Uchida, T., & Komai, T. (2008). A 3D GPR application to a vacant lot where used to be oil related facilities. Proceedings of the 119th Society of Exploration Geophysics of Japan conference, pp. 153−156 (in Japanese).


