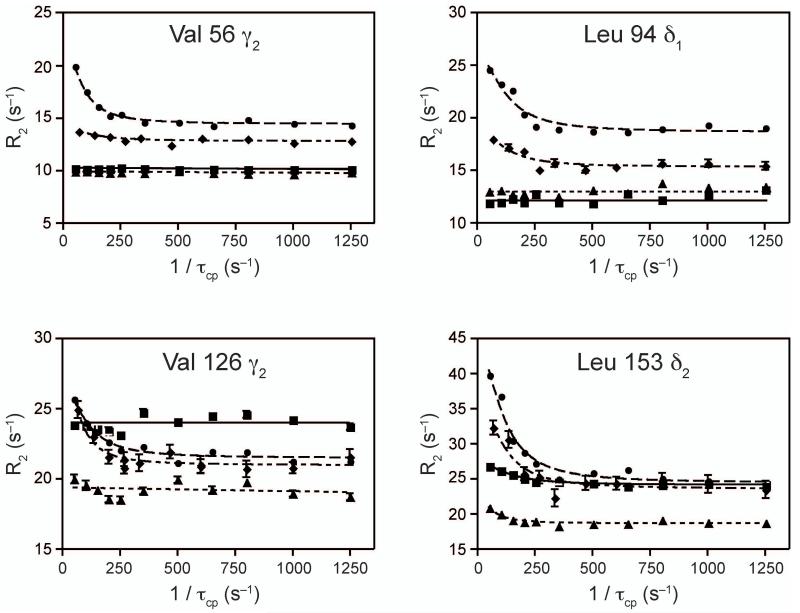
Figure 6. Comparison of dispersion profiles for the apo, acivicin bound, PRFAR bound and ternary states of ILV 13CH3 methyl labeled HisF.
Dispersion overlays highlighting differences in dispersion amplitudes for the four states. Apo data are shown as squares, acivicin bound data are as triangles, PRFAR bound (circles) and ternary complex data as diamonds.

