

Abstract
Hepatocyte nuclear factor 4α (HNF4α) is a nuclear transcription factor mainly expressed in the liver, intestine, kidney, and pancreas. Many of its hepatic and pancreatic functions have been described, but limited information is available on its role in the gastrointestinal tract. The objectives of this study were to evaluate the anti-inflammatory and antioxidant functions of HNF4α as well as its implication in intestinal lipid transport and metabolism. To this end, the HNF4A gene was knocked down by transfecting Caco-2 cells with a pGFP-V-RS lentiviral vector containing an shRNA against HNF4α. Inactivation of HNF4α in Caco-2 cells resulted in the following: (a) an increase in oxidative stress as demonstrated by the levels of malondialdehyde and conjugated dienes; (b) a reduction in secondary endogenous antioxidants (catalase, glutathione peroxidase, and heme oxygenase-1); (c) a lower protein expression of nuclear factor erythroid 2-related factor that controls the antioxidant response elements-regulated antioxidant enzymes; (d) an accentuation of cellular inflammatory activation as shown by levels of nuclear factor-κB, interleukin-6, interleukin-8, and leukotriene B4; (e) a decrease in the output of high density lipoproteins and of their anti-inflammatory and anti-oxidative components apolipoproteins (apo) A-I and A-IV; (f) a diminution in cellular lipid transport revealed by a lower cellular secretion of chylomicrons and their apoB-48 moiety; and (g) alterations in the transcription factors sterol regulatory element-binding protein 2, peroxisome proliferator-activated receptor α, and liver X receptor α and β. In conclusion, HNF4α appears to play a key role in intestinal lipid metabolism as well as intestinal anti-oxidative and anti-inflammatory defense mechanisms.
Keywords: Antioxidant, Apolipoproteins, Inflammation, Lipoprotein Metabolism, Oxidative Stress, Transcription Factors
Introduction
The hepatocyte nuclear factor 4α (HNF4α, NR2A1) belongs to the nuclear hormone receptor superfamily (1). It is expressed in the liver, kidney, pancreatic islets, and gut (1–3) and regulates the expression of various genes involved in the synthesis/metabolism of fatty acid (FA),2 cholesterol, glucose, and urea (4). Transcriptional activation by HNF4α is mediated by its binding as a homodimer to direct repeat-1 promoter sequences of target genes (5). Genes transactivated by HNF4α encode various transcription factors, enzymes, and proteins involved in numerous processes, including hematopoiesis, blood coagulation/fibrinolysis, together with liver development and function (5–9). Conversely, molecular defects in HNF4α expression may provoke major disorders as noted in late-onset type 2 diabetes (10, 11) as well as in maturity-onset diabetes of the young 1, a disorder characterized by autosomal dominant inheritance and impaired glucose-stimulated insulin secretion from pancreatic β-cells (12, 13).
HNF4α has been essentially studied in liver and hepatocyte cell lines. In fact, HNF4α has been shown to be necessary for hepatoblast differentiation into hepatocytes (14), epithelial morphology (15), gene-encoding proteins of cell junctions (16), and liver architecture, including the organization of the sinusoidal endothelium (15). Surprisingly, limited work has been devoted to the gut even though HNF4α is at the crossroads between intestinal morphogenesis and function. As reported previously, HNF4α plays a role in colon development (17), intestinal epithelial cell differentiation, and phenotype expression (18, 19). Interestingly, not only did HNF4α regulate the expression of many genes such as apolipoproteins (apo) (20–25), but it also has been found associated with susceptibility to abnormal intestinal permeability and inflammation (26). These findings indicate that HNF4α is critical for intestinal tissue development and the maintenance of a number of metabolic pathways.
To gain more insight into the physiological and biological significance of HNF4α in the intestine, molecular strategies were devised in the Caco-2 cell line, a reliable human intestinal model, to thoroughly examine the specific role of HNF4α in oxidative stress, inflammation, lipid transport and metabolism, apobiogenesis, and lipoprotein assembly.
EXPERIMENTAL PROCEDURES
Cell Culture
Caco-2 cells (American Type Culture Collection, Manassas, VA) were grown at 37 °C in minimum essential medium (Invitrogen) containing 1% penicillin/streptomycin and 1% minimum essential medium nonessential amino acids (Invitrogen) supplemented with 10% decomplemented fetal bovine serum (Flow, McLean, VA). Caco-2 cells (passages 30–40) were maintained with 5% CO2 in T-75-cm2 flasks (Corning Glass). Cultures were split (1:6) when they reached 70–90% confluence using 0.05% trypsin, 0.5 mm EDTA (Invitrogen). For individual experiments, cells were plated at a density of 1 × 10⁶ cells/well on 24.5-mm polycarbonate Transwell filter inserts with 0.4-μm pores (Costar, Cambridge, MA) in minimum essential medium (as above) supplemented with 5% fetal bovine serum. The inserts were placed into 6-well culture plates, permitting separate access to the upper and lower compartments of the monolayers.
Generation of a Stable shRNA Expressing Caco-2 Cell Line
Exponentially growing 293FT cells were transiently infected with pGFP-V-RS vectors (OriGene Technologies, Inc., Rockville, MD), allowing stable delivery of the shRNA expression cassette against HNF4α into host cells via a replication-deficient lentivirus. Upon transient transfection of the plasmids into the packaging cell line, replication-deficient viruses were obtained and used to infect target Caco-2 cells. Forty eight hours post-infection, cells were transferred to flasks and grown in Dulbecco's modified Eagle's medium containing 1 μg/ml puromycin (Sigma) for 7 days to establish stable shRNA-expressing Caco-2 cells. Thereafter, cells were cultivated until 10 days post-confluence and used only following the validation of suppression of the gene of interest by RT-PCR and Western blot assays. The medium was refreshed every 2nd day.
Estimation of Lipid Peroxidation
Conjugated Dienes
The levels of conjugated dienes were analyzed by extraction of cells with heptane/isopropyl alcohol (2:1) and measured spectrophotometrically in heptane layer (27).
Malondialdehyde (MDA)
The amount of MDA was determined by HPLC as described previously (28). Briefly, proteins were first precipitated with a 10% sodium tungstate (Na2WO4) (Aldrich) solution, and protein-free supernatant was then reacted with an isovolume of 0.5% thiobarbituric acid (Sigma) solution at 90 °C for 60 min. After cooling to room temperature, the chromogene ((thiobarbituric acid)2-MDA) was extracted with 1-butanol and dried over a stream of nitrogen at 37 °C. The dry extract was then resuspended in KH2PO4/methanol (70:30, pH 7.0) mobile phase before MDA detection by HPLC.
Iron-Ascorbate Exposure
To determine infected and untreated cell response to oxidative stress, they were exposed to iron (0.2 mm)-ascorbate (2 mm) (1:10) system-mediated lipid peroxidation (29, 30). At the end of a 6-h culture period, the degree of lipid peroxidation was evaluated by measuring MDA in cells.
Endogene Antioxidant Activity
The activities of the antioxidant enzymes catalase (CAT) and glutathione peroxidase (GPx) were measured in cell homogenates, and the activity of SOD1 (Cu,Zn-SOD), the major superoxide dismutase isoform, was estimated in the cytosol prepared by centrifuging the cell lysate at 10,000 × g for 10 min at 4 °C (StressGen). For CAT and GPx, a substrate specific for each enzyme was added to the cell homogenates, and rates of disappearance of the substrate were measured by spectrophotometry. The method for enzyme quantification was adapted from the protocol reported by Pippenger et al. (31). For CAT activity, aliquots of cell homogenates were mixed with 10 mm hydrogen peroxide (H2O2) as a substrate, and absorbance was read at 240 nm for 3 min. For seleno-dependent GPx activity, cell homogenates were mixed with a phosphate-buffered saline (PBS)-based working solution, pH 7.0, containing 1 mm glutathione (Sigma), 0.6 units of glutathione reductase (Sigma), and 100 mm β-nicotinamide adenine dinucleotide 2′-phosphate-reduced tetrasodium salt (Sigma) with a small quantity of tert-butyl hydroperoxide (Sigma) (1.5%) to initiate the reaction. To obtain nonseleno-dependent GPx activity, the reaction was initiated with 0.5 mm cumene hydroperoxide (Sigma). Heme oxygenase-1 (HO-1) activity assay was performed as described previously by Kutty and Maines (32). After incubation, cells were washed with PBS, scraped from the dishes, and centrifuged (13,000 × g, 5 min, 4 °C). The cell pellet was resuspended with PBS, subjected to three cycles of freeze-thawing, and sonicated on ice before centrifugation at 13,000 × g for 15 min at 4 °C. An aliquot of 1 mg of protein was added to a reaction mixture containing nicotinamide adenine dinucleotide phosphate, glucose-6-phosphate dehydrogenase, rat liver cytosol as a source of biliverdin reductase, and the substrate hemin. The mixture was incubated in the dark at 37 °C for 1 h, and the reaction was stopped by the addition of 1 ml of chloroform. After vigorous vortexing and centrifugation, the extracted bilirubin in the chloroform layer was measured by the difference in absorbance between 464 and 530 nm (ϵ = 40 mm−1 cm−1).
Western Blot for Protein Analysis
To determine the protein expression of HNF4α, nuclear factor erythroid-2-related factor 2 (Nrf2, NFE2L2), nuclear factor-κB (NF-κB), IκB, SOD1, and divalent metal transporter 1 (DMT-1), cells were homogenized, and proteins (30 μg) were denatured at 95 °C for 5 min in SDS/dithiothreitol- and β-mercaptoethanol-containing sample buffer, separated on a 4–7.5% gradient SDS-PAGE, and electroblotted onto Hybond-C Extra nitrocellulose membranes (Amersham Biosciences) in 25 mm Tris and 192 mm glycine. Membranes were blocked in Tris-buffered saline (20 mm Tris-HCl, pH 7.5, plus 137 mm NaCl) containing 0.1% Tween 20 and 5% nonfat dry milk for 60 min at room temperature. The blots were then incubated overnight at 4 °C in blocking solution with the antibodies for HNF4α (1:1000) (Santa Cruz Biotechnology), Nrf2 (1:1000) (Santa Cruz Biotechnology), IκB (1:1000) (Sigma), NF-κB (1:2000) (Sigma), SOD1 (1:1500) (Santa Cruz Biotechnology), DMT-1 (1:500) (Sigma), and β-actin (1:5000) (Sigma). The relative amount of primary antibody was detected with species-specific horseradish peroxidase-conjugated secondary antibodies. Blots were developed, and the protein mass was quantified using an HP® Scanjet scanner equipped with a transparency adapter and the UN-SCAN-IT gel 6.1 software.
Quantitative RT-PCR Expression Analysis
Total RNA was extracted from Caco-2 cells using TRIzol reagent (Invitrogen) according to the manufacturer's specifications, repurified, checked for integrity by agarose gel electrophoresis, and reverse-transcribed into cDNA using the Superscript first strand synthesis system (Invitrogen). The cDNA was used as template for RT-PCR analysis. Quantitative RT-PCRs were performed using Quantitect SYBR Green kit (Applied Biosystems, Foster City, CA) in an ABI Prism 7000 sequence detection system. The RT-PCRs were carried in 96-well plates with a final volume of 25 μl per well; 12.5 μl of SYBR Green mix (2×) were added to a well containing 25 pmol of the forward and reverse primers and 0.5 μg of cDNA template in a total of 12.5 μl of diethyl pyrocarbonate/H2O. Subsequently, negative controls without cDNA were prepared. The reaction of amplification was carried out using 40 cycles. To normalize the different cDNA sample amounts, the housekeeping gene glyceraldehyde-3-phosphate dehydrogenase (GAPDH) was employed as a reference gene. The analyses were performed in triplicate for each gene and for GAPDH in the same plate. The relative mRNA fold changes between groups were calculated using the 2−ΔΔCt method (33).
Semi-quantitative RT-PCR
In an attempt to study HNF4α isoform expression in Caco-2 cells, we performed semi-quantitative RT-PCR as described by Eeckhoute et al. (34). Briefly, total RNA was isolated and reverse-transcripted into cDNA. The PCR amplification was performed in a 50-μl volume using 5 μl of PCR Buffer (10×), 1.5 μl of MgCl2 Solution, 2 μl of dNTPs (2.5 mm), 0.2 μm of each corresponding primer, and 2.5 units of TAQTM platinum polymerase (Qiagen). The PCR amplifications were carried out using a GeneAmp PCR System 9700 (Applied Biosystems) under the following profile: 28–35 cycles of amplification were used at 95 °C for 30 s, 60 °C for 30 s, and 72 °C for 45 s. Amplicons were visualized on an ethidium bromide-stained 2.5% Metaphor®-agarose (Lonza) gel. We analyzed the expression of P1-driven isoforms (containing exon 1A) and P2-driven isoforms (containing exon 1D). Moreover, we discriminated between the α1 and α7 isoforms versus the α2 and α8 isoforms by distinguishing the 30-bp insertion in exon 9. The experiments were performed in Caco-2 cells and HepG2 cells with GAPDH as a housekeeping gene.
Pro-inflammatory Biomarkers
Interleukin (IL)-6, IL-8 (RayBiotech, Inc., Norcross GA), and LTB4 (Invitrogen) in the basolateral medium were measured by ELISA kit according to the manufacturer's protocol.
Measurement of Lipid Synthesis and Secretion
Caco-2 cell lipid synthesis and secretion were assayed as we described previously (35, 36). Briefly, radiolabeled [14C]oleic acid (specific activity of 53.9 mCi/mmol, 2.04 GBq/mmol, Amersham Biosciences) was added to unlabeled oleic acid and then solubilized in FA-free bovine serum albumin (BSA) (BSA/oleic acid 1:5 (mol/mol)). The final oleic acid concentration was 0.7 mm (0.45 μCi)/well. Cells were first washed with PBS (Invitrogen), and the [14C]oleic acid-containing medium was added to the upper compartment. At the end of a 24-h incubation period, cells were washed and then scraped with a rubber policeman in a PBS solution containing antiproteases (phenylmethylsulfonyl fluoride, pepstatin, EDTA, aminocaproic acid, chloramphenicol, leupeptin, glutathione, benzamidine, dithiothreitol, sodium azide, and Trasylol, all at a final concentration of 1 mm). An aliquot was taken for lipid extraction by standard methods (37) in the presence of unlabeled carrier phospholipids (PL), monoglycerides, diglycerides, triglycerides (TG), free FA, free cholesterol, and cholesteryl ester (CE).
The various lipid classes synthesized from [14C]oleic acid were next separated by thin layer chromatography using the solvent mixture hexane/ether/acetic acid (80:20:3 (v/v)) as described previously (37, 38). The area corresponding to each lipid was scratched off of the thin layer chromatography plates, and the silica powder was placed in a scintillation vial with Ready Safe counting fluid (Beckman, Fullerton, CA). Radioactivity was measured by scintillation counting (Beckman LS 5000 TD, Ontario, Canada). Cell protein was quantified by the Bradford method, and results were expressed as dpm/mg cell protein. Lipids secreted in the basolateral compartment were analyzed and quantified, as above, after centrifugation (2,000 rpm, 30 min at 4 °C) to remove cell debris.
Lipid Carrier
Blood (20 ml) was collected by venipuncture 2–3 h after the ingestion of a high fat meal (50 g per 1.73 m2) from two healthy human volunteers. This procedure was approved by the Institutional Ethics Committee. After a 1000 × g centrifugation to pellet red blood cells, postprandial plasma was supplemented with 1 mm aprotinin and 0.1% sodium azide and was mixed with basolateral media to serve as a carrier for the isolation of labeled chylomicron (CM) as described previously (39).
Isolation of Lipoproteins
For the determination of secreted lipoproteins, Caco-2 cells were incubated with the lipid substrate as described previously. The medium supplemented with antiproteases (as mentioned above) was first mixed with a plasma lipid carried (4:1 (v/v)) to efficiently isolate de novo synthesized lipoproteins. The lipoproteins were then isolated by sequential ultracentrifugation using a TL-100 ultracentrifuge (Beckman Instruments, Montreal, Quebec, Canada) as described previously (39). Briefly, CMs were isolated following an ultracentrifugation (25,000 × g, 20 min). Very low density lipoprotein (VLDL), 1.006 g/ml, and low density lipoprotein (LDL), 1.063 g/ml, were separated at 100,000 × g for 2.26 h with a tabletop ultracentrifuge 100.4 rotor at 4 °C. The high density lipoprotein (HDL) fraction was obtained by adjusting the LDL infranatant to density at 1.21 g/ml and centrifuging for 6.5 h at 100,000 × g. Each lipoprotein fraction was exhaustively dialyzed against 0.15 m NaCl and 0.001 m EDTA, pH 7.0, at 4 °C for 24 h. Lipids from each lipoprotein were extracted with chloroform/methanol, and the free FA fraction was analyzed as described in detail above.
De Novo Apolipoprotein Synthesis
The synthesis and secretion of apolipoproteins (A-I, A-IV, B-48, B-100, and E) was assessed as described previously (40). To first induce apolipoprotein synthesis, cells were incubated apically with unlabeled oleic acid bound to albumin in serum-free medium for 24 h before [35S]methionine incubation. The concentration of the unlabeled lipid was equivalent to the labeled substrate described above. Thereafter, cells as well as the outer chambers were rinsed twice with PBS. The apical compartment was replaced with 1.5 ml of methionine-free medium containing the unlabeled substrate, 100 μCi/ml [35S]methionine (specific activity 1000 Ci/mmol, 37 TBq/mmol, Amersham Biosciences). After a 20-h incubation period at 37 °C with 5% CO2, the medium was collected from the basolateral compartment, and cells were scraped off the inserts in cell lysis buffer supplemented with the antiprotease mixture, as above. Aliquots were precipitated with 20% trichloroacetic acid. The precipitates were then washed three times with 5% trichloroacetic acid (TCA) before the radioactivity was determined in a Beckman liquid scintillation spectrometer.
Immunoprecipitation of Apolipoproteins
Immunoprecipitation was performed in the presence of excess polyclonal antibodies to human apolipoproteins (Roche Applied Science) at 4 °C overnight (41, 42). Samples were then washed with 0.05% Igepal CA-630 (Sigma) and subsequently centrifuged, resuspended in sample buffer (1.2% SDS, 12% glycerol, 60 mm Tris, pH 7.3, 1.2% β-mercaptoethanol, and 0.003% bromphenol blue), and analyzed by a linear 4–15% polyacrylamide gradient preceded by a 3% stacking gel, as described previously (41–43). Radioactive molecular weight standards (Amersham Biosciences) were run with the same conditions. Gels were sectioned into 2-mm slices and counted after an overnight incubation with 1 ml of BTS-450 (Beckman Instruments) and 10 ml of liquid scintillation fluid (Ready Organic, Beckman Instruments).
Microsomal Triglyceride Transfer Protein Enzymatic Activity Assay
The microsomal triglyceride transfer protein (MTP) activity assay was performed as described previously (44). The activity was determined by evaluating the transfer of radiolabeled triacylglycerol between two populations of unilamellar vesicles as described previously (45, 46). The donor and receiver vesicles were prepared by adding the appropriate amount of lipids to 500 μl of chloroform followed by drying under a stream of nitrogen, rehydration, and probe sonication in 1.25 ml of 15:35 buffer (15 mm Tris-HCl, pH 7.4, 35 mm NaCl, 0.05% BSA, 3 mm sodium azide, 1 mm EDTA). Donor vesicles contained, per assay, 4 nmol of egg yolk phosphatidylcholine, 0.33 nmol of cardiolipin, and 0.024 nmol of [3H]trioleylglycerol (Amersham Biosciences). Receptor vesicles contained 24 nmol of egg yolk phosphatidylcholine, 0.048 nmol of trioleylglycerol, and 4000 cpm of [14C]dipalmitoylphosphatidylcholine (Amersham Biosciences). Both categories of vesicles included 0.01% butylated hydroxytoluene. Various amounts of semi-purified MTP were incubated with 5 μl of donor and receptor vesicles in a final volume of 100 μl for 1 h at 37 °C. The reaction was quenched by adding 400 μl of ice-cold 15:35 buffer (without BSA). The negatively charged (because of the presence of cardiolipin) donor vesicles were removed from the reaction mixture by adsorption onto DEAE-cellulose (Whatman DE52). The supernatant (containing the receptor vesicles) was collected after a low speed centrifugation (13,000 × g) and recentrifuged (13,000 × g) to ensure a total removal of the DEAE-cellulose before scintillation counting. A blank assay containing donor and acceptor membranes without transferred protein was used to correct for the spontaneous transfer of labeling between vesicles. The ratio of [3H]glycerol trioleate on [14C]dipalmitoylphosphatidylcholine was determined, and the percentage of lipid transfer was calculated from the increase in this ratio. Lipid transfer activity was determined from the initial linear portions of the activity curves.
In Silico Analyses
To explore the potential interaction between HNF4α and the promoters of NFE2L2, HO-1, and CAT genes, we performed in silico analyses using the Genomatix MatInspector program (Genomatix Software GmbH, Munich, Germany) with a standard (0.75) core similarity. HNF4α recognition site sequences were identified in the 2,000-bp promoter regions of the genes.
Statistical Analysis
All values were expressed as the means ± S.D. Differences among groups were assessed using unpaired Student's t test with the level of significance set at 5% (p < 0.05).
RESULTS
Lentiviral Knockdown of HNF4α in Caco-2 Cells
To define the role of HNF4α in various intestinal processes, including oxidative stress, inflammation, and lipid metabolism, stable Caco-2 cells with HNF4α knockdown were established using shRNA constructs targeting HNF4α-encoding mRNA. HNF4α expression was measured in the selected clones, cultured on filters, 13 days after their differentiation, and compared with noncoding shRNA vector control cells. A significant reduction in gene expression (∼80%) was noted in HNF4α shRNA-infected cells compared with Mock cells infected with empty vector or with untreated cells as measured by quantitative RT-PCR (Fig. 1A). Furthermore, the inhibition of HNF4α protein expression by transduction with shRNA was confirmed by Western blot analysis when compared with Mock or untreated cells (Fig. 1B). Given the invariable results noted between untreated and infected cells with empty vector (Mock cells), only Mock cells were employed as control cells for the subsequent studies.
FIGURE 1.

HNF4α expression in Caco-2 cells infected with shRNAs. Following lentivirus infection, Caco-2 cells were allowed to proliferate until confluence and differentiate for 13 days before being tested for HNF4α gene (A) and protein (B) expression. Quantitative RT-PCR was performed using Quantitect SYBR Green kit and primer targeting gene sequences of HNF4α and GAPDH (housekeeping gene) after total RNA extraction from Caco-2 cells. Whole cell lysates were separated by SDS-PAGE, and the proteins were transferred to nitrocellulose membrane for Western blotting. Cells that were not infected with lentivirus served as basic controls and represent 100%, whereas Mock-infected cells served as negative controls versus pLKO.1-puro shHNF4α (shHNFα). Results represent the means ± S.D. of n = 5 independent experiments and are illustrated as % of untreated control cells after the data were calculated as densitometric ratios of HNF4α to GAPDH or HNF4α to β-actin. *, p < 0.001 versus control Mock cells.
HNF4α Knockdown and Caco-2 Cell Integrity
The effect of HNF4α expression manipulation on cell viability and monolayer integrity was examined. As assessed by trypan blue exclusion and the release of the cytosolic lactic dehydrogenase enzyme to the culture medium, cell viability was not affected (Table 1). Moreover, measurement of transepithelial resistance, alkaline phosphatase, and sucrase activity did not disclose any significant perturbation in mucosal barrier function and cell differentiation (Table 1). Therefore, it could be concluded that the RNA interference, acting as a post-transcriptional gene silencing mechanism, did not exert any cytotoxic effects on Caco-2 cells.
TABLE 1.
HNF4α knockdown and Caco-2 cell integrity
| Mock cells | shHNF4α | |
|---|---|---|
| Trypan blue exclusion | >96% | >95% |
| Lactase dehydrogenase | 6.9 ± 0.8 μmol/min/g protein | 6.1 ± 1.2 μmol/min/g protein |
| Transepithelial resistance | 2178 ± 239 Ω × cm2 | 2994 ± 281 Ω × cm2 |
| Alkaline phosphatase | 33.2 ± 2.8 μmol/min/g protein | 34.6 ± 3.6 μmol/min/g protein |
| Sucrase | 37.7 ± 4.1 μmol/min/g protein | 36.3 ± 4.8 μmol/min/g protein |
HNF4α Gene Silencing and Oxidative Stress
The extent of lipid peroxidation following HNF4α gene silencing in Caco-2 cells was assessed by determining cellular levels of conjugated dienes and MDA. Spectrofluorimetry analyses showed higher intracellular levels (273%, p < 0.02) of conjugated dienes in HNF4α shRNA-infected cells compared with Mock cells (Fig. 2A). Similarly, HPLC measurements indicate that Caco-2 knockdown cells for HNF4α exhibit an elevated MDA content (311%, p < 0.02) (Fig. 2B). Additionally, administration of iron ascorbate-induced oxidative stress consistently promoted a higher production of peroxidation compared with noncoding shRNA vector Mock cells (258%, p < 0.003) (Fig. 2C). These data highlight the protective role of HNF4α against lipid peroxidation in intestinal epithelial cells.
FIGURE 2.

Lipid peroxidation in HNF4α-depleted Caco-2 cells. Following 13 days of differentiation, Caco-2 cells were infected with empty vector plko.1 (as controls) or lentivirus carrying shRNA interference against HNF4α. Thereafter, they were homogenized and analyzed for conjugated dienes (CD) and MDA. The production of conjugated dienes (A) and MDA (B) was assessed spectrophotometrically and by HPLC, respectively, as described under “Experimental Procedures.” In addition, MDA was employed as an oxidative stress biomarker to evaluate lipid peroxidation in Caco-2 cells in response to HNF4α knockdown, challenged with 0.2 mm iron, 2 mm ascorbate (C). The data represent means ± S.D. for at least n = 3 independent experiments. *, p < 0.02; **, p < 0.003 versus Mock cells.
HNF4α Knockdown and Endogenous Antioxidant Enzymes
The enzymatic antioxidant pathway protects the cells against free radicals and reactive oxygen species excess to maintain an oxidative balance. Fig. 3 shows that the activity of the cytoplasmic SOD1 was significantly elevated in HNF4α shRNA-infected cells in comparison with Mock cells, although CAT, GPx, and HO-1 activities were reduced.
FIGURE 3.

Endogenous antioxidant content in HNF4α-depleted Caco-2 cells. The activity of SOD1, CAT, GPx, and HO-1 was determined to evaluate the antioxidant status of Caco-2 cells in response to HNF4α knockdown. The data represent means ± S.D. of n = 3 independent experiments. *, p < 0.05; **, p < 0.003; ***, p < 0.0001 versus Mock cells.
HNF4α Knockdown and Nrf2
Because Nrf2 plays a critical part in cellular basal activity and the coordinated induction of genes encoding numerous antioxidant enzymes, we determined its protein abundance. Nuclear quantification of Nrf2 revealed a lower protein expression in HNF4α shRNA-infected cells compared with Mock cells (51% reduction, p < 0.01) (Fig. 4A), which may explain the reduction of antioxidant response elements (ARE)-regulated antioxidant enzymes. When Caco-2 cells were treated with the classical Nrf2 activator Oltipraz, there was a trend to partially normalize the effects of HNF4α shRNA-infected cells because the chemical agent induces ARE-regulated enzymes (Fig. 4B) and restored the antioxidant defense as reflected by the reduction of SOD1 activity (31%, p < 0.001) and the augmentation of CAT, GPx, and HO-1 activities (36, 49, and 91%, respectively, p < 0.001) (Fig. 4C).
FIGURE 4.

Levels of Nrf2 transcription factor in Caco-2 cells with targeted disruption of HNF4α. Nuclear fractions, obtained from control Mock cells and HNF4α-depleted Caco-2 cells, were tested for Nrf2 protein expression by Western blots (A). Nuclear Nrf2 accumulation was assessed after the administration of the well established activator Oltipraz (OPZ) for 48 h in a dose-dependent manner with an optimal concentration of 50 μm (B). The activity of the antioxidant enzymes (SOD1, CAT, GPx, and HO-1) was measured in the presence of Oltipraz (C). Nuclear Nrf2 accumulation was evaluated following treatment with diethyl maleate (DEM) and MG132, which inhibit proteasome degradation activity and up-regulate translocation of Nrf2 to the nucleus (D), thereby stimulating ARE-driven endogenous SOD1 protein (E). The data represent means ± S.D. of n = 4 independent experiments. *, p < 0.05 versus control or untreated cells; **, p < 0.01 versus Mock cells or untreated cells; ***, p < 0.001 versus Mock cells or untreated cells.
As Nrf2 is kept inactive by complexing with its cytosolic inhibitor Kelch-like ECH-associated protein 1 (Keap1), thereby facilitating its degradation by a proteasome-mediated mechanism, we postulated that the addition of diethyl maleate (an Nrf2 protector) and MG132 (a proteasome inhibitor) would cause Nrf2 escape from Keap1 and would allow it to accumulate in the nucleus. Indeed, both chemical agents increased Nrf2 in the nucleus (263%, p < 0.001 and 152%, respectively) (Fig. 4D) and simultaneously enhanced the expression of target genes such as SOD1 (207%, p < 0.01 versus shHNF-DEM; 166%, p < 0.05 versus shHNF-MG132) (Fig. 4E) in HNF4α shRNA-infected cells.
HNF4α Knockdown and Inflammation Markers
The NF-κB signaling pathway plays a crucial role in the initiation, amplification, and resolution of inflammation by controlling the expression of multiple inflammatory mediators. In the cytosol, NF-κB is linked to its inhibitory molecule IκB. When IκB is degraded in response to various stimuli, NF-κB translocates to the nucleus where it activates the transcription of pro-inflammatory target genes. Fig. 5A shows that in HNF4α shRNA-infected cells, IκBα protein expression is reduced compared with Mock cells (42% reduction of the IκBα/β-actin ratio, p < 0.01), suggesting that the inhibitory protein is degraded in the proteasome, leaving NF-κB free to enter the nucleus and activate the transcription of its target genes. Confirmation was obtained with the noted rise of NF-κB in HNF4α shRNA-infected cells. Consequently, the IκBα/NF-κB protein ratio was lower in HNF4α shRNA-infected cells in comparison with Mock cells (58% reduction, p < 0.001) (Fig. 5A).
FIGURE 5.

Disruption of HNF4α activates NF-κB pathway and stimulates the production of inflammatory agents in Caco-2 cells. Cells were harvested, and the protein mass of NF-Bα and IκBα was quantitated by SDS-PAGE and Western blot, and the IκBα/NF-κB ratio was calculated (A). The concentration of IL-6, IL-8 and LTB4 was determined by commercial kits as described under “Experimental Procedures” (B). Values are means ± S.D. for n = 4 different experiments. *, p < 0.01; **, p < 0.001 versus Mock cells.
HNF4α Knockdown and Pro-inflammatory Protein Production
IL-6, IL-8, and LTB4 are pro-inflammatory components produced by the cells in response to injury. In Fig. 5B, ELISA measurements in the media of HNF4α shRNA-infected cells show a significant increase in the two cytokines IL-6 (143%, p < 0.01) and IL-8 (172%, p < 0.001) as well as in the eicosanoid LTB4 (155%, p < 0.001) in HNF4α shRNA-infected cells compared with Mock cells.
De Novo Lipid Synthesis
To elucidate the role of HNF4α in lipid esterification and delivery, HNF4α shRNA-infected and control Mock cells were cultured for 24 h with [14C]oleic acid. As illustrated in Fig. 6, lipid changes were recorded in cells and media. The total lipid, TG, PL, and CE cellular content was significantly reduced in HNF4α shRNA-infected cells compared with control Mock cells (Fig. 6A) (75%, p < 0.0001; 74%, p < 0.0001; 75%, p < 0.001, and 76%, p < 0.006 of control Mock cells, respectively). In the same manner, the amount of total labeled lipids secreted in the basolateral media was decreased in HNF4α shRNA-infected cells compared with Mock cells (74%, p < 0.0001) (Fig. 6B). This decrease was accounted for by a reduction in TGs (77%, p < 0.001), PLs (77%, p < 0.0001), and CE (77%, p < 0.006) secretion (Fig. 6B).
FIGURE 6.

Modifications of de novo lipid synthesis in HNF4α-depleted Caco-2 cells. Cells infected with empty vector plko.1 or lentivirus carrying short hairpin RNA interference against HNF4α were differentiated for 13 days and incubated with [14C]oleic acid for 24 h. Lipids of cell homogenates (A) and medium (B) were extracted with chloroform/methanol and isolated by TLC, and the radioactivity incorporated into each lipid fraction was determined. Results were analyzed as dpm/mg protein. Data represent means ± S.D. of n = 4 independent experiments. *, p < 0.006; **, p < 0.001; ***, p < 0.0001 versus Mock cells. TG, triglycerides.
Lipoprotein Secretion
To determine whether HNF4α interferes with enterocyte lipid transport functions, HNF4α shRNA-infected cells and control Mock cells were incubated with [14C]oleic acid for 20 h; media were collected, and lipoprotein fractions were separated by ultracentrifugation. Fig. 7A shows that the TG-rich lipoprotein (CM and VLDL) secretions were reduced in Caco-2 cell knockdown for HNF4α (74%, p < 0.05 and 76%, p < 0.01, respectively) compared with Mock cells. LDL are the main transporters of cholesterol in humans and are known for their pro-inflammatory and pro-atherogenic properties. Fig. 7B shows that LDL secretion was decreased (80%, p < 0.01) in HNF4α shRNA-infected cells compared with controls. HDL are lipoproteins with anti-inflammatory and anti-oxidative properties produced, among others, by epithelial intestinal cells. Fig. 7C shows that HNF4α shRNA-infected cells secrete HDL to a lesser degree than controls (39%, p < 0.01).
FIGURE 7.

Impact of HNF4α disruption on lipoprotein output in Caco-2 cells. Following 13 days of differentiation, Caco-2 cells were incubated with [14C]oleic acid for 24 h. Thereafter, chylomicrons and VLDL (A), LDL (B), and HDL (C) were isolated by ultracentrifugation according to their specific densities. Radioactivity incorporated into each fraction was further determined. Data were analyzed as dpm/mg of total protein and represent means ± S.D. of n = 3 independent experiments. *, p < 0.05; **, p < 0.01 versus Mock cells.
Apolipoprotein Secretion
To examine the effect of HNF4α on apo production, HNF4α shRNA-infected and Mock cells were cultured with [35S]methionine for 24 h, and the delivery of newly synthesized apolipoproteins in the medium was analyzed by NaDodSO4-PAGE following immunoprecipitation. Fig. 8 shows that HNF4α-deficient cells decreased secretion of apoB-100 (56% of control cells; p < 0.05) and apoB-48 (62% of control cells; p < 0.05), the main CM protein components, essential for its synthesis and secretion. Apolipoproteins (A-I, A-IV, and E) represent the main protein components of HDL and are considered to possess their own anti-inflammatory and anti-oxidative properties. The secretion of apoA-I and apoA-IV was reduced in HNF4α shRNA-infected cells (34 and 31% of controls, respectively, p < 0.002). The apoE secretion remained unchanged between infected and Mock cells (Fig. 8).
FIGURE 8.

HNF4α knockdown alters apolipoprotein biogenesis in Caco-2/15 cells. After 13 days of differentiation, Caco-2 cells were incubated with [35S]methionine for 24 h. Cell homogenates were incubated overnight with a mixture of antibodies against apolipoproteins (A-I, A-IV, E, B-48, and B-100) and protein A/G-agarose beads. The immune complexes were then thoroughly washed and analyzed on a 4–15% SDS-PAGE. After electrophoresis, gels were stained in Coomassie Blue, and bands corresponding to each apo were excised and counted for the radioactivity incorporated. Data were analyzed as dpm/mg of cellular protein and represent means ± S.D. of n = 3 independent experiments. *, p < 0.05; **, p < 0.002 versus Mock cells.
Microsomal Triglyceride Transfer Protein Enzymatic Activity
Lipoprotein formation is initiated by the translocation of apoB into the lumen of the endoplasmic reticulum, and MTP appears to be essential to this process to form stable nascent apoB-containing particles. Fig. 9 shows that HNF4α shRNA-infected cells displayed a decreased MTP enzymatic activity (75% of control cells, p < 0.05).
FIGURE 9.

Impact of HNF4α on MTP enzymatic activity. The MTP enzymatic activity was determined in Mock cells and in HNF4α shRNA-infected cells by evaluating the transfer of radiolabeled triacylglycerol between two populations of unilamellar vesicles as described under “Experimental Procedures.” Data are presented as percentage of lipid transfer/mg of cellular protein. Values are means ± S.D. for n = 4 independent experiments. *, p < 0.05 versus Mock cells.
Transcription Factors
Levels of specific mRNAs were quantitatively assessed by quantitative RT-PCR. HNF4α shRNA-infected cells resulted in decreased levels of the transcription factors SREBP-2, SREBP-1c, PPARα, LXRα, and LXRβ (76%, p < 0.05; 62%, p < 0.02; 74%, p < 0.05; 60%, p < 0.02; and 56%, p < 0.01, respectively) compared with Mock cells (Fig. 10).
FIGURE 10.

Impact of HNF4α on transcription factors. Levels of specific mRNAs were quantitatively assessed by RT-PCR as described under “Experimental Procedures.”. Data are presented as ratio of gene/GAPDH expression. Values are means ± S.D. for n = 3 independent experiments. *, p < 0.05; **, p < 0.02; ***, p < 0.01 versus Mock cells.
HNF4α Isoforms
We have performed semi-quantitative RT-PCR in an attempt to study the HNF4α isoforms expressed in Caco-2 cells. Fig. 11 shows that both P1- and P2-driven isoforms are expressed in Caco-2 cells. Moreover, according to our findings, α2 and α8 are the main isoforms in Caco-2 cells, whereas α1 and α7 have barely been detectable. In HepG2 cells, although both promoters are active, the P1-driven isoforms are expressed more abundantly. Both α1 and α7 are observed in HepG2 cells, but the α2 and α8 are the dominant isoforms.
FIGURE 11.
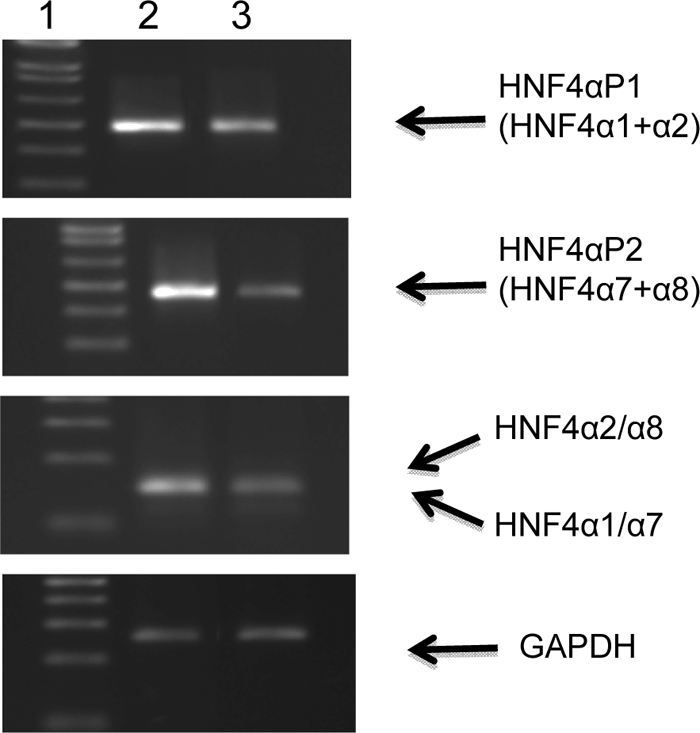
Expression of HNF4α transcripts in human Caco-2 and HepG2 cells. Semi-quantitative RT-PCRs were performed to determine HNF4α isoforms expressed in Caco-2 cells. RT-PCRs were used to analyze HNF4α transcripts containing exon 1D and exon 1A and to determine the relative amounts of isoforms α1 and/or α7 versus isoforms α2 and/or α8 transcripts, as well as the GAPDH housekeeping gene. Lane 1, molecular mass markers (in base pairs); lane 2, Caco-2 cells; lane 3, HepG2 cells.
Iron Transport and DMT-1 Expression
To test whether all the processes observed in response to HNF4α knockdown were specific, we have evaluated the impact of HNF4α knockdown on the uptake and output (to the basolateral medium) of iron, and we examined the expression of divalent DMT-1, the iron transport protein. No significant changes were noted in iron uptake and secretion (nmol/mg protein/h) between normal (3.25 ± 0.45 and 2.11 ± 0.25, respectively) and genetically modified (3.87 ± 0.62 and 2.37 ± 0.38, respectively) Caco-2 cells. Similarly, there were no significant differences in DMT-1 protein expression (expressed as DMT-1/β-actin ratio) between normal (1.00 ± 0.12%) and genetically modified (0.98 ± 0.16) Caco-2 cells. Therefore, one cannot argue that the knockdown of this gene generates globally abnormal cells that, although viable, are dysfunctional in almost all known functions.
Potential HNF4α Target Genes
To explore HNF4α target genes, we first examined the scientific literature pertaining to ChIP combined with promoter microarrays, and we then performed MatInspector Genomatix analyses. The literature examination revealed HNF4α capacity to bind to promoters of many genes involved in lipid metabolism, glutathione metabolism, oxidative stress, inflammatory processes, and transcription factor status (47–49). Because our study reveals potential HNF4α target genes that have not been previously identified in the literature (e.g. NFE2L2, HO-1, and CAT), we performed in silico analyses using the Genomatix MatInspector program. This revealed two potential HNF4α-binding sites in NFE2L2, four in HO-1, and three in CAT promoter regions (Table 2).
TABLE 2.
In silico analyses of potential HNF4α-binding sites in the promoter regions of NFE2L2, HO-1, and CAT
| Promoter | Matrix | Position | Anchor | Strand | Matrix Similarity |
|---|---|---|---|---|---|
| NFE2L2 | V$HNF4.03 | 1246–1270 | 1258 | − | 0.885 |
| V$HNF4.02 | 1308–1332 | 1320 | + | 0.781 | |
| HO-1 | V$HNF4.01 | 453–477 | 465 | − | 0.908 |
| V$HNF4.01 | 498–522 | 510 | − | 0.822 | |
| V$HNF4.01 | 928–952 | 940 | + | 0.870 | |
| V$HNF4.01 | 1117–1141 | 1129 | + | 0.830 | |
| CAT | V$HNF4.02 | 98–122 | 110 | − | 0.797 |
| V$HNF4A.01 | 481–505 | 493 | − | 0.968 | |
| V$HNF4.02 | 832–856 | 844 | + | 0.805 |
Comparison of Short and Long Term HNF4α Silencing
Because our experiments were performed 10 days post-confluence, it was important to determine whether the HNF4α effects could be recapitulated in short term siRNA knockdowns. Data obtained following experiments at 4-day post-confluence were not divergent from those at 10-day post-confluence (Table 3).
TABLE 3.
Comparison of HNF4α silencing effects at two different culture periods
Assessment of HNF4α influence on the various parameters was carried out after 4- and 10-day post-confluence. Data are expressed as percent of noncoding shRNA vector control cells. CD is conjugated dienes; IL-8 is interleukin-8; TG is triacylglycerol.
| Culture duration |
||
|---|---|---|
| 4 days | 10 days | |
| % controls | ||
| HNF4α knockdown | 87 | 83 |
| Oxidative stress | ||
| MDA | 301 | 272 |
| CD | 276 | 311 |
| Antioxidant status | ||
| CAT | 85 | 72 |
| GPx | 58 | 63 |
| Nrf2 | 57 | 49 |
| Inflammation | ||
| IL-8 | 152 | 172 |
| Lipoprotein assembly | ||
| TG | 74 | 81 |
| ApoB-48 | 53 | 62 |
| ApoA-I | 25 | 34 |
| MTP | 77 | 75 |
DISCUSSION
With the report on the vigorous participation of HNF4α in cell proliferation/differentiation, morphogenesis, function, and detoxification in the liver, interest in its role in the small intestine has considerably increased. To evaluate HNF4α input, we used knockdown gene expression in Caco-2 cells, a remarkable intestinal model for the investigation of oxidative stress and inflammation, which also displays important functional characteristics such as lipid transport, apo biogenesis, and lipoprotein metabolism. As is shown by our data, HNF4α gene and protein expression stimulate lipid peroxidation, reduce cellular antioxidant defense, and render cells more vulnerable to iron ascorbate-generating oxidative stress. Scrutiny into potential mechanisms reveals a decline in the cytoprotective transcription factor Nrf2 whose promoter region contains antioxidant response elements. Additionally, our results document raised levels of inflammatory agents, due partly to the activation of the transcription factor NF-κB. On the other hand, we demonstrate that HNF4α ablation leads to a significant lowering of HDL production along with its lipid and protein moieties, as well as to diminished CM output via the inhibition of apoB-48 synthesis and the down-regulation of MTP. Importantly, HNF4α silencing did not disturb cell integrity and differentiation.
Free radicals, formed as natural by-products of normal oxygen metabolism, are highly reactive molecules as a result of the presence of unpaired electrons. To regulate the destructive effects of reactive oxygen species, vital tissues were equipped with an intricate antioxidant system. When the production of free radicals is far in excess of their rate of detoxification by endogenous mechanisms, oxidative stress prevails. The findings of this study point out the increased susceptibility of HNF4α-depleted Caco-2 cells to develop oxidative stress as evidenced by the elevated levels of conjugated dienes and MDA, which represent strong lipid peroxidation markers. Because excessive reactive oxygen species emerge as a consequence of a faulty antioxidant defense, we assessed cytoplasmic SOD1, CAT, GPx, and HO-1. SOD1 converts superoxide anion to H2O2, which is subsequently neutralized to water by CAT or GPx. In this study, SOD1 activity was elevated in HNF4α-depleted Caco-2 cells, although the activity of all three other endogenous free radical scavengers was found to be significantly reduced. A similar imbalance in primary and secondary endogenous antioxidants has already been found in the tissue of patients with Crohn disease (50) and in Caco-2 cells inflicted with powerful oxidative stress.3 We subsequently determined the protein expression of Nrf2, a cellular stress sensor against oxidative stress and chemically induced injury preventing the pathogenesis of diseases. The actin-bound Keap1 sequesters Nrf2 in the cytosol and serves as an E3 ligase, shuttling the continuously ubiquinated Nrf2 to the proteasome for degradation (51). Hence, basal levels of Nrf2-driven genes can be quite low. Upon cytosolic activation of Nrf2, the transcription factor released from Keap1 translocates to the cell nucleus, binds to the promoters containing ARE, and accelerates transcription (52, 53). Clusters transcribed include genes of GPX, SOD1, and CAT (54–56) as well as those of several enzymes involved in cellular protection (51, 53, 57–60). According to our data, there was a down-regulation of Nrf2 in HNF4α-depleted Caco-2 cells, which may explain the decline in the activity of CAT, GPx, and HO-1. In conjunction, we observed that treatment with Nrf2 activators and protective agents prevents its decrease in HNF4α-depleted Caco-2 cells. Indeed, to ascertain whether or not induction was based on cancellation of the Keap1-promoting Nrf2 degradation, we used Oltipraz, a substituted 1,2-dithiole-3-thione, as well as diethyl maleate, both of which induce antioxidant enzymes via the activation of Nrf2 transcription factor. They disrupt the Nrf2-Keap1 complex and cause Nrf2 to translocate to the nucleus allowing dimerization with its partners, binding to ARE (core sequence: 5′TGACnnnGC3′) in the promoter region of antioxidant genes, stimulation of gene transcription, and the coordinated up-regulation of ARE-driven defense genes (61, 62). In our study, in the presence of the two chemical agents, Nrf2 recovers its initial protein mass value, which indicates that it escapes Keap1-mediated repression, translocates into the nucleus, and activates the expression of its target genes, thereby preventing oxidative stress. This makes HNF4α an important transcription factor for the control of oxidative stress. It is possible that, in the absence of HNF4α, there is no induction of certain electrophilic agents that could activate Nrf2. Nevertheless, additional studies are needed to delineate the mechanisms for their cross-talk.
Our findings stressed that Caco-2 cells lacking expression of the HNF4A gene had an augmented production of pro-inflammatory proteins IL-6 and IL-8, as well as LTB4, a potent inflammatory lipid mediator. Concomitantly, an activation of NF-κB was noted in HNF4α-depleted Caco-2 cells given its abundant localization in the nucleus, which indicates the degradation of the inhibitory subunit IκB that generally retains NF-κB in the cytoplasm (63). In turn, the nuclear translocation of NF-κB activates the expression of target genes such as IL-6 and IL-8 in the nucleus. Therefore, our data suggest that HNF4α shRNA-infected cells could be responsible for the stimulation of NF-κB in human enterocytes. In line with our studies, HNF4α expression was significantly decreased in patients with inflammatory bowel diseases (26). Furthermore, the intestine-specific HNF4α knock-out mouse line demonstrated an amplified susceptibility to dextran sulfate sodium-induced colitis, and consistent with our data, several cytokines were significantly increased (26). Moreover, a long term and chronic inflammatory consequence arising from the colonic epithelial loss of this transcriptional regulator was observed in the intestine of HNF4α knock-out mice (64). Finally, a cross-talk between HNF4α and NF-κB was reported (65–67). Other potential mechanisms include the activation of the transcription factor NF-κB by pro-oxidants, thereby resulting in the initiation of the expression of genes controlling several aspects of the inflammatory, immune, and acute phase responses (68–72). The possibility that HNF4α abolishment leads to cellular oxidative stress, which in turn could provoke an inflammatory state, requires further investigation. All together, these observations suggest that HNF4α may have an important role in the etiology of inflammatory bowel disease.
HNF4α was described as a major positive regulator of a different set of liver-specific genes, including apolipoproteins (APOA1 and APOC3) (1, 73). The present experiments could demonstrate that HNF4α shRNA-infected cells resulted in the reduced capacity of intestinal Caco-2 cells to produce HDL and its major protein component, apoA-I. Various investigations reported that HDL and apoA-I protect against the development of atherosclerosis by mediating reverse cholesterol transport, a pathway by which excess cholesterol is removed from peripheral cells such as plaque macrophages to the liver for excretion (74, 75). Subsequently, HDL and apoA-I were shown to inhibit inflammatory and oxidative damage, a situation in concordance with our observations depicting a lower output of HDL and apoA-I along with pro-inflammatory and pro-oxidant events in HNF4α-depleted Caco-2 cells.
ApoA-IV is also a component of HDL, but it is mostly transported by CM. HNF4α-depleted Caco-2 cells led to a reduced production of apoA-IV. When previous studies attempted to define the fine mapping of the regulatory regions involved in the hepatic and intestinal transcription of the APOA4 gene, they identified a cis-acting element in the proximal region of the APOA4 promoter absolutely necessary for its activity. They documented that HNF4α binds to this region and activates transcription, whereas different repressors compete with HNF4α for the same binding site (76).
According to our findings, HNF4α controls the expression of key genes in intestinal CM assembly. Its deficiency affected the full expression of MTP and the synthesis of apoB-48, two essential factors for TG-rich lipoprotein packaging and secretion. Previous studies of the liver showed the regulation of hepatic VLDL metabolism by binding as a homodimer to direct repeat-1 DNA motifs (77) of APOB and MTP (78–80). Further studies will determine how down-regulation of the expression of HNF4α modulates the transcriptional activity of key proteins necessary for TG and cholesterol transport in the small intestine.
To explore HNF4α targets genes, we first scrutinized the scientific literature available. Many of HNF4α targets genes have been reported by some investigators in different tissues. For example, a study performed by Odom et al. (47) using ChIP combined with promoter microarrays revealed HNF4α capacity to bind to promoters of many genes involved in lipid metabolism (APOA1, APOA2, APOB, APOC2, APOC3, and MTP) and, interestingly, in glutathione metabolism and oxidative stress (SOD1, GPX1, GPX2, and GTP), as well as in inflammatory processes (IL11RA, IL15, IL1RAP, IL22R, and NFKB1B). Similarly, employing an approach combining a prediction model and HepG2 HNF4α RNAi knockdown cells, Bolotin et al. (48) revealed 240 new direct HNF4α human target genes. A certain number of them were related to classical HNF4α functions (e.g. metabolism, homeostasis, transcription regulation, and transport), whereas a few were found associated with new HNF4α roles, for instance signal transduction, cell structure, cell cycle, apoptosis, and, in line with our results, immunity (e.g. IL32 and IL1R1) and stress response (e.g. SOD2). Moreover, about 1500 genes were down-regulated in the HepG2 HNF4α knockdown cells, including genes implicated in lipid metabolism and transport (DGAT1, LOX, and FABP1), inflammation (TNFRSF11A, NFKBIZ, MAP3K11, PIK3AP1, and CARD10) and mitochondrial functions (ABCB6 and OGG1). Recently, Boyd et al. (49) have performed a ChIP-chip analysis of the human intestinal cell line Caco-2 to make a genome-wide identification of HNF4α binding to promoter regions. They recorded 1541 genes as potential HNF4α targets. Some of these genes had already been identified as HNF4α targets in hepatocytes, such as genes involved in lipid metabolism (APOA2, APOC3, APOA1, and apoA-IV precursor, MTP, APOB, SCD, and HMGCS1), but some had not been previously identified as specific targets, for instance, genes associated with inflammation (INFGR1, TNFRSF1A, and IL13RA1), oxidative stress (PON2, NOX1, GSS, and GST), intestinal epithelial cell cycle regulation (PTEN), and intestinal differentiation processes (CDX2). Taken together, these studies indicate the ability of HNF4α to target various genes that were examined in our work.
We also performed in silico analyses with the intention of studying the putative HNF4α recognition site sequences in the promoter regions of the new possible HNF4α target genes exposed in our study (NFE2L2, HO-1, and CAT). These analyses reveal two potential HNF4α-binding sites in NFE2L2, four in HO-1 and three in CAT promoter regions, which suggest that HNF4α could directly regulate these genes.
Besides its direct regulation of various genes related to oxidative stress, inflammation, and lipid transport in intestinal epithelial cells, HNF4α has targeted the modification of specific genes related to nuclear receptors and transcription factors such as SREBP2, SREBP1C, PPARA, LXRA, and LXRB. The PPARA gene has been documented in the literature as a direct HNF4α target gene (81), although evidence from in vitro and in vivo studies indicate that SREBP-1c interacts directly with HNF4α (82). Furthermore, it has been demonstrated that SREBP-2 binds the human HNF4A P1 promoter and negatively regulates its expression (83). Finally, it has been suggested that HNF4α accelerates transcription of sterol regulatory element-binding protein target genes by stimulating the transcriptional activity of SREBP2, although confirmation was obtained the HNF4α capacity to interact with SREBP-2 (84). In conjunction, HNF4α was shown to control the expression of other important liver enriched transcription factors in vivo, including HNF-1α, C/EBP-α, PGC-1α (85). Therefore, these transcription factors may serve as potential candidates for multiple actions of HNF4α.
In fact, for example, PPARs play important roles in different cells and tissues by regulating metabolism, cell differentiation, and tissue inflammation that contributes to metabolic disorders and various diseases. PPAR activators exert their anti-inflammatory activities by stimulating the catabolism of pro-inflammatory eicosanoids (86). They also inhibit the activation of inflammatory response genes (e.g. cytokines, metalloproteases, and acute phase proteins) by negatively interfering with the NF-κB signaling pathway (87, 88). Moreover, PPARα has been shown to take part in the control of the cellular redox status (87, 89), and administration of PPARα activators resulted in a drastic increase of the CAT activity (90). A PPAR-responsive element has been identified in promoter regions of CAT and SOD1 genes (91). Growing evidence has also clearly pointed out that LXRs play a pivotal role in negatively regulating pro-inflammatory gene expression (e.g. IL-6 and cyclooxygenase 2) induced by LPS and bacteria (92), at least in part through inhibition of NF-κB (93). Interestingly, an HNF4α regulatory element was previously identified within the human PPARA promoter, and induction of its promoter activity by HNF4α was reported (81). This element closely resembles several HNF4α regulatory elements found in other genes and the GGGGCAAAGGTCA consensus HNF4α-binding site (94). Moreover, the regulation of PPARα gene expression by HNF4α in vivo was recently demonstrated using HNF4α-deficient mice (95), which display significantly lower PPARα mRNA levels compared with wild-type mice. As to the relationship between HNF4α and LXR, an interaction between them was observed in the regulation of human APOA1 gene expression in HepG2 cells treated with TNFα (96).
Conversely, the impact of inflammation and oxidative stress on the transcription factors involved in lipid metabolism has been studied by many groups and seems to be different depending on the organ and/or the model studied. Results similar to ours have been found in liver cells, where TNF-α and IL-1 caused a marked decrease in retinoid X receptor α, PPARα, PPARγ, LXRα and SREBP-1c (97). In the liver of apoE knock-out mice and in HepG2 cells, inflammatory stress inhibited PPARα and LXRα but increased cholesterol accumulation and SREBP-2 (98). Similarly, hepatic mRNA levels of LXR and retinoid X receptor together with their target genes were rapidly decreased by LPS and proinflammatory cytokines in rodents during the acute phase response (99). A transcriptome study of the acute phase response to LPS in vivo reported a coordinate decrease of cholesterogenic gene expression (100). On the other hand, oxidative stress increased lipid hepatic lipogenesis by stimulating LXRα and SREBP-1c in HepG2 cells (101, 102). Moreover, in livers of glutathione-deficient rats, lower mRNA abundance of SREBP-1c was detected (103), whereas in enterocytes, TNFα treatment induced MTP protein and SREBP-1c protein and mRNA levels (104). Thus, accumulating evidence suggests a solid link between HNF4α-mediated transcription factor modifications and inflammation/oxidative stress.
Our findings have highlighted the crucial role of HNF4α in lipid transport, as well as cell defense against oxidative stress and inflammation. The data of this study are in line with recent studies that reported the protective action of HNF4α against inflammatory bowel diseases (26, 64). Moreover, the potential associations between the HNF4A locus and ulcerative colitis (105) strengthen the potent influence of this multifaceted transcription factor on the anti-inflammatory defense.
Acknowledgment
We thank Schohraya Spahis for technical assistance.
This work was supported by the Canadian Institutes of Health Research Team Grant CTP-82942, the J. A. DeSève Research Chair in Nutrition (to E. L.), and the Canadian Institutes of Health research fellowship award (to V. M.).
E. Levy, unpublished data.
- FA
- fatty acid
- apo
- apolipoprotein
- ARE
- antioxidant response elements
- CE
- cholesteryl ester
- GPx
- glutathione peroxidase
- LTB4
- leukotriene B4
- MDA
- malondialdehyde
- MTP
- microsomal triglyceride transfer protein
- NF-κB
- nuclear factor-κB
- PL
- phospholipid
- TG
- triglyceride
- CM
- chylomicron
- PPAR
- peroxisome proliferator-activated receptor
- LXR
- liver X receptor.
REFERENCES
- 1.Sladek F. M., Zhong W. M., Lai E., Darnell J. E., Jr. (1990) Genes. Dev. 4, 2353–2365 [DOI] [PubMed] [Google Scholar]
- 2.Taraviras S., Monaghan A. P., Schütz G., Kelsey G. (1994) Mech. Dev. 48, 67–79 [DOI] [PubMed] [Google Scholar]
- 3.Miquerol L., Lopez S., Cartier N., Tulliez M., Raymondjean M., Kahn A. (1994) J. Biol. Chem. 269, 8944–8951 [PubMed] [Google Scholar]
- 4.Gonzalez F. J. (2008) Drug Metab. Pharmacokinet. 23, 2–7 [DOI] [PubMed] [Google Scholar]
- 5.Sladek F. M. (1993) Receptor 3, 223–232 [PubMed] [Google Scholar]
- 6.Lian G., Wang C., Teng C., Zhang C., Du L., Zhong Q., Miao C., Ding M., Deng H. (2006) Exp. Hematol. 34, 348–358 [DOI] [PubMed] [Google Scholar]
- 7.Fiegel H. C., Lioznov M. V., Cortes-Dericks L., Lange C., Kluth D., Fehse B., Zander A. R. (2003) Stem Cells 21, 98–104 [DOI] [PubMed] [Google Scholar]
- 8.Kakinuma S., Tanaka Y., Chinzei R., Watanabe M., Shimizu-Saito K., Hara Y., Teramoto K., Arii S., Sato C., Takase K., Yasumizu T., Teraoka H. (2003) Stem Cells 21, 217–227 [DOI] [PubMed] [Google Scholar]
- 9.Chien C. C., Yen B. L., Lee F. K., Lai T. H., Chen Y. C., Chan S. H., Huang H. I. (2006) Stem Cells 24, 1759–1768 [DOI] [PubMed] [Google Scholar]
- 10.Silander K., Mohlke K. L., Scott L. J., Peck E. C., Hollstein P., Skol A. D., Jackson A. U., Deloukas P., Hunt S., Stavrides G., Chines P. S., Erdos M. R., Narisu N., Conneely K. N., Li C., Fingerlin T. E., Dhanjal S. K., Valle T. T., Bergman R. N., Tuomilehto J., Watanabe R. M., Boehnke M., Collins F. S. (2004) Diabetes 53, 1141–1149 [DOI] [PubMed] [Google Scholar]
- 11.Love-Gregory L. D., Wasson J., Ma J., Jin C. H., Glaser B., Suarez B. K., Permutt M. A. (2004) Diabetes 53, 1134–1140 [DOI] [PubMed] [Google Scholar]
- 12.Rowley C. W., Staloch L. J., Divine J. K., McCaul S. P., Simon T. C. (2006) Am. J. Physiol. Gastrointest. Liver Physiol. 290, G466–G475 [DOI] [PubMed] [Google Scholar]
- 13.Ryffel G. U. (2001) J. Mol. Endocrinol. 27, 11–29 [DOI] [PubMed] [Google Scholar]
- 14.Li J., Ning G., Duncan S. A. (2000) Genes. Dev. 14, 464–474 [PMC free article] [PubMed] [Google Scholar]
- 15.Parviz F., Matullo C., Garrison W. D., Savatski L., Adamson J. W., Ning G., Kaestner K. H., Rossi J. M., Zaret K. S., Duncan S. A. (2003) Nat. Genet. 34, 292–296 [DOI] [PubMed] [Google Scholar]
- 16.Battle M. A., Konopka G., Parviz F., Gaggl A. L., Yang C., Sladek F. M., Duncan S. A. (2006) Proc. Natl. Acad. Sci. U.S.A. 103, 8419–8424 [DOI] [PMC free article] [PubMed] [Google Scholar]
- 17.Garrison W. D., Battle M. A., Yang C., Kaestner K. H., Sladek F. M., Duncan S. A. (2006) Gastroenterology 130, 1207–1220 [DOI] [PMC free article] [PubMed] [Google Scholar]
- 18.Lussier C. R., Babeu J. P., Auclair B. A., Perreault N., Boudreau F. (2008) Am. J. Physiol. Gastrointest. Liver Physiol. 294, G418–G428 [DOI] [PubMed] [Google Scholar]
- 19.Babeu J. P., Darsigny M., Lussier C. R., Boudreau F. (2009) Am. J. Physiol. Gastrointest. Liver Physiol. 297, G124–G134 [DOI] [PubMed] [Google Scholar]
- 20.Antes T. J., Levy-Wilson B. (2001) DNA Cell Biol. 20, 67–74 [DOI] [PubMed] [Google Scholar]
- 21.Ginsburg G. S., Ozer J., Karathanasis S. K. (1995) J. Clin. Invest. 96, 528–538 [DOI] [PMC free article] [PubMed] [Google Scholar]
- 22.Swenson E. S., Mann E. A., Jump M. L., Giannella R. A. (1999) Am. J. Physiol. 276, G728–G736 [DOI] [PubMed] [Google Scholar]
- 23.Tegude H., Schnabel A., Zanger U. M., Klein K., Eichelbaum M., Burk O. (2007) Drug Metab. Dispos. 35, 946–954 [DOI] [PubMed] [Google Scholar]
- 24.Olsen L., Bressendorff S., Troelsen J. T., Olsen J. (2005) Am. J. Physiol. Gastrointest. Liver Physiol. 289, G220–G226 [DOI] [PubMed] [Google Scholar]
- 25.Stegmann A., Hansen M., Wang Y., Larsen J. B., Lund L. R., Ritié L., Nicholson J. K., Quistorff B., Simon-Assmann P., Troelsen J. T., Olsen J. (2006) Physiol. Genomics 27, 141–155 [DOI] [PubMed] [Google Scholar]
- 26.Ahn S. H., Shah Y. M., Inoue J., Morimura K., Kim I., Yim S., Lambert G., Kurotani R., Nagashima K., Gonzalez F. J., Inoue Y. (2008) Inflamm. Bowel Dis. 14, 908–920 [DOI] [PMC free article] [PubMed] [Google Scholar]
- 27.Ward P. A., Till G. O., Hatherill J. R., Annesley T. M., Kunkel R. G. (1985) J. Clin. Invest. 76, 517–527 [DOI] [PMC free article] [PubMed] [Google Scholar]
- 28.Courtois F., Suc I., Garofalo C., Ledoux M., Seidman E., Levy E. (2000) Am. J. Physiol. Gastrointest. Liver Physiol. 279, G12–G19 [DOI] [PubMed] [Google Scholar]
- 29.Marcil V., Delvin E., Sané A. T., Tremblay A., Levy E. (2006) Cardiovasc. Res. 72, 473–482 [DOI] [PubMed] [Google Scholar]
- 30.Precourt L. P., Seidman E., Delvin E., Amre D., Deslandres C., Dominguez M., Sinnett D., Levy E. (2009) Int. J. Biochem. Cell Biol. 41, 1628–1637 [DOI] [PubMed] [Google Scholar]
- 31.Pippenger C. E., Browne R. W., Armstrong D. (1998) Methods Mol. Biol. 108, 299–313 [DOI] [PubMed] [Google Scholar]
- 32.Kutty R. K., Maines M. D. (1982) J. Biol. Chem. 257, 9944–9952 [PubMed] [Google Scholar]
- 33.Livak K. J., Schmittgen T. D. (2001) Methods 25, 402–408 [DOI] [PubMed] [Google Scholar]
- 34.Eeckhoute J., Moerman E., Bouckenooghe T., Lukoviak B., Pattou F., Formstecher P., Kerr-Conte J., Vandewalle B., Laine B. (2003) Endocrinology 144, 1686–1694 [DOI] [PubMed] [Google Scholar]
- 35.Mehran M., Seidman E., Marchand R., Gurbindo C., Levy E. (1995) Am. J. Physiol. 269, G953–G960 [DOI] [PubMed] [Google Scholar]
- 36.Spalinger J. H., Seidman E. G., Lepage G., Ménard D., Gavino V., Levy E. (1998) Am. J. Physiol. 275, G652–G659 [DOI] [PubMed] [Google Scholar]
- 37.Levy E., Thibault L., Ménard D. (1992) J. Lipid Res. 33, 1607–1617 [PubMed] [Google Scholar]
- 38.Loirdighi N., Ménard D., Levy E. (1992) Biochim. Biophys. Acta 1175, 100–106 [DOI] [PubMed] [Google Scholar]
- 39.Mailhot G., Rabasa-Lhoret R., Moreau A., Berthiaume Y., Levy E. (2010) PLoS One 5, e10446. [DOI] [PMC free article] [PubMed] [Google Scholar]
- 40.Marcil V., Delvin E., Seidman E., Poitras L., Zoltowska M., Garofalo C., Levy E. (2002) Am. J. Physiol. Gastrointest. Liver Physiol. 283, G340–G346 [DOI] [PubMed] [Google Scholar]
- 41.Levy E., Thibault L., Delvin E., Ménard D. (1994) Biochem. Biophys. Res. Commun. 204, 1340–1345 [DOI] [PubMed] [Google Scholar]
- 42.Levy E., Sinnett D., Thibault L., Nguyen T. D., Delvin E., Ménard D. (1996) FEBS Lett. 393, 253–258 [DOI] [PubMed] [Google Scholar]
- 43.Loirdighi N., Ménard D., Delvin D., Levy E. (1997) J. Cell. Biochem. 66, 65–76 [DOI] [PubMed] [Google Scholar]
- 44.Levy E., Stan S., Delvin E., Menard D., Shoulders C., Garofalo C., Slight I., Seidman E., Mayer G., Bendayan M. (2002) J. Biol. Chem. 277, 16470–16477 [DOI] [PubMed] [Google Scholar]
- 45.Wetterau J. R., Zilversmit D. B. (1985) Chem. Phys. Lipids 38, 205–222 [DOI] [PubMed] [Google Scholar]
- 46.Wetterau J. R., Lin M. C., Jamil H. (1997) Biochim. Biophys. Acta 1345, 136–150 [DOI] [PubMed] [Google Scholar]
- 47.Odom D. T., Zizlsperger N., Gordon D. B., Bell G. W., Rinaldi N. J., Murray H. L., Volkert T. L., Schreiber J., Rolfe P. A., Gifford D. K., Fraenkel E., Bell G. I., Young R. A. (2004) Science 303, 1378–1381 [DOI] [PMC free article] [PubMed] [Google Scholar]
- 48.Bolotin E., Liao H., Ta T. C., Yang C., Hwang-Verslues W., Evans J. R., Jiang T., Sladek F. M. (2010) Hepatology 51, 642–653 [DOI] [PMC free article] [PubMed] [Google Scholar]
- 49.Boyd M., Bressendorff S., Møller J., Olsen J., Troelsen J. T. (2009) BMC Gastroenterol. 9, 68. [DOI] [PMC free article] [PubMed] [Google Scholar]
- 50.Kruidenier L., Kuiper I., Van Duijn W., Mieremet-Ooms M. A., van Hogezand R. A., Lamers C. B., Verspaget H. W. (2003) J. Pathol. 201, 17–27 [DOI] [PubMed] [Google Scholar]
- 51.Zhang D. D., Hannink M. (2003) Mol. Cell. Biol. 23, 8137–8151 [DOI] [PMC free article] [PubMed] [Google Scholar]
- 52.Itoh K., Wakabayashi N., Katoh Y., Ishii T., O'Connor T., Yamamoto M. (2003) Genes Cells 8, 379–391 [DOI] [PubMed] [Google Scholar]
- 53.Itoh K., Chiba T., Takahashi S., Ishii T., Igarashi K., Katoh Y., Oyake T., Hayashi N., Satoh K., Hatayama I., Yamamoto M., Nabeshima Y. (1997) Biochem. Biophys. Res. Commun. 236, 313–322 [DOI] [PubMed] [Google Scholar]
- 54.Kwak M. K., Itoh K., Yamamoto M., Sutter T. R., Kensler T. W. (2001) Mol. Med. 7, 135–145 [PMC free article] [PubMed] [Google Scholar]
- 55.Ishii T., Itoh K., Takahashi S., Sato H., Yanagawa T., Katoh Y., Bannai S., Yamamoto M. (2000) J. Biol. Chem. 275, 16023–16029 [DOI] [PubMed] [Google Scholar]
- 56.Asghar M., George L., Lokhandwala M. F. (2007) Am. J. Physiol. Renal Physiol. 293, F914–F919 [DOI] [PubMed] [Google Scholar]
- 57.Chan K., Han X. D., Kan Y. W. (2001) Proc. Natl. Acad. Sci. U.S.A. 98, 4611–4616 [DOI] [PMC free article] [PubMed] [Google Scholar]
- 58.Cullinan S. B., Diehl J. A. (2004) J. Biol. Chem. 279, 20108–20117 [DOI] [PubMed] [Google Scholar]
- 59.Katsuoka F., Motohashi H., Ishii T., Aburatani H., Engel J. D., Yamamoto M. (2005) Mol. Cell. Biol. 25, 8044–8051 [DOI] [PMC free article] [PubMed] [Google Scholar]
- 60.Wild A. C., Mulcahy R. T. (2000) Free Radic. Res. 32, 281–301 [DOI] [PubMed] [Google Scholar]
- 61.Ramos-Gomez M., Kwak M. K., Dolan P. M., Itoh K., Yamamoto M., Talalay P., Kensler T. W. (2001) Proc. Natl. Acad. Sci. U.S.A. 98, 3410–3415 [DOI] [PMC free article] [PubMed] [Google Scholar]
- 62.Goldring C. E., Kitteringham N. R., Elsby R., Randle L. E., Clement Y. N., Williams D. P., McMahon M., Hayes J. D., Itoh K., Yamamoto M., Park B. K. (2004) Hepatology 39, 1267–1276 [DOI] [PubMed] [Google Scholar]
- 63.Siebenlist U., Franzoso G., Brown K. (1994) Annu. Rev. Cell Biol. 10, 405–455 [DOI] [PubMed] [Google Scholar]
- 64.Darsigny M., Babeu J. P., Dupuis A. A., Furth E. E., Seidman E. G., Lévy E., Verdu E. F., Gendron F. P., Boudreau F. (2009) PLoS One 4, e7609. [DOI] [PMC free article] [PubMed] [Google Scholar]
- 65.De Bosscher K., Vanden Berghe W., Haegeman G. (2006) Oncogene 25, 6868–6886 [DOI] [PubMed] [Google Scholar]
- 66.Guo H., Wei J., Inoue Y., Gonzalez F. J., Kuo P. C. (2003) Am. J. Physiol. Cell Physiol. 284, C1090–C1099 [DOI] [PubMed] [Google Scholar]
- 67.Nikolaidou-Neokosmidou V., Zannis V. I., Kardassis D. (2006) Biochem. J. 398, 439–450 [DOI] [PMC free article] [PubMed] [Google Scholar]
- 68.Bonizzi G., Piette J., Schoonbroodt S., Greimers R., Havard L., Merville M. P., Bours V. (1999) Mol. Cell. Biol. 19, 1950–1960 [DOI] [PMC free article] [PubMed] [Google Scholar]
- 69.Bernotti S., Seidman E., Sinnett D., Brunet S., Dionne S., Delvin E., Levy E. (2003) Am. J. Physiol. Gastrointest. Liver Physiol. 285, G898–G906 [DOI] [PubMed] [Google Scholar]
- 70.Natarajan R., Ghosh S., Fisher B. J., Diegelmann R. F., Willey A., Walsh S., Graham M. F., Fowler A. A., 3rd (2001) J. Interferon Cytokine Res. 21, 349–359 [DOI] [PubMed] [Google Scholar]
- 71.Schreck R., Rieber P., Baeuerle P. A. (1991) EMBO J. 10, 2247–2258 [DOI] [PMC free article] [PubMed] [Google Scholar]
- 72.Sen C. K., Packer L. (1996) FASEB J. 10, 709–720 [DOI] [PubMed] [Google Scholar]
- 73.Mietus-Snyder M., Sladek F. M., Ginsburg G. S., Kuo C. F., Ladias J. A., Darnell J. E., Jr., Karathanasis S. K. (1992) Mol. Cell. Biol. 12, 1708–1718 [DOI] [PMC free article] [PubMed] [Google Scholar]
- 74.Rye K. A., Bursill C. A., Lambert G., Tabet F., Barter P. J. (2009) J. Lipid Res. 50, S195–S200 [DOI] [PMC free article] [PubMed] [Google Scholar]
- 75.Lewis G. F., Rader D. J. (2005) Circ. Res. 96, 1221–1232 [DOI] [PubMed] [Google Scholar]
- 76.Ktistaki E., Lacorte J. M., Katrakili N., Zannis V. I., Talianidis I. (1994) Nucleic Acids Res. 22, 4689–4696 [DOI] [PMC free article] [PubMed] [Google Scholar]
- 77.Petrescu A. D., Hertz R., Bar-Tana J., Schroeder F., Kier A. B. (2002) J. Biol. Chem. 277, 23988–23999 [DOI] [PubMed] [Google Scholar]
- 78.Gibbons G. F., Wiggins D., Brown A. M., Hebbachi A. M. (2004) Biochem. Soc. Trans. 32, 59–64 [DOI] [PubMed] [Google Scholar]
- 79.Hussain M. M., Rava P., Pan X., Dai K., Dougan S. K., Iqbal J., Lazare F., Khatun I. (2008) Curr. Opin. Lipidol. 19, 277–284 [DOI] [PubMed] [Google Scholar]
- 80.Sheena V., Hertz R., Nousbeck J., Berman I., Magenheim J., Bar-Tana J. (2005) J. Lipid Res. 46, 328–341 [DOI] [PubMed] [Google Scholar]
- 81.Pineda Torra I., Jamshidi Y., Flavell D. M., Fruchart J. C., Staels B. (2002) Mol. Endocrinol. 16, 1013–1028 [DOI] [PubMed] [Google Scholar]
- 82.Ponugoti B., Fang S., Kemper J. K. (2007) Mol. Endocrinol. 21, 2698–2712 [DOI] [PubMed] [Google Scholar]
- 83.Xie X., Liao H., Dang H., Pang W., Guan Y., Wang X., Shyy J. Y., Zhu Y., Sladek F. M. (2009) Mol. Endocrinol. 23, 434–443 [DOI] [PMC free article] [PubMed] [Google Scholar]
- 84.Misawa K., Horiba T., Arimura N., Hirano Y., Inoue J., Emoto N., Shimano H., Shimizu M., Sato R. (2003) J. Biol. Chem. 278, 36176–36182 [DOI] [PubMed] [Google Scholar]
- 85.Qadri I., Hu L. J., Iwahashi M., Al-Zuabi S., Quattrochi L. C., Simon F. R. (2009) Toxicol. Appl. Pharmacol. 234, 281–292 [DOI] [PubMed] [Google Scholar]
- 86.Crisafulli C., Cuzzocrea S. (2009) Shock 32, 62–73 [DOI] [PubMed] [Google Scholar]
- 87.Poynter M. E., Daynes R. A. (1998) J. Biol. Chem. 273, 32833–32841 [DOI] [PubMed] [Google Scholar]
- 88.Marx N., Sukhova G. K., Collins T., Libby P., Plutzky J. (1999) Circulation 99, 3125–3131 [DOI] [PMC free article] [PubMed] [Google Scholar]
- 89.Braissant O., Foufelle F., Scotto C., Dauça M., Wahli W. (1996) Endocrinology 137, 354–366 [DOI] [PubMed] [Google Scholar]
- 90.Klucis E., Crane D., Masters C. (1984) Mol. Cell. Biochem. 65, 73–82 [DOI] [PubMed] [Google Scholar]
- 91.Girnun G. D., Domann F. E., Moore S. A., Robbins M. E. (2002) Mol. Endocrinol. 16, 2793–2801 [DOI] [PubMed] [Google Scholar]
- 92.Joseph S. B., Castrillo A., Laffitte B. A., Mangelsdorf D. J., Tontonoz P. (2003) Nat. Med. 9, 213–219 [DOI] [PubMed] [Google Scholar]
- 93.Terasaka N., Hiroshima A., Ariga A., Honzumi S., Koieyama T., Inaba T., Fujiwara T. (2005) FEBS J. 272, 1546–1556 [DOI] [PubMed] [Google Scholar]
- 94.Fraser J. D., Martinez V., Straney R., Briggs M. R. (1998) Nucleic Acids Res. 26, 2702–2707 [DOI] [PMC free article] [PubMed] [Google Scholar]
- 95.Hayhurst G. P., Lee Y. H., Lambert G., Ward J. M., Gonzalez F. J. (2001) Mol. Cell. Biol. 21, 1393–1403 [DOI] [PMC free article] [PubMed] [Google Scholar]
- 96.Mogilenko D. A., Dizhe E. B., Shavva V. S., Lapikov I. A., Orlov S. V., Perevozchikov A. P. (2009) Biochemistry 48, 11950–11960 [DOI] [PubMed] [Google Scholar]
- 97.Kim M. S., Sweeney T. R., Shigenaga J. K., Chui L. G., Moser A., Grunfeld C., Feingold K. R. (2007) Metabolism 56, 267–279 [DOI] [PMC free article] [PubMed] [Google Scholar]
- 98.Ma K. L., Ruan X. Z., Powis S. H., Chen Y., Moorhead J. F., Varghese Z. (2008) Hepatology 48, 770–781 [DOI] [PubMed] [Google Scholar]
- 99.Beigneux A. P., Moser A. H., Shigenaga J. K., Grunfeld C., Feingold K. R. (2000) J. Biol. Chem. 275, 16390–16399 [DOI] [PubMed] [Google Scholar]
- 100.Yoo J. Y., Desiderio S. (2003) Proc. Natl. Acad. Sci. U.S.A. 100, 1157–1162 [DOI] [PMC free article] [PubMed] [Google Scholar]
- 101.Sekiya M., Hiraishi A., Touyama M., Sakamoto K. (2008) Biochem. Biophys. Res. Commun. 375, 602–607 [DOI] [PubMed] [Google Scholar]
- 102.Kim Y. W., Kim Y. M., Yang Y. M., Kim T. H., Hwang S. J., Lee J. R., Kim S. C., Kim S. G. (2010) Free Radic. Biol. Med. 48, 567–578 [DOI] [PubMed] [Google Scholar]
- 103.Brandsch C., Schmidt T., Behn D., Weisse K., Mueller A. S., Stangl G. I. (2010) Lipids Health Dis. 9, 50. [DOI] [PMC free article] [PubMed] [Google Scholar]
- 104.Qin B., Dawson H., Anderson R. A. (2010) Exp. Biol. Med. 235, 199–205 [DOI] [PubMed] [Google Scholar]
- 105.Barrett J. C., Lee J. C., Lees C. W., Prescott N. J., Anderson C. A., Phillips A., Wesley E., Parnell K., Zhang H., Drummond H., Nimmo E. R., Massey D., Blaszczyk K., Elliott T., Cotterill L., Dallal H., Lobo A. J., Mowat C., Sanderson J. D., Jewell D. P., Newman W. G., Edwards C., Ahmad T., Mansfield J. C., Satsangi J., Parkes M., Mathew C. G., Donnelly P., Peltonen L., Blackwell J. M., Bramon E., Brown M. A., Casas J. P., Corvin A., Craddock N., Deloukas P., Duncanson A., Jankowski J., Markus H. S., Mathew C. G., McCarthy M. I., Palmer C. N., Plomin R., Rautanen A., Sawcer S. J., Samani N., Trembath R. C., Viswanathan A. C., Wood N., Spencer C. C., Barrett J. C., Bellenguez C., Davison D., Freeman C., Strange A., Donnelly P., Langford C., Hunt S. E., Edkins S., Gwilliam R., Blackburn H., Bumpstead S. J., Dronov S., Gillman M., Gray E., Hammond N., Jayakumar A., McCann O. T., Liddle J., Perez M. L., Potter S. C., Ravindrarajah R., Ricketts M., Waller M., Weston P., Widaa S., Whittaker P., Deloukas P., Peltonen L., Mathew C. G., Blackwell J. M., Brown M. A., Corvin A., McCarthy M. I., Spencer C. C., Attwood A. P., Stephens J., Sambrook J., Ouwehand W. H., McArdle W. L., Ring S. M., Strachan D. P. (2009) Nat. Genet. 41, 1330–1334 [DOI] [PMC free article] [PubMed] [Google Scholar]