Abstract
The mechanism that regulates embryonic liver morphogenesis remains elusive. Progranulin (PGRN) is postulated to play a critical role in regulating pathological liver growth. Nevertheless, the exact regulatory mechanism of PGRN in relation to its functional role in embryonic liver development remains to be elucidated. In our study, the knockdown of progranulin A (GrnA), an orthologue of mammalian PGRN, using antisense morpholinos resulted in impaired liver morphogenesis in zebrafish (Danio rerio). The vital role of GrnA in hepatic outgrowth and not in liver bud formation was further confirmed using whole-mount in situ hybridization markers. In addition, a GrnA deficiency was also found to be associated with the deregulation of MET-related genes in the neonatal liver using a microarray analysis. In contrast, the decrease in liver size that was observed in grnA morphants was avoided when ectopic MET expression was produced by co-injecting met mRNA and grnA morpholinos. This phenomenon suggests that GrnA might play a role in liver growth regulation via MET signaling. Furthermore, our study has shown that GrnA positively modulates hepatic MET expression both in vivo and in vitro. Therefore, our data have indicated that GrnA plays a vital role in embryonic liver morphogenesis in zebrafish. As a result, a novel link between PGRN and MET signaling is proposed.
Keywords: Development, Genetics, Growth Factors, Liver, Zebra Fish, GrnA, Liver Growth, MET, Progranulin
Introduction
The liver is the largest essential internal organ and has a number of vital functions in the body. The liver parenchyma is largely constituted of hepatocytes (∼80%), and the remaining cells include cholangiocytes, Kupffer cells, stellate cells, and sinusoidal endothelial cells (1). Liver organogenesis is initiated in the endodermal cells of the ventral foregut, which develop competence from the cardiac mesoderm to form hepatoblasts. During the specification stages, the specified hepatoblasts form a liver bud and undergo the hepatic outgrowth process. Hepatic outgrowth is characterized by a large change in the liver bud size that is caused by the rapid proliferation of hepatoblasts. Finally, the hepatoblasts differentiate into functional hepatocytes and cholangiocytes (2, 3). In studies using chicks and mice, liver organogenesis has been shown to be tightly regulated by growth factors, cytokines, and transcription factors. However, little is known about the genetic requirements of the liver growth process and its regulatory mechanism. The use of knock-out mice has led to the discovery of several genes that are critical for hepatic outgrowth. An example of these critical genes is the met gene that encodes the hepatocyte growth factor receptor that regulates cell migration, proliferation, morphogenesis, and angiogenesis (4). A knock-out of the met gene in mice results in early embryonic lethality and a reduced liver size in utero (5). In addition, growth hormone has been shown to be a liver growth-promoting factor (6). To investigate novel regulatory factors involved in liver growth, a subtractive hybridization in conjunction with growth hormone administration was performed. This hybridization led to the identification of progranulin (PGRN)2 as a novel growth hormone-regulated growth factor in the liver (7).
PGRN, also known as epithelin/granulin precursor, acrogranin, proepithelin, and PC cell-derived growth factor, is a pleiotropic autocrine growth factor that contributes to early embryogenesis, the wound healing response, frontotemporal dementia, and tumorigenesis (8, 9). PGRN is an extracellular glycoprotein that consists of multiple copies of the cysteine-rich granulin motif. Elevated PGRN levels often occur in patients with cancer, and epidemiological studies show that PGRN is overexpressed in 70% of hepatocellular carcinoma (HCC) patients. Overexpression of PGRN promotes the growth and invasion of HCC cells (10). Treatment with a PGRN monoclonal antibody has been shown to block the established HCC tumor growth in a mouse xenotransplantation model (11), which suggests that PGRN is involved in regulating pathological hepatocyte growth. Although the dysregulation of embryonic hepatogenesis signaling has been shown to be associated with hepatocarcinogenesis (12), the physiological role of PGRN in hepatogenesis remains unclear.
Zebrafish are an ideal model for studying the physiological role of PGRN in hepatogenesis because early stages of liver organogenesis in zebrafish are similar to those observed in mice (13). There are four PGRN genes (grnA, grnB, grn1, and grn2) in the zebrafish genome, whereas only one gene encodes PGRN in mammals. According to the syntenic conservation of chromosomal localization, grnA is the orthologue of the mammalian PGRN gene. In zebrafish, the expression of grnA has been observed in the anterior endoderm and the liver primordium from 24 to 120 h post-fertilization (hpf) (14), which suggests that grnA might contribute to liver development. In the present study, we knocked down GrnA expression using morpholinos (MOs), which resulted in a small liver phenotype in zebrafish. According to the whole-mount in situ hybridization (WISH) analysis, we determined that the morphological defect was caused by an impaired hepatic outgrowth. Furthermore, a microarray approach combined with in vitro and in vivo examinations revealed that GrnA was an upstream factor of MET signaling in liver growth. Taken together, our findings indicate that GrnA is essential for embryonic liver morphogenesis. In addition, our findings also indicate a possible relationship between PGRN and MET signaling.
EXPERIMENTAL PROCEDURES
Fish Strains
The wild-type (AB) zebrafish (D. rerio) and the transgenic line Tg(fabp10:EGFP) were maintained under standard conditions. The embryos were collected using natural mating and were cultured at 28.5 °C in Ringer's solution (15).
Western Blots and Antibodies
After the embryos were injected with 0.25 ng MOs and ZFL cells (ATCC, CRL2643), they were treated with either 10 μm MOs or 100 ng/ml human recombinant progranulin (AXXORA, LLC). Next, the protein samples were isolated, and Western blotting was performed as described previously (16). The lysates were hybridized with the following primary antibodies: β-catenin (1:1000, C-18; Santa Cruz Biotechnology), Erk1/2 (1:1000; Santa Cruz Biotechnologies), phospho-Erk1/2 (1:1000, catalog no. 9101; Cell Signaling), Met (1:1000, sc-10; Santa Cruz Biotechnology), human progranulin (PG359-7; AXXORA, LLC), and actin (1:7500, MAB1501R; Millipore). The polyclonal anti-GrnA antibody was produced using the 4 multiple antigen peptide EWEDHKQKKPETQRTTTRPTG (corresponding to residues 244–264 of GrnA) to immunize BALB/c mice (LTK Biolab, Inc.).
Quantitative RT-PCR
The expression levels of the genes involved in MET signaling were assessed in embryos treated with either MOs or with MOs co-injected with grnA mRNA at 72 hpf. First-strand cDNAs were synthesized using the Superscript III first-strand synthesis system (Invitrogen), and primers were designed using Primer Express software (version 2.0, Applied Biosystems). Quantitative RT-PCR analysis was performed using Power SYBR Green PCR Master Mix (Applied Biosystems) as described previously (17). The levels of ef1a mRNA were used to normalize the relative mRNA abundance.
Morpholino Knockdown and mRNA Rescue Assay
The grnA antisense MO1 (5′-TTGAGCAGGTGGATTTGTGAACAGC-3′), MO2 (5′-GGAAAGTAAATGATCAGTCCGTGGA-3′), and MO1 with five base pair mismatches (5′-TTCAGGAGGTAGATTTGTCAAGAGC-3′) (Gene Tools) were administered either by microinjection or delivered into cells via Endo-Porter (Gene Tools) (18) at the designated concentrations. Zebrafish grnA (0.25 ng/embryo), met (0.25 ng/embryo), and lacZ (0.25 ng/embryo) mRNAs were synthesized using the mMESSAGE mMACHINE kit (Ambion) and co-injected with grnA MOs (0.25 ng/embryo) or met MO (CM2, 0.5 ng/embryo) (19) at the one-cell stage of the rescue assay.
Immunohistochemistry, Cell Number Determination, and Whole-mount in situ Hybridization
For immunohistochemistry, fixed and paraffin-embedded embryos were sectioned and hybridized with a proliferating cell nuclear antigen (PCNA) antibody (PC10; Abcam) as described previously (20). For whole-mount phosphohistone H3 (PH3) staining, PH3-positive cells were detected using the polyclonal anti-PH3 antibody (Santa Cruz Biotechnology) as the first antibody (1:200). Alexa Fluor 555 goat anti-rabbit IgG antibody conjugated to red fluorescent protein was used as the second antibody (Invitrogen) (1:750) as described previously (21). Hematoxylin and eosin staining were used to determine the size of hepatocyte. Sections and confocal images that were acquired using a Leica SP5 confocal microscope were analyzed using MetaMorph software (version 6.1). Control and grnA MO-injected Tg(fabp10:EGFP) embryos were trypsinized and homogenized to calculate the percentages of GFP-expressing liver cells among the total cells by flow cytometry. For WISH, antisense digoxigenin probes for cp (GenBankTM accession no. NM_131802), cebpb (GenBankTM accession no. NM_131884), dlx3b (GenBankTM accession no. NM_131322), fabp10 (GenBankTM accession no. NM_152960), hand2 (GenBankTM accession no. NM_131626), myod (GenBankTM accession no. NM_131262), and sePb (GenBankTM accession no. XM_001923882) were generated by in vitro transcription using T7 or SP6 RNA polymerase as described previously (22).
BrdU Incorporation and TUNEL Assays
For BrdU in vivo labeling, 4-dpf embryos were incubated for 4 h at 28.5 °C in a 5-bromo-2-deoxyuridine (BrdU) solution (10 mm; Roche Applied Science) and were fixed in 4% PFA for 24 h before being used for immunohistochemistry as described previously (21). For the TUNEL assay, 4-dpf embryos were fixed in 4% PFA overnight, washed for 30 min in PBS, and incubated in a permeabilization solution (0.1% Triton X-100, 0.1% sodium citrate) for 2 min on ice. Paraffin-embedded sections were used for the In Situ Cell Death Detection kit, TMR red (Roche Applied Science).
Microarrays
RNA samples were extracted, and oligo(dT)-primed cDNAs were prepared using the SuperScript III RT kit (Invitrogen). Microarray experiments were performed using the zebrafish 14K oligo microarray (MWG Biotech Ltd.) according to a previously described protocol (23). The data were submitted to NCBI Gene Expression Omnibus (accession no. GSE19211).
RESULTS
Antisense MOs Specifically and Efficiently Knock Down GrnA
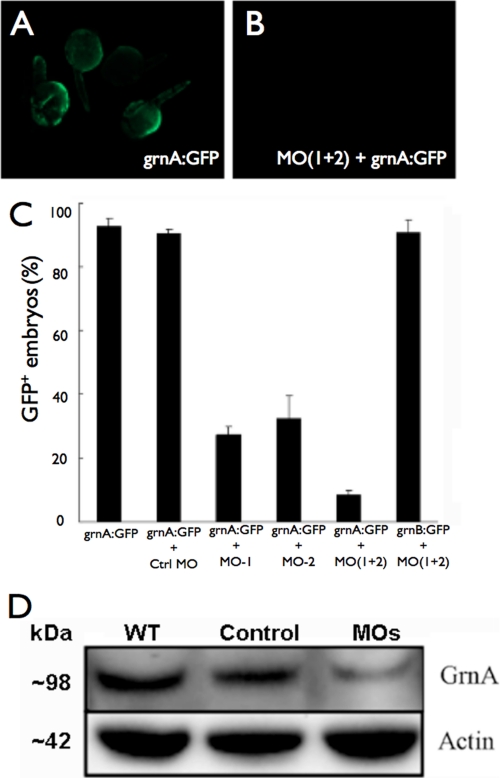
To study the genetic requirement of GrnA in embryonic liver development, we designed two grnA-specific MOs for GrnA knockdown, MO1 and MO2, which targeted two adjacent sequences in the 5′-untranslated region of the grnA coding sequence. A version of MO1 that contained five mismatched mutations was used for the control injections. The MO knockdown efficiencies were examined by assessing the CMV promoter-driven expression of the GFP-tagged grnA targeting sequence (grnA:GFP) or the grnB targeting sequence (grnB:GFP) following MO injection. An increase in mosaic GFP expression was observed after microinjection of the grnA:GFP plasmid (100 pg/embryo) into zebrafish embryos (Fig. 1A). A co-injection of grnA:GFP with either of the antisense MOs (0.25 ng) decreased GFP fluorescence in the embryos at 24 hpf (Fig. 1B); however, a control MO injection failed to block the GFP expression (Fig. 1C). A co-administration of the grnA:GFP vector with a 0.25-ng mixture of MO1 and MO2 (MOs) led to a much stronger inhibition of GFP expression compared with either antisense MO alone. In addition, the expression of grnB:GFP was not inhibited by MOs (Fig. 1C), which suggested that the grnA MO had a high specificity and no off-target effects. Because administration of the 0.25 ng mixture of MOs caused the greatest GFP suppression, we used this treatment for the subsequent experiments. Next, we measured the expression of the GrnA protein following MO treatment by Western blotting. We found that the expression of GrnA was suppressed by MO treatment at 4 dpf compared with the wild-type mice and the control MO treatments (Fig. 1D). These results demonstrated that the MOs specifically and efficiently knocked down GrnA expression.
FIGURE 1.
Antisense MOs specifically and efficiently knock down GrnA in vivo. A, microinjection of the grnA:GFP validation vector led mosaic GFP expression at 24 hpf. B, compared with injection of the grnA:GFP vector alone, co-injection of grnA:GFP with MOs decreased GFP expression. C, the administration of a mixture of MO1 and MO2 showed the strongest inhibition of GFP expression, whereas the expression of grnB:GFP was not affected by the MO treatments. D, the expression levels of GrnA in whole embryos were significantly suppressed on day 4 after MO administration. Actin expression was evaluated as a loading control. Error bars indicate S.D.
Knockdown of GrnA Confers a Small Liver Phenotype
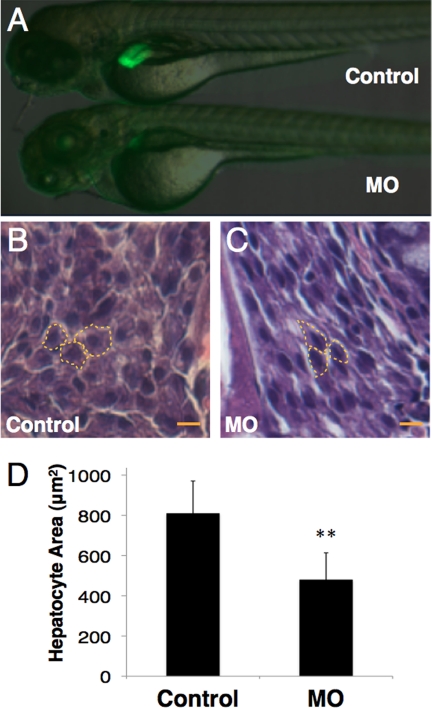
To study the role of grnA in liver development, 0.25 ng of MOs were injected into Tg(fabp10:EGFP) zebrafish. This procedure has been shown to result in the liver-specific expression of enhanced green fluorescent protein (EGFP) from 36 hpf (24). The control and mock-injected Tg(fabp10:EGFP) zebrafish embryos expressed intact EGFP in the liver at 4 dpf, whereas the grnA morphants exhibited a significant decrease in EGFP expression (Fig. 2A, 69.3%, n = 300). A histological analysis was performed to assess the hepatocyte size in grnA morphants. The cell size was determined by measuring the area of a single hepatocyte using MetaMorph software (version 6.1). The MO administration decreased the mean hepatocyte area compared with that measured in controls (810.6 ± 160 μm2 in controls versus 480 ± 133 in grnA morphants based on 10 randomly selected hepatocytes at 4 dpf; n = 3; Fig. 2, B and D). The smaller liver size was quantified by measuring the fluorescence intensity in three-dimensional confocal images. At 4 dpf, the liver volume in the control MO-injected Tg(fabp10:EGFP) embryos was 6.8 ± 0.2 × 10⁻³ mm3 (n = 30), and the liver size in the grnA morphants was reduced to 22% of that determined in the controls (1.5 ± 0.3 × 10⁻³ mm3, n = 30, Table 1). To further characterize the smaller liver according to the number of cells, we examined the ratio of the GFP-expressing liver cells to the cell numbers present in the whole embryo via flow cytometry. This liver-over-body ratio in the grnA morphants was 0.37 times that determined in the control group (3.8 ± 0.7 in the control group versus 1.4 ± 0.6 in grnA morphants based on 20 embryos at 4 dpf; n = 3, Table 1). These findings demonstrate that grnA morphants have a small liver phenotype.
FIGURE 2.
Liver morphology of 4-dpf grnA morphants. A, liver morphology at 4 dpf. Compared with fish that were injected with a MO containing mutations in five base pairs, the EGFP expression of Tg(fabp10:EGFP) zebrafish faded after MO (0.25 ng/embryo) administration. B and C, hematoxylin and eosin stained hepatocyte sections from grnA morphants. The cell size was determined by measuring the area of a single hepatocyte (dotted line). MO administration decreased the mean hepatocyte area as compared with the controls (n = 3). Scale bars, 25 μm. **, p < 0.01, t test. Error bars indicate S.D.
TABLE 1.
Morphant phenotype characterization at 4 days post-fertilization
Data are presented as the means ± S.E.
| Liver volume | Body length | Liver/bodya | |
|---|---|---|---|
| 10−3mm3 | mm | % | |
| Control | 6.8 ± 0.2 | 4.1 ± 0.1 | 3.8 ± 0.7 |
| MO | 1.5 ± 0.3 | 4.0 ± 0.2 | 1.4 ± 0.6 |
a The ratio of GFP-expressing cells to the whole body cell number is shown.
GrnA Is Crucial for Liver Morphogenesis
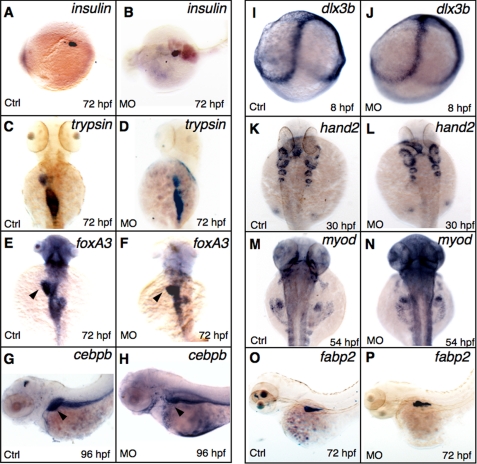
Established markers were applied to understand the developmental defects caused by GrnA knockdown. To examine the endoderm-derived tissue in the grnA morphants, insulin, a marker of islet, revealed a similar pattern in the controls and the grnA morphants at 72 hpf (Fig. 3, A–B, 93%, n = 30). The expression pattern of trypsin (an exocrine pancreas marker) was also similar in the controls and the grnA morphants; however, a slightly reduced size was observed in the GrnA knockdown embryos (Fig. 3, C–D, 83%, n = 30). We further examined liver development using the panendodermal markers forkhead box A3 (foxA3) and CCAAT/enhancer binding protein beta (cebpb), which are expressed in endodermal digestive organs. Interestingly, the liver size was reduced in the grnA morphants at 72 and 96 hpf, whereas the intestine and pancreas were less affected (Fig. 3, E and F, 76%, n = 25; Fig. 3, G and H, 70%, n = 30, respectively). Without causing a widespread developmental defect, using the intestinal marker fatty acid binding protein 2 (fabp2), we discovered similar intestinal patterns in the controls and MO-treated embryos at 72 hpf (Fig. 3, O and P, 90%, n = 30). In addition, the expression pattern of the ectoderm marker distal-less homeobox gene 3b (dlx3b) was indistinguishable between the controls and grnA knockdown embryos at 8 hpf (Fig. 3, I and J, n = 20). Two mesodermal genes, heart and neural crest derivatives expressed transcript 2 (hand2) and myogenic differentiation 1 (myod), displayed similar expression levels in grnA morphants at 30 and 54 hpf, respectively (Fig. 3, K–L, n = 25; Fig. 3, M and N, n = 25). Our results demonstrate that GrnA plays a crucial role in liver morphogenesis.
FIGURE 3.
Whole-mount in situ hybridization of GrnA knockdown embryos. Expression patterns of the marker genes insulin (A and B), trypsin (C and D), fabp2 (O and P), and fox3A at 72 hpf, cebpb at 96 hpf (E–H), dlx3b at 8 hpf (I and J), myod at 54 hpf, and hand2 at 30 hpf (K–N), were examined using WISH in the controls (Ctrl) and grnA morphants. C–F and K–N, dorsal views, anterior up; A, B, G, H O, and P, lateral views, anterior left).
GrnA Is Required for Hepatic Outgrowth but Not for Hepatoblast Specification
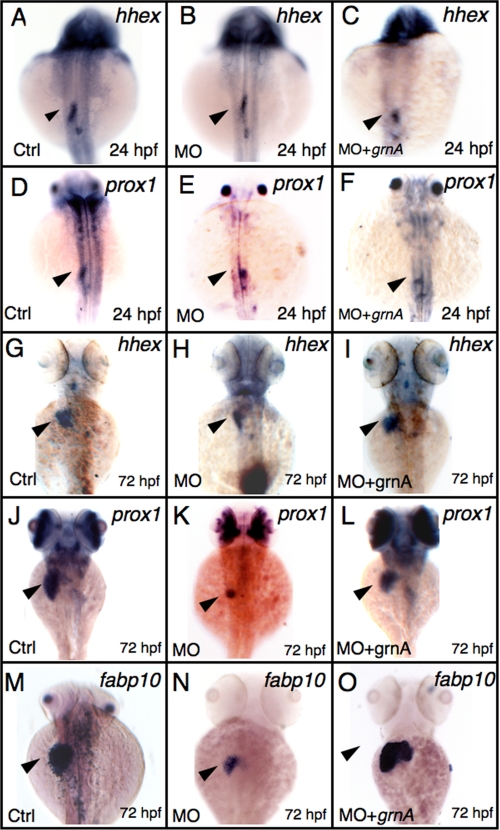
To determine the stages that were affected by grnA knockdown during liver morphogenesis, we examined liver developmental markers in grnA morphants. Using the specification markers hematopoietically expressed homeobox (hhex) and prospero-related homeobox 1 (prox1), which are expressed in definitive hepatoblasts (25), the knockdown of GrnA resulted in a normal expression pattern of both hhex and prox1 at 24 hpf (Fig. 4B, 85%, n = 20 and Fig. 4E, 75%, n = 20). However, at the later stage, when the liver size had increased moderately, reduced levels of hhex and prox1 expression were observed in the grnA morphants at 72 hpf (Fig. 4H, 68%, n = 25 and Fig. 4K, 57%, n = 30). The decrease in liver size was restored using a co-injection of grnA mRNA (0.25 ng/embryo) with MOs (Fig. 4I, 88%, n = 25 and Fig. 4L, 80%, n = 30). Furthermore, we applied the fatty acid binding protein 10 (fabp10) marker to examine liver function; fabp10 expression was markedly decreased in 72-hpf grnA morphants (Fig. 4N, 83%, n = 30), which suggests an impaired hepatocyte maturation in these grnA morphants. Additionally, the decrease of fabp10 expression was largely recovered in the grnA mRNA rescue experiment (Fig. 4O, 76%, n = 100). In conclusion, our results indicate that the knockdown of GrnA suppresses hepatic outgrowth and maturation but not liver specification.
FIGURE 4.
Knockdown of GrnA blocks hepatic outgrowth but not specification. The expression levels of hhex (A–C) and prox1 (D–F) were examined using WISH in the controls and grnA morphants at 24 hpf (dorsal views, anterior up). The controls and grnA morphants were examined using WISH with hhex and prox1 (G–I and J–L) and fabp10 (M–O; maturation marker) at 72 hpf (dorsal views, anterior up). Co-injection of grnA mRNA (0.25 ng/embryo) and MO into one-cell embryos restored the deficient expression of the marker genes (I, L, and O). The arrowhead indicates the developing liver (A–C). Ctrl, control.
Knockdown of GrnA Impairs Liver Cell Proliferation and Enhances Apoptosis
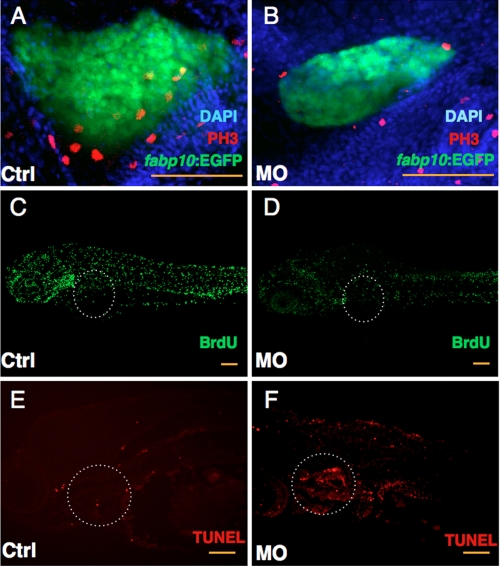
We performed whole-mount immunohistochemistry to examine the terminal fate of the GrnA-deficient hepatocytes. Using an antibody against PH3, a marker of cell proliferation, the PH3-positive hepatocytes exhibited a 6.5-fold reduction in the 4-dpf grnA morphants (Fig. 5, A and B, 10.4 cells in the controls versus 1.6 in the grnA morphants based on three sections per embryo; n = 5), whereas in the same sections, only a 3.3-fold decrease was observed in the number of PH3-positive cells in the peripheral tissues (Fig. 5, A and B, 32.8 cells in the controls versus 9.9 in the grnA morphants based on three sections per embryo; n = 5). Furthermore, an analysis using the antibody against PCNA and BrdU demonstrated similar results. The number of PCNA-positive hepatocytes was decreased in the grnA knockdown morphants compared with the control embryos at 4 dpf, as measured by the mean number of PCNA-stained cells (supplemental Fig. S1, A–C, 36.2 cells in the controls versus 19.6 in the grnA morphants based on three sections per embryo; n = 3). BrdU is specifically incorporated into DNA during S-phase. The liver fraction of BrdU-labeled cells in the grnA morphants was greatly reduced compared with the controls (Fig. 5, B and C, n = 5). Next, we examined the apoptotic events after GrnA knockdown using the TUNEL assay. Compared with the controls, DNA strand breaks that occur during apoptosis were detected in the livers of the grnA morphants at 4 dpf (Fig. 5, E and F, n = 5). Consequently, the GrnA-deficient hepatocytes were impaired with respect to their proliferation abilities and showed an increased frequency of programmed cell death.
FIGURE 5.
Knockdown of GrnA impairs liver cell proliferation and enhances apoptosis. Control (Ctrl) and grnA MO-injected embryos were examined using the anti-PH3 antibody, BrdU incorporation, and a TUNEL assay at 4 dpf. DAPI was used to stain the cell nuclei. Fewer PH3-positive cells were detected in MO-injected Tg (fabp10:EGFP) embryos compared with control MO-treated embryos at 4 dpf (A and B). BrdU incorporation was suppressed in the liver in grnA morphants compared with controls (C and D). TUNEL staining of control MO-injected embryos (E) and knockdown embryos (F). A dotted line circles the liver. Scale bars, 100 μm.
MET Is Involved in GrnA-regulated Liver Growth
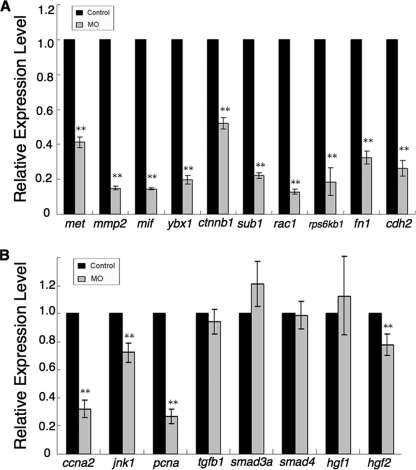
To explore the changes in GrnA knockdown-induced gene expression during liver outgrowth, the mRNA expression profiles of the controls and grnA MO-injected embryos were compared at 72 hpf using a zebrafish 14K oligonucleotide microarray. According to the gene set enrichment analysis, the differentially expressed genes were found to be associated with cell cycle regulation, DNA replication, ubiquitin-dependent protein degradation, apoptosis regulation, transcription and translation control, chromatin remodeling, and focal adhesion regulation (supplemental Table S1). To determine the major regulatory signaling pathway that was affected by grnA knockdown, the microarray data were processed using Pathway Studio analysis software (version 7.0). The results indicated that a number of MET expression-related genes, including mmp2 (26), mif (27), ybx1 (28), ctnnb1 (29), sub1 (30), rac1 (31), rps6kb1(32), fn1 (33), and cdh2 (34), were down-regulated in the context of GrnA deficiency. MET, which encodes a receptor tyrosine kinase, is known to be critical for liver size in mice (5) and zebrafish (35). The suppressed expression of MET-related genes was further confirmed using quantitative RT-PCR in 72-hpf grnA morphants (Fig. 6A). We also examined the expression levels of genes that are involved in cell proliferation. The expression levels of ccna2, jnk1, and the PCNA gene were decreased in the 72-hpf grnA morphants. Interestingly, the expression levels of TGFβ signaling factors (tgfb1, smad3a, and smad4) and hepatocyte growth factors (hgf1 and hgf2) were influenced very little by GrnA knockdown (Fig. 6B).
FIGURE 6.
GrnA deficiency decreases the expression of MET-related genes. Transcriptional expression levels of MET signaling-related genes (met, mmp2, mif, ybx1, ctnnb1, sub1, rac1, rps6kb1, fn1, and cdh2) (A) and other genes involved in liver growth (B) were examined using quantitative RT-PCR in 72-hpf controls and grnA morphants. The expression level of ef1a served as an internal control. The experiment was performed in triplicate; error bars indicate S.D. **, p < 0.01, t test.
GrnA Regulates Hepatic Outgrowth via MET
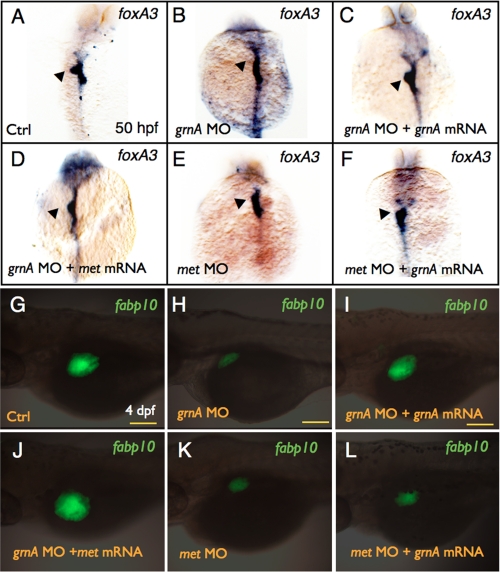
We conducted mRNA rescue experiments to verify whether GrnA regulated hepatic outgrowth via MET signaling. A significant reduction in liver size was observed in the 96-hpf grnA morphants (Fig. 2A and Fig. 7H, 70%, n = 300). In addition to co-injecting grnA mRNA (Fig. 7I, 76%, n = 300), co-injections met mRNA with grnA MOs in Tg(fabp10:EGFP) embryos restored the normal liver size (Fig. 7J, 51%, n = 300). Furthermore, we knocked down MET expression by injecting a validated met MO (19) that led to an impaired liver size at 4 dpf (Fig. 7K, 40.7%, n = 300). However, a co-injection of grnA mRNA (0.25 ng/embryo) with met MO still led to a small liver size (Fig. 7L, 68%, n = 300). Similar results were obtained for the foxA3 expression at 50 hpf. The co-injection of met mRNA with grnA MO restored the loss of foxA3 expression in the grnA morphants (Fig. 7D, 60%, n = 20). In contrast, a co-injection of grnA mRNA with met MO did not compensate for the impaired foxA3 expression in the met morphants (Fig. 7F, 80%, n = 20).
FIGURE 7.
Effect of grnA and met on liver formation. Whole-mount in situ hybridization of foxA3 expression in 50-hpf embryos injected with control MO (A), grnA MO (B), grnA MO with grnA (C) or met (D) mRNA, met MO (E), and met MO with grnA mRNA (F). EGFP expression in 4-dpf Tg(fabp10:EGFP) embryos that were injected with control MO (G), grnA MO (H), grnA MO with grnA (I) or met (J) mRNA, met MO (K), and met MO with grnA mRNA (L) (dorsal views, anterior up). The liver is indicated by the arrowhead. Ctrl, control. Scale bars, 100 μm.
GrnA Positively Modulates Hepatic met Expression
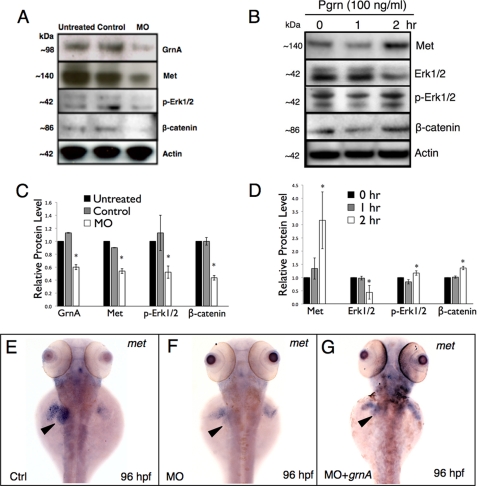
To examine the regulation between GrnA and MET signaling in liver cells, we applied grnA MOs (10 μm) in ZFL cells (zebrafish liver cell line) to assess the protein expression of MET signaling following grnA knockdown. At 48 h after the administration of MOs, the protein expression levels of GrnA were significantly reduced 0.6-fold compared with those determined in untreated and control MO-treated cells, as shown using Western blotting (Fig. 8A and C, GrnA/actin ratio, n = 3). Following grnA knockdown, the protein expression of MET and the downstream phosphorylated ERK1/2 and β-catenin were significantly decreased in MO-treated cells (Fig. 8, A and C, n = 3). In contrast, treatment with recombinant human PGRN (100 ng/ml) increased MET, phosphorylated ERK1/2, and β-catenin protein expression at 2 h post-PGRN administration (Fig. 8, B and D, n = 3). These results suggest that PGRN positively regulates MET signaling in zebrafish liver cells. In addition to the in vitro analyses, we further confirmed this regulation in zebrafish embryos via WISH. We found that met expression was decreased in the liver region of the grnA morphants (Fig. 8F, 57%, n = 30). In addition, the hepatic met expression was restored by a co-injection of grnA mRNA with MOs at 96 hpf (Fig. 8G, 87%, n = 30), which indicates that GrnA positively modulates hepatic met expression in vivo.
FIGURE 8.
GrnA positively modulates hepatic met expression in vitro and in vivo. Protein levels of GrnA, MET, ERK1/2, phosphorylated ERK1/2, β-catenin, and actin were examined by Western blot analysis in ZFL cells at 48 h post-grnA knockdown (A) and recombinant human PGRN treatment (B; 100 ng/ml). The relative GrnA, MET, ERK1/2, and β-catenin protein levels in each treatment were quantified as shown in the lower panel (C and D; normalized to the actin level). The expression of met in the liver region (E–G; arrowhead) was determined using WISH in controls, grnA morphants, and grnA-rescued embryos at 96 hpf. Ctrl, control. *, p < 0.05, t test. Error bars indicate S.D.
DISCUSSION
The dysregulation of embryonic growth factors, receptors, and their downstream signaling components in adulthood has been shown to promote HCC proliferation and invasiveness (12). Although PGRN has been shown to be involved in HCC progression, the functional role of PGRN in embryonic live organogenesis remains unknown. In the present study, we addressed two major issues. First, we assessed whether PGRN is involved in embryonic liver development. Second, we investigated the molecular mechanisms of PGRN in the regulation of liver growth. To study the genetic requirement of PGRN in embryonic liver development, we inhibited PGRN by antisense morpholino knockdown of the PGRN orthologue grnA in zebrafish. The Tg(fabp10:EGFP) model showed that GrnA knockdown led to a reduced liver size, which was verified using confocal imaging and immunohistochemistry (Fig. 2 and Table 1). This reduction suggests that GrnA is required for liver morphogenesis in zebrafish. An important issue is whether GrnA is specific for liver morphogenesis. PGRN is maternally deposited and then expressed zygotically in a number of epithelial cells, including the skin, the gastrointestinal tract, and immune cells (36). In addition to the liver, our analysis revealed that GrnA affected the development of several tissues, including the pancreas and blood cells (Fig. 3 and data not shown). It is possible that grnA is widely expressed in many tissues in the zebrafish embryo (14); therefore, its expression is required for the development of various tissues. However, during embryonic development, the liver is much more sensitive to a GrnA deficiency compared with other endoderm, mesoderm, and ectoderm-derived tissues (Fig. 3). This sensitivity indicates that GrnA plays a crucial role in liver organogenesis. Furthermore, we applied established WISH markers to frame the developmental stages that were affected by grnA knockdown and that led to impaired liver morphogenesis. At 24 hpf, the expression of hhex and prox1 led to normal liver bud formation, which suggested that specification was not disrupted in the grnA morphants. In contrast, our WISH results showed that hepatic outgrowth had been attenuated early with respect to the expression of ceruloplasmin from 40 hpf (data not shown) and foxA3 at 50 hpf (Fig. 7B). The expression of hhex, prox1, fabp10, foxA3, and cebpb in 72- and 96-hpf grnA morphants might have also led to the defective hepatic outgrowth observed in grnA morphants. Therefore, we conclude that GrnA is required for hepatic outgrowth rather than for specification in zebrafish. Numerous genes have been identified that are required for outgrowth, and it has been demonstrated that a loss of the expression of these genes decreases hepatic proliferation and leads to apoptosis (37–40). PGRN has been reported to be a growth factor that stimulates cell proliferation (41, 42) and decreases apoptosis (43–45). The present work is the first to show that PGRN is involved in embryonic liver growth regulation. A loss of GrnA expression led to impaired proliferation and enhanced apoptosis in zebrafish embryos (Fig. 5 and supplemental Fig. S1). Similarly, the reduction of PGRN protein has been shown to suppress HCC proliferation in a nude mouse xenotransplantation model (10, 11), which suggests a relevant regulatory mechanism of PGRN in HCC proliferation and embryonic liver growth. Besides, recent reports showed that the PGRN knock-out mice display behavioral abnormalities and dysregulated inflammation and neuropathology (46–48). In contrast to our results shown in 4 dpf grnA knockdown zebrafish (Table 1), the ratio of liver weight over whole body weight is normal in the 2-month-old PGRN knock-out mice (47). However, the detail examination remains to be seen whether the liver development is impaired in these animals. To elucidate the molecular mechanisms involved in GrnA-regulated liver growth, we performed a cDNA microarray analysis, which showed that GrnA modulated the expression of met and other related genes. During embryogenesis, Met and its ligand, the scatter factor/hepatocyte growth factor, play crucial roles in regulating liver development (49), nerve outgrowth (50), and myoblast migration from somites to the limbs (5, 35). In addition, dysregulation of the MET signaling pathway promotes invasive growth and initiates metastasis during tumorigenesis (51, 52). The transcriptional induction of met has been determined in human HCC (53, 54), whereas little is known concerning its transcriptional regulation, except for the roles of ETS (55), hypoxia-inducible factor-1a (56), yb1 (28), and β-catenin (57). The met gene is a downstream target of β-catenin (57), and MET is also known to induce β-catenin phosphorylation and accumulation (29). In our model, GrnA-regulated mRNA expression of yb1, ctnnb1, and other MET related genes were confirmed using quantitative RT-PCR (Fig. 6A). GrnA also regulated met and β-catenin expression by Western blotting and WISH analyses (Fig. 8). Furthermore, β-catenin belongs to the Wnt signaling pathway and has been shown to regulate liver growth (58), which suggests that Wnt signaling might also be of relevance and that extensive cellular pathways are affected by the knockdown of GrnA. Hence, it may explain why the met mRNA could not fully rescue the grnA morphant phenotype (Fig. 7, D and J). In rescue experiments, we found that a co-injection of met mRNA with grnA MO could restore the impaired liver growth caused by grnA MO administration; in contrast, grnA mRNA did not rescue the liver size resulting from the knockdown of MET (Fig. 7, F and L). Our results indicate that GrnA might serve as an upstream regulator of MET to regulate embryonic liver growth.
Taken together, we demonstrate that zebrafish grnA is required for embryonic hepatic outgrowth, and that GrnA acts, at least partially, through MET signaling to regulate embryonic liver growth. Additionally, we provide a model that could be used to study both genetic and functional factors that are involved in embryonic liver morphogenesis. Because the PGRN receptor and downstream effectors have not yet been identified (59, 60), our work proposes a possible crosstalk between PGRN and MET signaling and suggests new directions for future studies.
Supplementary Material
Acknowledgments
We thank Chuang-Yu Lin and Shin-Yi Du for technical support. We also thank Dr. Sheng-Ping L. Hwang for providing the foxA3 construct and the PH3 antibody.
This work was supported by National Science Council 97-2317-B-001-002 Grant (to J.-L. W.) and National Science Council 97-2313-B-241-001-MY3 Grant (to M. H.-C. C. and J.-L. W.) from the National Science Council of Taiwan.

The on-line version of this article (available at http://www.jbc.org) contains supplemental Table S1 and Fig. S1.
- PGRN
- progranulin
- HCC
- hepatocellular carcinoma
- hpf
- hours post-fertilization
- MO
- morpholino
- WISH
- whole-mount in situ hybridization
- PH3
- phosphohistone H3
- PCNA
- proliferating cell nuclear antigen
- dpf
- days post-fertilization
- EGFP
- enhanced green fluorescent protein.
REFERENCES
- 1.Blouin A., Bolender R. P., Weibel E. R. (1977) J. Cell Biol. 72, 441–455 [DOI] [PMC free article] [PubMed] [Google Scholar]
- 2.Duncan S. A. (2003) Mech. Dev. 120, 19–33 [DOI] [PubMed] [Google Scholar]
- 3.Zaret K. S. (2002) Nat. Rev. Genet. 3, 499–512 [DOI] [PubMed] [Google Scholar]
- 4.Birchmeier C., Birchmeier W., Gherardi E., Vande Woude G. F. (2003) Nat. Rev. Mol. Cell Biol. 4, 915–925 [DOI] [PubMed] [Google Scholar]
- 5.Bladt F., Riethmacher D., Isenmann S., Aguzzi A., Birchmeier C. (1995) Nature 376, 768–771 [DOI] [PubMed] [Google Scholar]
- 6.Palmiter R. D., Norstedt G., Gelinas R. E., Hammer R. E., Brinster R. L. (1983) Science 222, 809–814 [DOI] [PubMed] [Google Scholar]
- 7.Chen M. H., Li Y. H., Chang Y., Hu S. Y., Gong H. Y., Lin G. H., Chen T. T., Wu J. L. (2007) Gen. Comp. Endocrinol. 150, 212–218 [DOI] [PubMed] [Google Scholar]
- 8.He Z., Bateman A. (2003) J. Mol. Med. 81, 600–612 [DOI] [PubMed] [Google Scholar]
- 9.Ong C. H., Bateman A. (2003) Histol. Histopathol. 18, 1275–1288 [DOI] [PubMed] [Google Scholar]
- 10.Cheung S. T., Wong S. Y., Leung K. L., Chen X., So S., Ng I. O., Fan S. T. (2004) Clin. Cancer Res. 10, 7629–7636 [DOI] [PubMed] [Google Scholar]
- 11.Ho J. C., Ip Y. C., Cheung S. T., Lee Y. T., Chan K. F., Wong S. Y., Fan S. T. (2008) Hepatology 47, 1524–1532 [DOI] [PubMed] [Google Scholar]
- 12.Breuhahn K., Longerich T., Schirmacher P. (2006) Oncogene 25, 3787–3800 [DOI] [PubMed] [Google Scholar]
- 13.Chu J., Sadler K. C. (2009) Hepatology 50, 1656–1663 [DOI] [PMC free article] [PubMed] [Google Scholar]
- 14.Cadieux B., Chitramuthu B. P., Baranowski D., Bennett H. P. (2005) BMC Genomics 6, 156. [DOI] [PMC free article] [PubMed] [Google Scholar]
- 15.Kimmel C. B., Ballard W. W., Kimmel S. R., Ullmann B., Schilling T. F. (1995) Dev. Dyn. 203, 253–310 [DOI] [PubMed] [Google Scholar]
- 16.Tran N. L., McDonough W. S., Savitch B. A., Sawyer T. F., Winkles J. A., Berens M. E. (2005) J. Biol. Chem. 280, 3483–3492 [DOI] [PubMed] [Google Scholar]
- 17.Hu M. C., Gong H. Y., Lin G. H., Hu S. Y., Chen M. H., Huang S. J., Liao C. F., Wu J. L. (2007) Biochem. Biophys. Res. Commun. 359, 778–783 [DOI] [PubMed] [Google Scholar]
- 18.Nikopoulos G. N., Adams T. L., Adams D., Oxburgh L., Prudovsky I., Verdi J. M. (2008) BioTechniques 44, 547–549 [DOI] [PMC free article] [PubMed] [Google Scholar]
- 19.Haines L., Neyt C., Gautier P., Keenan D. G., Bryson-Richardson R. J., Hollway G. E., Cole N. J., Currie P. D. (2004) Development 131, 4857–4869 [DOI] [PubMed] [Google Scholar]
- 20.van de Wetering M., Cavallo R., Dooijes D., van Beest M., van Es J., Loureiro J., Ypma A., Hursh D., Jones T., Bejsovec A., Peifer M., Mortin M., Clevers H. (1997) Cell 88, 789–799 [DOI] [PubMed] [Google Scholar]
- 21.Shepard J. L., Stern H. M., Pfaff K. L., Amatruda J. F. (2004) Methods Cell Biol. 76, 109–125 [DOI] [PubMed] [Google Scholar]
- 22.Alexander J., Rothenberg M., Henry G. L., Stainier D. Y. (1999) Dev. Biol. 215, 343–357 [DOI] [PubMed] [Google Scholar]
- 23.Chou M. Y., Hsiao C. D., Chen S. C., Chen I. W., Liu S. T., Hwang P. P. (2008) J. Exp. Biol. 211, 3077–3084 [DOI] [PubMed] [Google Scholar]
- 24.Her G. M., Yeh Y. H., Wu J. L. (2003) Dev. Dyn. 227, 347–356 [DOI] [PubMed] [Google Scholar]
- 25.Ober E. A., Verkade H., Field H. A., Stainier D. Y. (2006) Nature 442, 688–691 [DOI] [PubMed] [Google Scholar]
- 26.Miyata Y., Sagara Y., Kanda S., Hayashi T., Kanetake H. (2009) Hum. Pathol. 40, 496–504 [DOI] [PubMed] [Google Scholar]
- 27.Ren Y., Chan H. M., Fan J., Xie Y., Chen Y. X., Li W., Jiang G. P., Liu Q., Meinhardt A., Tam P. K. (2006) Oncogene 25, 3501–3508 [DOI] [PubMed] [Google Scholar]
- 28.Finkbeiner M. R., Astanehe A., To K., Fotovati A., Davies A. H., Zhao Y., Jiang H., Stratford A. L., Shadeo A., Boccaccio C., Comoglio P., Mertens P. R., Eirew P., Raouf A., Eaves C. J., Dunn S. E. (2009) Oncogene 28, 1421–1431 [DOI] [PubMed] [Google Scholar]
- 29.Danilkovitch-Miagkova A., Miagkov A., Skeel A., Nakaigawa N., Zbar B., Leonard E. J. (2001) Mol. Cell. Biol. 21, 5857–5868 [DOI] [PMC free article] [PubMed] [Google Scholar]
- 30.Campbell D. B., Li C., Sutcliffe J. S., Persico A. M., Levitt P. (2008) Autism Res. 1, 159–168 [DOI] [PMC free article] [PubMed] [Google Scholar]
- 31.Watanabe T., Tsuda M., Makino Y., Ichihara S., Sawa H., Minami A., Mochizuki N., Nagashima K., Tanaka S. (2006) Mol. Cancer Res. 4, 499–510 [DOI] [PubMed] [Google Scholar]
- 32.Grisendi S., Chambraud B., Gout I., Comoglio P. M., Crepaldi T. (2001) J. Biol. Chem. 276, 46632–46638 [DOI] [PubMed] [Google Scholar]
- 33.Liu Y., Centracchio J. N., Lin L., Sun A. M., Dworkin L. D. (1998) Exp. Cell Res. 242, 174–185 [DOI] [PubMed] [Google Scholar]
- 34.Nakaigawa N., Yao M., Baba M., Kato S., Kishida T., Hattori K., Nagashima Y., Kubota Y. (2006) Cancer Res. 66, 3699–3705 [DOI] [PubMed] [Google Scholar]
- 35.Latimer A. J., Jessen J. R. (2008) Dev. Dyn. 237, 3904–3915 [DOI] [PubMed] [Google Scholar]
- 36.Daniel R., Daniels E., He Z., Bateman A. (2003) Dev. Dyn. 227, 593–599 [DOI] [PubMed] [Google Scholar]
- 37.Bonnard M., Mirtsos C., Suzuki S., Graham K., Huang J., Ng M., Itié A., Wakeham A., Shahinian A., Henzel W. J., Elia A. J., Shillinglaw W., Mak T. W., Cao Z., Yeh W. C. (2000) EMBO J. 19, 4976–4985 [DOI] [PMC free article] [PubMed] [Google Scholar]
- 38.Rudolph D., Yeh W. C., Wakeham A., Rudolph B., Nallainathan D., Potter J., Elia A. J., Mak T. W. (2000) Genes Dev. 14, 854–862 [PMC free article] [PubMed] [Google Scholar]
- 39.Huang H., Ruan H., Aw M. Y., Hussain A., Guo L., Gao C., Qian F., Leung T., Song H., Kimelman D., Wen Z., Peng J. (2008) Development 135, 3209–3218 [DOI] [PMC free article] [PubMed] [Google Scholar]
- 40.Sadler K. C., Krahn K. N., Gaur N. A., Ukomadu C. (2007) Proc. Natl. Acad. Sci. U.S.A. 104, 1570–1575 [DOI] [PMC free article] [PubMed] [Google Scholar]
- 41.He Z., Bateman A. (1999) Cancer Res. 59, 3222–3229 [PubMed] [Google Scholar]
- 42.He Z., Ismail A., Kriazhev L., Sadvakassova G., Bateman A. (2002) Cancer Res. 62, 5590–5596 [PubMed] [Google Scholar]
- 43.Pizarro G. O., Zhou X. C., Koch A., Gharib M., Raval S., Bible K., Jones M. B. (2007) Int. J. Cancer 120, 2339–2343 [DOI] [PubMed] [Google Scholar]
- 44.Kim W. E., Serrero G. (2006) Clin. Cancer Res. 12, 4192–4199 [DOI] [PubMed] [Google Scholar]
- 45.Tangkeangsirisin W., Hayashi J., Serrero G. (2004) Cancer Res. 64, 1737–1743 [DOI] [PubMed] [Google Scholar]
- 46.Kayasuga Y., Chiba S., Suzuki M., Kikusui T., Matsuwaki T., Yamanouchi K., Kotaki H., Horai R., Iwakura Y., Nishihara M. (2007) Behav. Brain Res. 185, 110–118 [DOI] [PubMed] [Google Scholar]
- 47.Yin F., Banerjee R., Thomas B., Zhou P., Qian L., Jia T., Ma X., Ma Y., Iadecola C., Beal M. F., Nathan C., Ding A. (2010) J. Exp. Med. 207, 117–128 [DOI] [PMC free article] [PubMed] [Google Scholar]
- 48.Yin F., Dumont M., Banerjee R., Ma Y., Li H., Lin M. T., Beal M. F., Nathan C., Thomas B., Ding A. (2010) FASEB J., in press [DOI] [PMC free article] [PubMed] [Google Scholar]
- 49.Schmidt C., Bladt F., Goedecke S., Brinkmann V., Zschiesche W., Sharpe M., Gherardi E., Birchmeier C. (1995) Nature 373, 699–702 [DOI] [PubMed] [Google Scholar]
- 50.Maina F., Panté G., Helmbacher F., Andres R., Porthin A., Davies A. M., Ponzetto C., Klein R. (2001) Mol. Cell 7, 1293–1306 [DOI] [PubMed] [Google Scholar]
- 51.Suzuki K., Hayashi N., Yamada Y., Yoshihara H., Miyamoto Y., Ito Y., Ito T., Katayama K., Sasaki Y., Ito A., et al. (1994) Hepatology 20, 1231–1236 [PubMed] [Google Scholar]
- 52.Wang R., Ferrell L. D., Faouzi S., Maher J. J., Bishop J. M. (2001) J. Cell Biol. 153, 1023–1034 [DOI] [PMC free article] [PubMed] [Google Scholar]
- 53.Ueki T., Fujimoto J., Suzuki T., Yamamoto H., Okamoto E. (1997) Hepatology 25, 619–623 [DOI] [PubMed] [Google Scholar]
- 54.Tavian D., De Petro G., Benetti A., Portolani N., Giulini S. M., Barlati S. (2000) Int. J. Cancer 87, 644–649 [PubMed] [Google Scholar]
- 55.Gambarotta G., Boccaccio C., Giordano S., Andŏ M., Stella M. C., Comoglio P. M. (1996) Oncogene 13, 1911–1917 [PubMed] [Google Scholar]
- 56.Pennacchietti S., Michieli P., Galluzzo M., Mazzone M., Giordano S., Comoglio P. M. (2003) Cancer Cell 3, 347–361 [DOI] [PubMed] [Google Scholar]
- 57.Boon E. M., van der Neut R., van de Wetering M., Clevers H., Pals S. T. (2002) Cancer Res. 62, 5126–5128 [PubMed] [Google Scholar]
- 58.Apte U., Zeng G., Thompson M. D., Muller P., Micsenyi A., Cieply B., Kaestner K. H., Monga S. P. (2007) Am. J. Physiol. Gastrointest. Liver Physiol. 292, G1578–1585 [DOI] [PubMed] [Google Scholar]
- 59.Lai A. Z., Abella J. V., Park M. (2009) Trends Cell Biol. 19, 542–551 [DOI] [PubMed] [Google Scholar]
- 60.Xia X., Serrero G. (1998) Biochem. Biophys. Res. Commun. 245, 539–543 [DOI] [PubMed] [Google Scholar]
Associated Data
This section collects any data citations, data availability statements, or supplementary materials included in this article.


