

Abstract
The aryl hydrocarbon receptor (AHR) agonist 2,3,7,8-tetrachlorodibenzo-p-dioxin (TCDD) alters differentiation of B cells and suppresses antibody production. A combination of whole-genome, microarray-based chromatin immunoprecipitation (ChIP-on-chip), and time course gene expression microarray analysis was performed on the mouse B-cell line CH12.LX following exposure to lipopolysaccharide (LPS) or LPS and TCDD to identify the primary and downstream transcriptional elements of B-cell differentiation that are altered by the AHR. ChIP-on-chip analysis identified 1893 regions with a significant increase in AHR binding with TCDD treatment. Transcription factor binding site analysis on the ChIP-on-chip data showed enrichment in AHR response elements. Other transcription factors showed significant coenrichment with AHR response elements. When ChIP-on-chip regions were compared with gene expression changes at the early time points, 78 genes were identified as potential direct targets of the AHR. AHR binding and expression changes were confirmed for a subset of genes in primary mouse B cells. Network analysis examining connections between the 78 potential AHR target genes and three transcription factors known to regulate B-cell differentiation indicated multiple paths for potential regulation by the AHR. Enrichment analysis on the differentially expressed genes at each time point evaluated the downstream impact of AHR-regulated gene expression changes on B-cell–related processes. AHR-mediated impairment of B-cell differentiation occurred at multiple nodes of the B-cell differentiation network and potentially through multiple mechanisms including direct cis-acting effects on key regulators of B-cell differentiation, indirect regulation of B-cell differentiation–related pathways, and transcriptional coregulation of target genes by AHR and other transcription factors.
Keywords: 2,3,7,8-tetrachlorodibenzo-p-dioxin; B-cell differentiation, aryl-hydrocarbon receptor, chromatin immunoprecipitation, gene expression microarrays
INTRODUCTION
2,3,7,8-Tetrachlorodibenzo-p-dioxin (TCDD) and certain polychlorinated biphenyls and polychlorinated dibenzofurans, are environmental contaminants that posses long half-lives and impart a wide range of toxicological effects on mammalian systems. Among these toxicological effects, immune suppression is one of the earliest and most sensitive toxicological end points (Holsapple et al., 1991). Although TCDD affects multiple aspects of the immune system, cell-type fractionation reconstitution studies of heterogeneous leukocyte preparations have shown that B cells are the cellular target principally responsible for suppression of primary humoral immune responses (Dooley and Holsapple, 1988). Moreover, addition of TCDD directly to cultured naive spleen cells, purified naive splenic B cells, or B cell lines (e.g., CH12.LX cells) suppressed immunoglobulin (Ig) M responses, demonstrating that TCDD directly targets B cells (Holsapple et al., 1986; Morris et al., 1993; Sulentic et al., 1998). In addition, TCDD-mediated suppression of the IgM response, either in vivo or in vitro, requires activation of the aryl hydrocarbon receptor (AHR) (Sulentic et al., 1998; Vorderstrasse et al., 2001).
B-cell development begins in the fetal liver or in the adult bone marrow from pluripotent hematopoietic stem cells (Hardy and Hayakawa, 2001). The final stages of maturation of B cells occur in the spleen (Chung et al., 2003). Activation of B cells by antigens or polyclonal activators, such as lipopolysaccharide (LPS), results in clonal expansion and differentiation into memory cells or antibody secreting plasma cells that are the primary mediators of the humoral immune response.
The regulation of plasma cell differentiation follows a common biological paradigm, in which a phenotypic change is regulated through a cascading series of events that include critical transcriptional control points. In B cells, the early transcriptional regulators are contained within two reciprocal negative feedback loops. In an inactivated state, two key transcriptional repressors, B-cell lymphoma 6 (Bcl6) and paired box protein 5 (Pax5), are actively transcribed. Bcl6 and Pax5 both repress key genes involved in B cell to plasma cell differentiation, whereas Bcl6 also represses the transcription of an activator of B-cell differentiation, PR domain zinc finger protein 1 (Prdm1) (Lin et al., 2002; Shaffer et al., 2000). Activation of B cells via LPS or the B-cell receptor increases the expression of Prdm1 which then represses transcription of Bcl6 and Pax5 allowing differentiation to proceed (Shaffer et al., 2002). These three transcription factors, Prdm1, Bcl6, and Pax5, constitute an important control point in B-cell differentiation and ultimately regulate the secondary and tertiary waves of transcriptional events (Shaffer et al., 2002).
The AHR is a ligand-activated transcription factor and a member of the basic-helix-loop-helix/Per-Arnt-Sim superfamily. In its non–ligand-bound state, the AHR resides in the cytoplasm bound to a dimer of Hsp90, Aip, and Ptges3 (Petrulis and Perdew, 2002). Following ligand binding, the AHR dissociates from its chaperone proteins, translocates to the nucleus, and heterodimerizes with the aryl hydrocarbon receptor nuclear translocator (Arnt). The AHR/Arnt complex binds to xenobiotic response elements to activate transcription of target genes (Gu et al., 2000). In the context of B-cell function, activation of the AHR by TCDD has been shown to impair differentiation at multiple points. Previous studies have shown that AHR activation suppresses the activity of the activator protein (AP)-1 transcriptional complex which is an upstream activator of Prdm1 (Schneider et al., 2009). In addition, the AHR directly supresses IgH expression and indirectly supresses Igκ and IgJ expression leading to decreased assembly and secretion of the IgM complex (Sulentic et al., 1998, 2009; Yoo et al., 2004).
The objective of the present study was to characterize both the primary and downstream elements of the gene expression cascade involved in the suppression of B-cell activation and differentiation by TCDD. Chromatin immunoprecipitation (ChIP) was performed together with whole-genome tiling microarray analysis (ChIP-on-chip) to identify genomic regions showing AHR binding following ligand activation (Fig. 1). The ChIP-on-chip analysis was then integrated with time course gene expression studies to identify which genomic regions showing increased AHR binding resulted in direct alterations in expression as well as downstream changes in expression. The studies identified a number of direct transcriptional targets for the AHR and provided evidence for multiple pathways by which the AHR may affect B cell function.
FIG. 1.

Flow chart depicting the integration of the ChIP-on-chip and time course gene expression microarray analysis. The integrated analysis was used to identify candidate genes and cellular processes for direct and indirect regulation by the AHR in mouse B cells.
MATERIALS AND METHODS
Chemicals and reagents.
TCDD in dimethyl sulfoxide (DMSO) (purity 99.1%) was purchased from AccuStandard, Inc. (New Haven, CT). DMSO and LPS (Salmonella typhosa, Catalog no. L4391-1MG) were purchased from Sigma-Aldrich (St Louis, MO). The AHR antibody for the ChIP-on-chip studies was purchased from Biomol (Catalog no. SA210-0100; Plymouth Meeting, PA).
Cell culture.
The CH12.LX B-cell line, derived from the murine CH12 B-cell lymphoma, has been previously characterized by Bishop and Haughton (Bishop and Haughton, 1986) and was a generous gift from Dr Geoffrey Haughton (University of North Carolina). CH12.LX cells were grown in Advanced RPMI medium 1640 (Invitrogen, Carlsbad, CA) supplemented with 10% heat-inactivated bovine calf serum (Invitrogen), 13.5mM HEPES, 100 U/ml penicillin, 100 μg/ml streptomycin, 2mM L-glutamine, and 50μM β-mercaptoethanol. Cells were maintained at 37°C in an atmosphere of 5% CO2.
Mice.
Six-week-old, female C57BL/6J mice were purchased from Jackson Laboratories (Bar Harbor, ME). Five mice per cage were housed in microisolation cages on Alpha-dri direct bedding (Shepard Specialty Paper, Kalamazoo, MI). An environmental enrichment device and nesting material were also included in each cage. Mice were provided access to certified NIH-07 food (Zeigler Bros., Gardner, PA) and water purified by reverse osmosis ad libitum. The animal room environment was maintained at 20–22°C, 40–60% humidity, and the light phase was from 0700–1900 h. Animal use in this study was approved by the Institutional Animal Use and Care Committee of The Hamner Institutes for Health Sciences and was conducted in accordance with the National Institutes of Health guidelines for the care and use of laboratory animals. Animals were housed in fully accredited American Association for Accreditation of Laboratory Animal Care facilities.
Purification of splenic B-cells.
Spleens were removed aseptically and made into a single-cell suspension. Under aseptic conditions, spleens were placed in a 60-mm dish containing 5 ml of basic RPMI (Invitrogen). Using the rubber end of a plunger from a 3-cc syringe, splenocytes were extracted from the capsule by pressing down on the spleens and moving the plunger from one end of the spleen to the other. The resulting cell suspension was washed once with 5 ml of basic RPMI (Invitrogen) and run through a 70-μm cell strainer (BD Falcon, San Jose, CA). B-cells were isolated using the B-cell isolation kit (Miltenyi Biotec, Inc., Auburn, CA) according to the manufacturer's protocol. The splenocytes were suspended in 40 μl of MACS buffer (PBS solution, pH 7.2, supplemented with 0.5% bovine serum albumin and 2mM EDTA, 4°C) per 107 cells. A 10-μl solution of biotin-antibody cocktail (Miltenyi Biotec, Inc.) per 107 cells was added to label non-B cells and incubated for 10 min at 4–8°C. Following incubation, 30 μl of buffer and 20 μl of anti-biotin microbeads (Miltenyi Biotec, Inc.) per 107 cells were added. The cell suspension was incubated for 15 min at 4–8°C, washed with 10–20× the labeling volume, and then centrifuged at 300 × g for 5 min. The cell pellet was resuspended in 500 μl of buffer per 1 × 10⁸ cells and passed through an autoMACS cell separator system (Miltenyi Biotec, Inc.). The viability of the cells was tested using a Countess automated cell counter (Invitrogen). The purity of the isolated CD19+ B cells was evaluated using an FITC-conjugated anti-CD19 antibody (BD Biosciences, San Jose, CA) and flow cytometry. The purity of the B-cell population was 95%.
Gene expression microarray measurements.
CH12.LX cells were activated with LPS (10 μg/ml) and treated with either TCDD (10nM) or vehicle (0.01% DMSO) for 0, 8, 12, 24, 36, or 48 h. Total RNA was isolated using RNeasy columns (Qiagen, Valencia, CA), and RNA integrity was validated using both a Nanodrop ND-1000 spectrophotometer (Wilmington, DE) and an Agilent 2100 bioanalyzer (Palo Alto, CA). Double-stranded cDNA was synthesized using 5 μg of total RNA using the One-Cycle cDNA Synthesis Kit (Affymetrix, Santa Clara, CA). Biotin-labeled cRNA was transcribed from the cDNA using the GeneChip IVT Labeling Kit (Affymetrix). Fifteen micrograms of labeled cRNA was fragmented and hybridized to Affymetrix Mouse Genome 430 2.0 arrays for 16 h at 45°C. Hybridized arrays were washed using the GeneChip Fluidics Station 450 and scanned using a GeneChip 3000 scanner (Affymetrix). The gene expression studies were performed in quadruplicate (n = 4) with the cells for each replicate treated and harvested on separate days.
ChIP and whole-genome tiling array measurements (ChIP-on-chip).
CH12.LX cells were activated with LPS (10 μg/ml) and treated with either TCDD (10nM) or vehicle (0.01% DMSO) for 1 h and cells were fixed according to GENpathway cell fixation protocol (San Diego, CA). Cells were fixed with 1% formaldehyde for 15 min and quenched with 0.125M glycine. After fixation, ChIP-on-chip was performed by GENpathway. Chromatin was isolated by adding lysis buffer followed by disruption with a Dounce homogenizer. Lysates were sonicated, and the DNA was sheared to an average length of 300–500 bp. Genomic DNA was prepared by treating aliquots of chromatin with RNase, proteinase K, and heat for de–cross-linking, followed by ethanol precipitation. Pellets were resuspended and the resulting DNA was quantified on a Nanodrop ND-1000 spectrophotometer. Extrapolation to the original chromatin volume allowed quantitation of the total chromatin yield.
An aliquot of chromatin (30 μg) was precleared with protein-agarose beads (Invitrogen). Factor-bound DNA sequences were isolated using antibodies against AHR (Biomol). After incubation at 4°C overnight, protein-agarose beads were used to isolate the immune complexes. Complexes were washed, eluted from the beads with SDS buffer, and subjected to RNase and proteinase K treatment. Cross-links were reversed by incubation overnight at 65°C, and ChIP DNA was purified by phenol-chloroform extraction and ethanol precipitation.
Following purification, ChIP DNA was labeled, fragmented, and hybridized to Affymetrix Mouse Tiling 2.0 Array Sets. Hybridized arrays were then washed and scanned using a GeneChip Fluidics Station 450 and a GeneChip 3000 scanner (Affymetrix), respectively. The ChIP studies were performed in triplicate (n = 3) with the cells for each replicate treated and harvested on separate days.
ChIP and quantitative PCR.
Primary B-cells (2 × 10⁶ cells/ml, 3 ml/well of 6-well plate, 5 wells per treatment/mouse were pooled for the analysis) were activated with LPS (10 μg/ml) and treated with either TCDD (30nM) or vehicle (0.01% DMSO) for 1 h. The cells were fixed and ChIP was performed according to GENpathway (San Diego, CA) cell fixation protocol as described in the ChIP-on-chip methods. An aliquot of chromatin (30 μg) was precleared with protein-agarose beads (Invitrogen). Factor-bound DNA sequences were isolated using antibodies against AHR (Biomol). After incubation at 4°C overnight, protein-agarose beads were used to isolate the immune complexes. Complexes were washed, eluted from the beads with SDS buffer, and subjected to RNase and proteinase K treatment. Cross-links were reversed by incubation overnight at 65°C. ChIP DNA was purified by phenol-chloroform extraction and ethanol precipitation. Quantitative PCR reactions were carried out in triplicate on specific genomic regions identified by ChIP-on-chip studies using SYBR Green Supermix (Bio-Rad, Hercules, CA). The following primers were used for the amplification of the genomic regions of interest: Bach2 (chr14: 32478534–32478617), 5′-AACCCTGCTCGTACATGACA- 3′ and 5′-TTCCAGGTAGCAAAGGCTAGA-3′; Pdgfrb (chr18: 61251168–61251246), 5'-GGCTCTCACGCAAACTCTG-3′ and 5′-CATCAGGAAGATGGCAGACA-3′; Blk (chr14: 64037283–64037382), 5′-TACCAAGGCCAAAGCCATAA-3′ and 5′- TCTGCCACTCCCTCATCTTC-3′; Il5ra (chr6: 106693253–106693352), 5′-TGGAAACCAGATGCCTATGA-3′ and 5′-CCGCCGCCTTTACAGTAGTA-3′; and Untr6 (chr6: 120258582–120258798), 5′-TCAGGCATGAACCACCATAC-3′ and 5′- AACATCCACACGTCCAGTGA-3′. The average Ct values were converted into copy numbers of DNA using standard curves of genomic DNA with known copy numbers. The binding values for each region were normalized for primer efficiency by carrying out qPCR for each primer pair using input DNA. The results are presented as binding events per 1000 cells for each genomic region compared with an untranscribed region (Untr6) as a negative control. For statistical analysis, an unpaired two-tailed Student's t-test was performed between the TCDD-treated samples and the DMSO controls. The ChIP-qPCR experiments were performed in triplicate (n = 3) with the cells for each TCDD and DMSO treatment coming from separate mice (i.e., three TCDD-treated mice and three DMSO control mice).
Quantitative reverse transcription PCR.
Primary B cells (2 × 10⁶ cells/ml, 3 ml/well of 6-well plate, 5 wells per treatment/mouse were pooled for the analysis) were activated with LPS (10 μg/ml) and treated with 30nM TCDD or vehicle (0.01% DMSO) for 12 h. Total RNA was isolated using RNeasy columns (Qiagen), and RNA concentrations were quantified using a Nanodrop ND-1000 spectrophotometer. Double-stranded cDNA was synthesized using 1 μg of total RNA using the Applied Biosystems high-capacity cDNA reverse transcription kit (Foster City, CA), and quantitative reverse transcription PCR (qRT-PCR) was performed using the Taqman Fast Universal PCR Master Mix and Taqman gene expression assays for Cyp1a1 (Mm00487218_m1), Bach2 (Mm_00464379_m1), Pdgfrb (Mm00435559_m1), Blk (Mm01310453_g1), and Il5ra (Mm00434284_m1). All qRT-PCR measurements were performed on an ABI Prism 7900 Sequence Detection System (Applied Biosystems). The change in gene expression was calculated using the ΔΔCt method using Gapdh as an internal control. For statistical analysis, an unpaired two-tailed Student's t-test was performed between TCDD-treated samples and the DMSO controls. All qRT-PCR studies were performed in quadruplicate (n = 4) with the cells for each TCDD treatment and the DMSO controls coming from separate mice (i.e., four TCDD-treated mice and four DMSO control mice).
Gene expression microarray statistical analysis.
The probe-level data from the gene expression microarray experiments were preprocessed using robust multi-array average (RMA) and log2 transformed (Irizarry et al. 2003). A two-way ANOVA was performed on the expression data from all time points with individual contrasts between TCDD-treated and vehicle controls samples at each time point (Partek Genomic Suite, Version 6.4; Partek Inc., St. Louis, MO). The p values for all contrasts were adjusted for multiple comparisons using false discovery rate (FDR; Benjamini and Hochberg 1995). A ± 1.5-fold change and an FDR corrected p value < 0.05 (FDR < 0.05) was used as the criteria for determining significance. The gene expression data have been deposited in the National Center for Biotechnology Information Gene Expression Omnibus (accession no.: GSE21272).
ChIP microarray statistical analysis.
The probe-level data from the whole-genome tiling microarray was quantile normalized. To identify regions with increased binding following TCDD treatment, peak detection (detection of regions with significant binding) was performed by calculating a moving average (MA) for a half window of 300 bp or five adjacent (continuous) probes using CisGenome software (Ji et al. 2008). MAs were compared between TCDD-treated samples and vehicle controls. All regions with an MA > threefold were tabulated, whereas all peaks that were < 100 bp in length or did not contain at least five continuous probes with an MA > threefold were discarded. If two adjacent regions contained a gap < 300 bp, regions were merged into one single region (Ji et al. 2008). Statistical comparison of the experimental replicates was performed using CisGenome and the single tail method (Ji et al. 2008). Regions with FDR of less than 5% (FDR < 0.05) were considered significant. To obtain a gene list for regions showing increased AHR binding, regions were annotated with genes 10,000 bp upstream of region start site or 10,000 bp downstream from the region end site. All processed ChIP-on-chip data are provided as Supplementary material (Supplementary table 1). The ChIP-on-chip data have been deposited in the National Center for Biotechnology Information Gene Expression Omnibus (accession no.: GSE23708).
Transcription factor binding sites analysis.
Enrichment of transcription factor binding sites (TFBS) and enrichment of transcription factor modules was performed using the Genomatix RegionMiner software application set to ElDorado version 05-2007 and the weight matrix library version 8.1 (Genomatix Software GmbH, Munich, Germany). For analyzing transcription factor modules, V$AHRR was used as the mandatory element with a distance between elements set at 10–50 bp.
Network and functional ontology enrichment analysis.
Signaling networks were constructed to connect the 78 putative direct regulatory targets of the AHR with key transcription factors involved in B-cell differentiation (Prdm1, Bcl6, and Pax5). The list of 78 genes that exhibited both altered expression at the 8- and 12-h time points and increased binding by ChIP-on-chip were set as source nodes and the key B-cell transcription factors were set as target nodes. The network was constructed using Dijkstra's shortest paths algorithm (Dijkstra, 1959) and the GeneGo Metacore database (GeneGo, Inc., St Joseph, MI) with a maximum number of steps set to 2. The inferred network was filtered to include only nodes showing expression in lymphocytes. The network for each key B-cell transcription factor (Prdm1, Bcl6, and Pax5) was constructed separately.
Functional ontology enrichment analysis was performed on the genes that exhibited significantly altered expression at each time point (8, 12, 24, 36, and 48 h) in the time course study. The enrichment analysis was conducted using the GeneGo process networks in the Metacore database. The enrichment p values were calculated based on a hypergeometric distribution and significant enrichment was defined as an FDR-corrected p value < 0.01.
RESULTS
Chromosomal Regions Showing Increased AHR Binding.
For the ChIP-on-chip analysis, B cells were activated by LPS and exposed to either TCDD or DMSO. Protein DNA complexes were cross-linked with formaldehyde and the chromatin was isolated and enriched using an anti-AHR antibody. After reversal of cross-links, the AHR-associated DNA was amplified and hybridized to mouse whole-genome tiling arrays. One thousand eight hundred and ninety three (1893) regions exhibited increased binding following TCDD exposure (Table 1). A complete list of the 1893 regions is provided in Supplementary material (Supplementary table 1). A total of 26, 148, and 1035 of these binding regions mapped to within 500 bp, 2 kb, and 10 kb of a known gene, respectively. To cast the widest net possible in identifying potential direct AHR-regulated genes, the 1035 genes from the 10 kb cutoff was used in the subsequent analyses. The majority of AHR-binding regions that mapped to within 10 kb of a gene were in introns. A similar percentage of genes mapped to intergenic regions and exons. A relatively small percentage of these binding regions mapped to gene promoters as defined as 500 bp upstream of first transcription start site and 100 bp downstream of last transcription start site. The relatively high percentage of AHR-binding sites in the intergenic region can be expected because the response elements for known AHR target genes are typically located farther upstream of the strict promoter definition used in this analysis (Watson and Hankinson, 1992; Zhang et al., 1998). There were no binding regions that showed significantly decreased binding following TCDD treatment.
TABLE 1.
Breakdown of Significantly Altered Regions Based on Their Overlap with Different Regions of the Genome
| Region description | No. of regions | % That overlap with an intergenic region | % That overlap with a coding exon | % That overlap with an intron | % That overlap with a promotera |
| Regions with increased AHR binding | 1893 | 43.9 | 13.7 | 53.1 | 7.2 |
| Regions that mapped to within 10kb of known genes | 1035 | 21.0 | 20.3 | 75.2 | 10.8 |
| Regions (genes) with increased binding that mapped to within 10 kb of known genes and exhibited altered expression at 8 or 12 h posttreatment | 78 | 23.5 | 25.6 | 66.7 | 20.5 |
Promoter defined as 500 bp upstream of first transcription start site and 100 bp downstream of last transcription start site for gene of interest.
Enrichment of TFBS in Chromosomal Regions Showing Increased AHR Binding
To characterize the DNA sequences showing increased AHR binding and identify potential binding sites for transcription factors, computational analysis was done on the 1893 regions that exhibited increased binding by ChIP-on-chip following TCDD exposure (Table 2). The TFBS for the AHR (V$AHRR) exhibited the greatest enrichment, whereas TFBS for the Nrf1 (V$NRF1), Pax9 (V$PAX9), Zf5f (V$ZF5F), and Chre (V$CHRE) transcription factors also showed enrichment relative to the genome. Abbreviations of transcription factor families in the TFBS results are provided as Supplementary material (Supplementary table 2). Apart from the expected enrichment in AHR-binding sites, binding sites for other transcription factors also occurred frequently in chromatin bound by the AHR. The gene-oriented breakdown of the most significantly enriched transcription factor families demonstrates that most AHR TFBS occurred in the introns and intergenic regions (Table 3).
TABLE 2.
Analysis for Enriched TFBS in All Regions That Showed Increased Binding by ChIP-on-Chip
| TF family | Number of sequences | Number of matches | Expected (genome) | SD | Overrepresentation (genome) | Z-score (genome) |
| V$AHRR | 629 | 1266 | 333.09 | 18.25 | 3.8 | 51.1 |
| V$NRF1 | 84 | 316 | 116.38 | 10.79 | 2.72 | 18.46 |
| V$PAX9 | 102 | 153 | 70.57 | 8.4 | 2.17 | 9.75 |
| V$ZF5F | 114 | 234 | 112.34 | 10.6 | 2.08 | 11.43 |
| V$CHRE | 144 | 184 | 94.39 | 9.72 | 1.95 | 9.17 |
| V$CDEF | 51 | 62 | 31.78 | 5.64 | 1.95 | 5.27 |
| V$HNFP | 90 | 96 | 50.24 | 7.09 | 1.91 | 6.39 |
| V$DEAF | 196 | 222 | 120.86 | 10.99 | 1.84 | 9.15 |
| V$WHNF | 184 | 200 | 115.01 | 10.72 | 1.74 | 7.88 |
| V$HIFF | 392 | 635 | 376.91 | 19.41 | 1.68 | 13.27 |
| O$MTEN | 189 | 223 | 141.84 | 11.91 | 1.57 | 6.77 |
| V$EGRF | 672 | 2038 | 1307.54 | 36.13 | 1.56 | 20.2 |
| V$AP1F | 621 | 1286 | 855.49 | 29.23 | 1.5 | 14.71 |
| V$MTF1 | 99 | 113 | 76.01 | 8.72 | 1.49 | 4.19 |
| V$PAX3 | 391 | 494 | 332.69 | 18.24 | 1.48 | 8.82 |
TABLE 3.
Breakdown of Top Five TFBS Based on Their Overlap with Different Regions of the Genome
| TF family | % That overlap with an intergenic region | % That overlap with a coding exon | % That overlap with an intron | % That overlap with a promotera |
| V$AHRR | 43.4 | 8.6 | 53.3 | 8.5 |
| V$NRF1 | 54.8 | 8.2 | 43.0 | 14.2 |
| V$PAX9 | 30.7 | 31.4 | 62.8 | 11.8 |
| V$ZF5F | 53.4 | 11.1 | 42.3 | 11.5 |
| V$CHRE | 50.5 | 12.5 | 45.1 | 6.5 |
Promoter defined as 500 bp upstream of first transcription start site and 100 bp downstream of last transcription start site for gene of interest.
Enrichment of Transcription Factor Modules in Chromosomal Regions Showing Increased AHR Binding
To identify transcription factors that may either interact or cooperate with the AHR to coregulate genes, all 1893 binding regions were analyzed for enrichment of transcription factor modules using the V$AHRR as the mandatory element (Table 4). The results showed that the AHR TFBS co-occurred with a number of transcription factor families. The most frequently indentified transcription factor module included the AHR and Egr1, whereas other transcription factor modules included 3 (Nrf1, Zf5f and Pax9) of the top four transcription factor families from the single TFBS enrichment analysis. These transcription factors may coregulate AHR target genes. Similar to the AHR TFBS alone, the genomic location for these modules occurred most frequently in the intronic and intergenic regions (Table 5).
TABLE 4.
Analysis for Enriched Transcription Factor Modules in All Regions That Showed Increased Binding by ChIP-on-Chip
| TF modules | Number of sequences | Number of matches | Expected (genome) | SD | Overrepresentation (genome) | Z-score (genome) |
| V$AHRR-V$AHRR | 114 | 699 | 23.8 | 4.88 | 29.37 | 138.31 |
| V$AHRR-V$EGRF | 159 | 1914 | 96.42 | 9.82 | 19.85 | 185.06 |
| V$AHRR-V$NRF1 | 36 | 452 | 35.72 | 5.98 | 12.65 | 69.56 |
| V$AHRR-V$GABF | 32 | 384 | 32.1 | 5.67 | 11.96 | 62.02 |
| V$AHRR-V$ZF5F | 36 | 207 | 24.48 | 4.95 | 8.46 | 36.79 |
| V$AHRR-V$RBP2 | 34 | 69 | 8.34 | 2.89 | 8.28 | 20.84 |
| V$AHRR-V$HAML | 97 | 148 | 21.83 | 4.67 | 6.78 | 26.9 |
| V$AHRR-V$PAX9 | 21 | 39 | 5.84 | 2.42 | 6.68 | 13.51 |
| V$AHRR-V$HZIP | 12 | 23 | 3.45 | 1.86 | 6.66 | 10.25 |
| V$AHRR-V$MTF1 | 23 | 31 | 4.71 | 2.17 | 6.58 | 11.88 |
| V$AHRR-V$AP1F | 80 | 162 | 25.11 | 5.01 | 6.45 | 27.22 |
| V$AHRR-V$HNFP | 13 | 18 | 2.85 | 1.69 | 6.32 | 8.68 |
| V$AHRR-V$DICE | 43 | 75 | 13.19 | 3.63 | 5.69 | 16.89 |
| V$AHRR-V$OAZF | 37 | 73 | 12.85 | 3.58 | 5.68 | 16.64 |
| V$AHRR-V$E4FF | 47 | 67 | 12.18 | 3.49 | 5.5 | 15.57 |
TABLE 5.
Breakdown of Top Five Transcription Factor Modules Based on Their Overlap with Different Regions of the Genome
| Module | % That overlap with an intergenic region | % That overlap with a coding exon | % That overlap with an intron | % That overlap with a promotera |
| V$AHRR V$AHRR | 51.7 | 1.9 | 47.9 | 5.2 |
| V$AHRR V$EGRF | 48.5 | 1.8 | 51.2 | 7.5 |
| V$AHRR V$NRF1 | 56.6 | 0.9 | 42.9 | 6.9 |
| V$AHRR V$GABF | 50.3 | 6.0 | 49.5 | 1.8 |
| V$AHRR V$ZF5F | 62.8 | 2.9 | 34.8 | 14.0 |
Promoter defined as 500 bp upstream of first transcription start site and 100 bp downstream of last transcription start site for gene of interest.
A number of transcription factors that occurred as modules with V$AHRR in our study have been shown to co-occur with the AHR in other studies and other cell types. In a mouse hepatoma cell line, the AHR TFBS co-occurred with Hif1 (V$HIFF), Egr1 (V$EGRF), and Foxn1 (V$WHNF) TFBS in promoter regions showing increased AHR binding following treatment with TCDD (Sartor et al., 2009). Only the transcription factor module for AHR and Egr1 was identified in our study. However, the Hif1 and Foxn1 TFBS showed enrichment within the 1893 regions that showed significant AHR binding and did not co-occur with the AHR. In an in silico analysis of promoter regions from genes showing differential expression in primary human hepatocytes following exposure to Aroclor 1254, the TFBS for Nrf1 (V$NRF1) and Npas2 (V$HIFF) co-occurred with the AHR TFBS (Reymann and Borlak, 2006). In our study, the AHR and Nrf1 module was identified. However, Npas2 only showed enrichment within the 1893 regions with significant AHR binding and did not co-occur with the AHR.
Overlap of Genes Showing Increased AHR Binding and Altered Expression
The 1035 binding regions that mapped to within 10 kb of known genes were compared with gene expression changes at 8 and 12 h following LPS activation and TCDD exposure. A total of 498 genes were significantly altered following TCDD treatment at either time point, 422 genes had increased expression, and 76 genes had decreased expression. Of these genes, 78 genes showed overlap with the 1035 regions showing increased AHR binding (Fig. 2). A complete list of the 78 genes is provided in supplementary material (Supplementary table 3). The regional breakdown of AHR binding for these 78 genes maintained a bias toward intronic regions, suggesting that response elements within introns may play an underappreciated role in regulating AHR target genes. Notably, the percentage of binding regions overlapping with a gene promoter progressively increased from 7.2% in all binding regions to 20.5% in the 78 binding regions showing altered expression (Table 1).
FIG. 2.
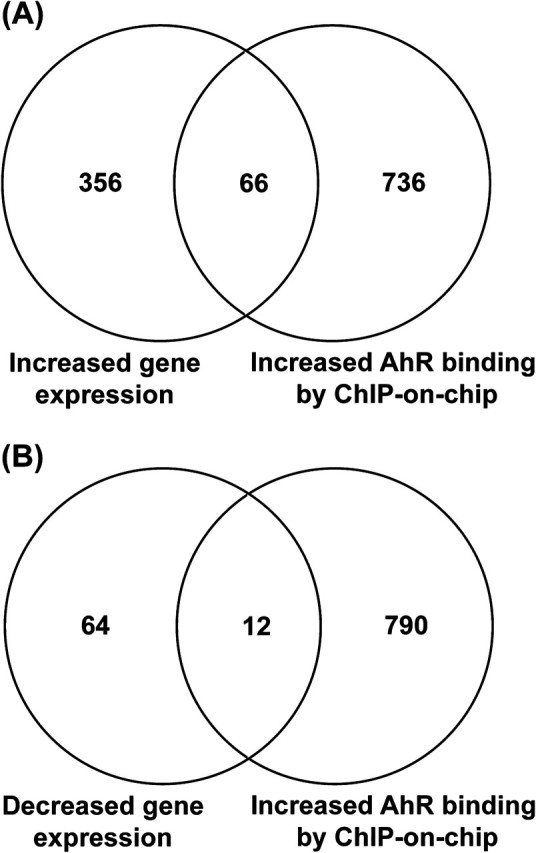
Comparison of genes showing significant alterations in expression at the early time points (8 or 12 h) and increased AHR binding. (A) Venn diagram comparing genes with increased expression with genes showing increased AHR binding. (B) Venn diagram comparing genes with decreased expression with genes showing increased AHR binding.
The relationship between the amount of AHR binding and changes in gene expression showed a significant correlation when examined for all 78 genes (8 h: r = 0.4560, p < 0.0001; 12 h: r=0.4192, p< 0.0001) (Figs. 3A and B). The correlation was higher for the subset of genes with binding in the promoter region (8 h: r=0.5547, p< 0.05; 12 h: r = 0.5534, p = 0.05) (Figs. 3C and D). Because these 78 genes exhibited alterations at the level of expression at the earliest time points and showed increased AHR binding, they may be potential targets for direct regulation by the AHR in mouse B cells.
FIG. 3.

Correlation between increased AHR binding and altered gene expression. (A) Scatter plot of all 78 genes comparing log2 fold-change (FC) AHR binding by ChIP-on-chip versus log2 fold-change of gene expression changes at 8 h. (B) Scatter plot of all 78 genes comparing log2 fold-change AHR binding by ChIP-on-chip versus log2 fold-change of gene expression changes at 12 h. (C) Scatter plot of gene subset showing increased AHR promoter binding comparing log2 fold-change AHR binding by ChIP-on-chip versus log2 fold-change of gene expression changes at 8 h. (D) Scatter plot of gene subset showing increased AHR promoter binding comparing log2 fold-change AHR binding by ChIP-on-chip versus log2 fold-change of gene expression changes at 12 h. The correlation coefficient (r) and associated p value are shown for each plot. The CYP1A1 gene was removed from all graphs for better visualization of the data points.
Differences in Enrichment of Transcription Factor Modules between Genes Showing Increased and Decreased Expression
Gene transcription is typically regulated by multiple transcription factors that either bind simultaneously as a complex to a regulatory region or in a sequential manner. To evaluate whether AHR binding in cooperation with other transcription factors may determine whether a gene shows increased or decreased expression following TCDD exposure, the two groups of genes were analyzed separately for enrichment of known modules using the V$AHRR as the mandatory element (Tables 6 and 7). Except for the V$EGRF transcription factor family, different transcription factor modules were enriched among genes showing increased and decreased expression. Among genes showing increased expression, the most highly enriched transcription factor module contained multiple V$AHRR-binding sites.
TABLE 6.
Analysis for Enriched Transcription Factor Modules of 12 Regions (genes) that Showed Decreased Gene Expression by Gene Expression Microarrays and Increased Binding by ChIP-on-Chip Analysis
| Modules with V$AHRR | Number of sequences | Number of matches | Expected (genome) | SD | Overrepresentation (genome) | Z-score (genome) |
| V$AHRR V$ZBPF | 3 | 9 | 0.44 | 0.66 | 20.6 | 12.2 |
| V$AHRR V$EGRF | 3 | 10 | 0.58 | 0.76 | 17.37 | 11.76 |
| V$AHRR V$MAZF | 2 | 5 | 0.18 | 0.42 | 28.2 | 10.27 |
| V$AHRR V$SP1F | 2 | 6 | 0.32 | 0.56 | 18.89 | 9.2 |
| V$AHRR V$KLFS | 4 | 8 | 0.6 | 0.78 | 13.31 | 8.9 |
| V$AHRR V$AP1F | 3 | 4 | 0.15 | 0.39 | 26.67 | 8.65 |
| V$AHRR V$GLIF | 2 | 4 | 0.21 | 0.46 | 19.09 | 7.19 |
| V$AHRR V$CSEN | 1 | 2 | 0.06 | 0.24 | 35.31 | 6.06 |
| V$AHRR V$HOXH | 1 | 3 | 0.17 | 0.41 | 17.87 | 5.69 |
| V$AHRR V$RP58 | 1 | 2 | 0.06 | 0.25 | 30.84 | 5.64 |
TABLE 7.
Analysis for Enriched Transcription Factor Modules of 66 Regions (genes) That Showed Increased Gene Expression by Gene Expression Microarrays and Increased Binding by ChIP-on-Chip Analysis
| Modules with V$AHRR | Number of sequences | Number of matches | Expected (genome) | SD | Overrepresentation (genome) | Z-score (genome) |
| V$AHRR V$AHRR | 8 | 25 | 1.1 | 1.05 | 22.65 | 22.27 |
| V$AHRR V$EGRF | 9 | 45 | 4.47 | 2.11 | 10.06 | 18.93 |
| V$AHRR V$ETSF | 20 | 43 | 4.92 | 2.22 | 8.73 | 16.93 |
| V$AHRR V$HZIP | 2 | 7 | 0.16 | 0.4 | 43.71 | 15.84 |
| V$AHRR V$CREB | 20 | 34 | 3.71 | 1.92 | 9.17 | 15.48 |
| V$AHRR V$SMAD | 4 | 16 | 1.24 | 1.11 | 12.94 | 12.83 |
| V$AHRR V$RUSH | 7 | 21 | 2.29 | 1.51 | 9.19 | 12.05 |
| V$AHRR V$E4FF | 7 | 10 | 0.56 | 0.75 | 17.71 | 11.89 |
| V$AHRR V$STAT | 10 | 26 | 3.47 | 1.86 | 7.5 | 11.84 |
| V$AHRR V$MOKF | 8 | 15 | 1.31 | 1.14 | 11.48 | 11.54 |
Signaling Networks for AHR Regulation of Key B-Cell Transcription Factors
To evaluate potential mechanisms in which the B-cell differentiation network may be directly or indirectly regulated by the AHR, three signaling networks were constructed using the 78 genes that exhibited both altered expression at the 8- or 12-h time points and increased binding by ChIP-on-chip and key transcription factors of the B-cell differentiation pathway (Prdm1, Bcl6, and Pax5) (Figs. 4–6). Each network was constructed to connect the 78 genes showing potential direct AHR regulation to one of the key transcription factors involved in B-cell differentiation by the shortest path possible and within two signaling steps. All three networks showed multiple pathways for potential regulation by the AHR. The nodes included in the networks contained a high percentage of transcription factors. In each of the three networks, edges representing positive regulatory interactions outnumbered edges representing negative regulatory interactions. A total of 11 transcription factors from the list of 78 genes were identified among the three networks. Multiple nodes and edges were also shared between the three networks including the target regulatory transcription factors Prdm1, Bcl6, and Pax5 and 9 (Xbp1, Runx3, Ubf, Stat5, Bach2, Nfatc1, Tbet, Cmyc, and Irf8) of the 11 transcription factors that are potentially directly regulated by the AHR.
FIG. 4.

Network analysis of the 78 direct AHR target genes and Prdm1. Molecules with red circles denote directly regulated genes that were upregulated, whereas molecules with blue circles denote genes that were downregulated. Green arrows denote positive regulation, red arrows denote negative regulation, and gray arrows are not defined as to the direction of regulation.
FIG. 5.

Network analysis of the 78 direct AHR target genes and Pax5. Molecules with red circles denote directly regulated genes that were upregulated, whereas molecules with blue circles denote genes that were downregulated. Green arrows denote positive regulation, red arrows denote negative regulation, and gray arrows are not defined as to the direction of regulation.
FIG. 6.

Network analysis of the 78 direct AHR target genes and Bcl-6. Molecules with red circles denote direct AHR target genes that were upregulated, whereas molecules with blue circles denote genes that were downregulated. Green arrows denote positive regulation, red arrows denote negative regulation, and gray arrows are not defined as to the direction of regulation.
Time Course Gene Expression Changes in Activated B Cells Following TCDD Exposure
Gene expression microarray analysis was performed on CH12.LX cells activated with LPS and exposed to either DMSO or TCDD (10nM) for 0, 8, 12, 24, 36, and 48 h. The number of significant genes at each time point ranged from 352 at the 8-h time point to a maximum of 647 at the 24-h time point (Table 8). The total number of differentially altered genes was 1299. Hierarchical clustering of the differentially altered genes was performed together with the ChIP-on-chip results (Fig. 7). The results showed that the majority of genes were upregulated throughout the 48-h time course with smaller subsets of genes showing more complex temporal behavior. The corresponding ChIP-on-chip measurements show that the most genes with AHR binding were upregulated at all time points. The standard set of genes in the AHR battery was highlighted for comparison and included in Supplementary material (Supplementary fig. 1). Enrichment analysis was performed on the differentially expressed genes at each time point to assess how the gene expression changes by TCDD would impact cellular processes and functions throughout the differentiation timeline (Fig. 8). Processes related to interferon signaling and the response to viral infection showed increasing enrichment up to the 24-h time point followed by a decline to 48 h. Processes such as those related to the Janus kinase-Signal Transducer and Activator of Transcription (Jak-STAT) pathway and the negative relation of cell proliferation were highly enriched at early time points followed by a decline over time. Finally, process such as interleukin (IL)-2 signaling and chemotaxis showed peak enrichment at the later time points.
TABLE 8.
Breakdown of Significantly Altered Genes from Gene Expression Time Course
| Treatment Comparison | No. of genes with +/−1.5 fold change and FDR-corrected p value < 0.05 |
| 8 h LPS/DMSO vs. 8 h LPS/TCDD | 352 |
| 12 h LPS/DMSO vs. 12 h LPS/TCDD | 554 |
| 24 h LPS/DMSO vs. 24 h LPS/TCDD | 647 |
| 36 h LPS/DMSO vs. 36 h LPS/TCDD | 498 |
| 48 h LPS/DMSO vs. 48 h LPS/TCDD | 599 |
| Union-1299 genes |
FIG. 7.

Time course hierarchical clustering of all genes showing significant changes in expression. Mouse CH12.LX cells were treated with LPS (10 μg/ml) + DMSO (vehicle) or LPS (10 μg/ml) + TCDD (10nM) and harvested at 8, 12, 24, 36, and 48 h postexposure. At each time point, cells treated with TCDD were compared with the DMSO vehicle control. Hierarchical clustering was performed on the log2 fold-change for all five time points. The maximum fold-change (FC) for each gene by ChIP-on-chip is shown in the right-hand column for comparison. The locations of typical AHR responsive genes are shown to the right of the figure.
FIG. 8.

Bar chart of statistically enriched GeneGo process networks at each time point in the gene expression microarray analysis. Time points are color coded as follows: yellow, 8 h; blue, 12 h; red, 24 h; green, 36 h; and brown, 48 h. Vertical gray line depicts an FDR-adjusted p value of 0.01.
Confirmation of AHR Binding and Gene Expression in Primary B cells
To confirm the relevance of the results obtained in the CH12.LX cell line, ChIP-qPCR and qRT-PCR were performed in primary mouse B cells on a subset of the 78 genes that showed increased AHR binding and alterations in gene expression at the early time points (Fig. 9). Of the genes interrogated, both Pdgfrb and Blk exhibited a statistically significant increase in AHR binding by ChIP-qPCR (p < 0.05). Bach2 exhibited a marginally significant increase in AHR binding (p = 0.058). Pdgfrb (decrease), Bach2 (increase), Il5ra (increase), and Cyp1a1 (increased) exhibited statistically significant changes in expression by qRT-PCR. Although the magnitude of the difference in primary B cells was less than that observed in the CH12.LX cell line, the direction of the change was consistent between the cell line and primary cells for all genes.
FIG. 9.
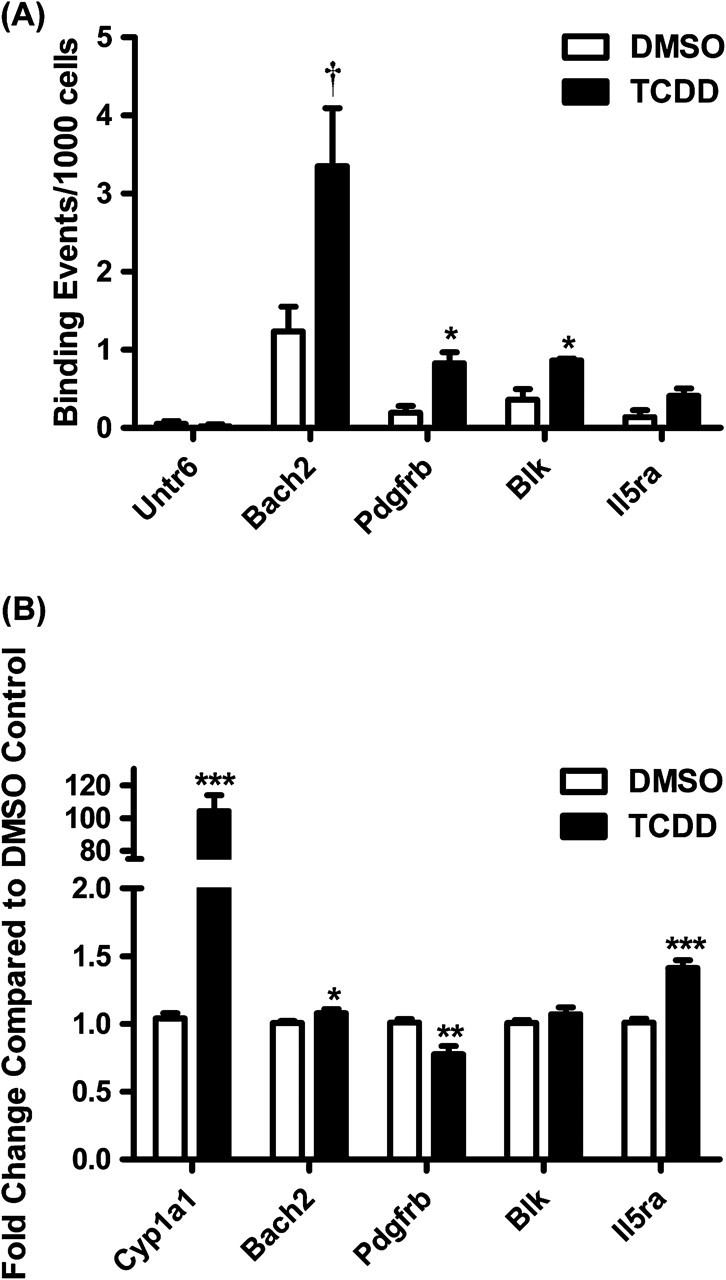
Confirmation of AHR binding and expression changes for a subset of genes in primary mouse B cells. (A) Primary mouse B cells were activated with 10 μg/ml LPS and treated with 30nM TCDD or 0.01% DMSO for 1 h. ChIP-qPCR was performed on the same Bach2, Pdgfrb, Blk, and Il5ra genomic regions identified in the ChIP-on-chip experiment. A control untranscribed region (Untr6) was included as a negative control. The data are presented as binding events per 1000 cells and represent mean ± SE of triplicate measurements in B cells isolated from separate animals. *p < 0.05; †p = 0.058. (B) Primary mouse B cells were activated with 10 μg/ml LPS and treated with 30nM TCDD or 0.01% DMSO for 12 h. qRT-PCR was performed on Bach2, Pdgfrb, Blk, and Il5ra. Cyp1a1 was included as a positive control. The data represent mean ± SE of quadruplicate measurements in B cells isolated from separate animals. *p < 0.05, **p < 0.01, ***p < 0.001.
DISCUSSION
Multiple studies have demonstrated that B-cell differentiation to plasma cells is impaired by TCDD (e.g., Sulentic et al., 1998). On a molecular level, when B cells are activated in the presence of TCDD, two signaling networks are stimulated in parallel. One signaling network is involved in normal B-cell activation and differentiation and the other network is involved in AHR signaling. Although several key points of intersection between the two pathways have already been discovered (Suh et al., 2002; Sulentic et al., 2004a, 2004b; Yoo et al., 2004), the underlying hypothesis of this study was that the two networks intersect at multiple points resulting in the alteration of normal B-cell signaling. To evaluate this hypothesis, genome-wide measurements of AHR binding following TCDD treatment were performed in concert with time course gene expression measurements. Together, the integrated analysis allowed the identification of multiple pathways for potential regulation by the AHR and the downstream cellular processes and functions that were impacted by exposure to TCDD.
A total of 1893 genomic regions were identified that showed a significant increase in AHR binding in activated B cells following treatment with TCDD. Of these regions, 1035 were mapped to within 10 kb of a known gene with 78 of the genes showing significant changes in expression at either 8 or 12 h post-TCDD treatment. The presence of AHR binding for many genes without a change in expression suggests that many AHR-binding sites are not functional, at least in the cell model used in this study. Other studies have also observed this phenomenon demonstrating that transcription factor binding is not always sufficient to regulate a gene (e.g., Li et al. 2008, 2009). The binding of the transcription factor to the DNA in these regions is not spurious, but in that particular genomic context, the transcription factor may not be able to recruit the necessary coregulators required for functional transcriptional activity. Some studies have suggested that the nucleosomal context of these sites determines the transcriptional activity (Morse, 2007). Evolutionarily, nonfunctional binding may be allowed to occur at target sequences throughout the genome because they do not alter gene expression and are, therefore, not selected against (Li et al., 2008). However, these nonfunctional binding sites may indirectly act on regulating the activity of a particular transcription factor by buffering the amount of transcription factor available for functional binding.
In silico analysis of the AHR-binding regions showed enrichment for multiple TFBS and for transcription factor modules with the obligate AHR TFBS. The enrichment for AHR-binding sites (V$AHRR) served to cross-validate both the ChIP-on-chip measurements as well as the in silico analysis. The presence of other TFBS and transcription factor modules has identified other potential coregulators of AHR target genes. One potential coregulator was Egr1. The potential cooperation between AHR and Egr1 in regulating target genes is supported by a separate study showing AHR- and Egr1-binding sites on the thrombospondin-1 (Thbs1) promoter (Dabir et al., 2008). Following glucose stimulation, the AHR, Egr1, and AP-2 formed a complex that regulated Thbs1 expression (Dabir et al., 2008).
The overlap between genes that exhibited increased binding and genes that exhibited altered expression at 8 or 12 h provided a list of 78 genes that are potential targets for direct regulation by the AHR. Sixty-six of these 78 genes exhibited increased binding by ChIP-on-chip and increased expression by gene expression microarray (Fig. 2A). The positive regulatory role for the AHR has been well established, especially within the context of AHR-induced upregulation of xenobiotic metabolizing enzymes (Gu et al., 2000; Poland and Knutson, 1982). The remaining 12 genes exhibited increased binding by ChIP-on-chip but decreased expression (Fig. 2B), suggesting a repression by the AHR. Transcriptional repression by the AHR has been previously reported (Patel et al., 2009); however, based on the percentage of genes showing decreased expression, repression does not appear to be the predominant function of the receptor. Additional analysis for the enrichment of transcription factor modules within these two groups identified potential coregulators that may determine whether a gene is up- or downregulated (Table 6 and 7). Multiple AHR-binding sites were enriched in the genes showing increased expression. This observation is consistent with the presence of multiple AHR response elements in many target genes (Watson and Hankinson, 1992; Zhang et al., 1998). The results from the transcription factor module enrichment analysis on the genes showing decreased expression should be interpreted with a degree of caution because of the low number of genes available for the analysis. Nonetheless, different transcription factor modules were present in the genes showing increased expression when compared with the genes showing decreased expression, suggesting that differences in these modules may play a role in determining the overall expression of the target genes. Combinatorial transcription control in which activation or repression by a transcription factor is controlled by adjacent promoter sequences that bind cooperating transcription factors has been demonstrated for other transcription factors such as E2F (Freedman et al., 2009).
The transcription factor family V$EGRF which includes the TFBS for Egr1 exhibited the highest overrepresentation as a module with V$AHRR for all 1893 AHR-binding sites of the genome (Table 4) and was the only common transcription factor family between the 66 genes that exhibited high binding by ChIP-on-chip and high expression and the 12 genes that showed high binding by ChIP-on-chip and low expression (Tables 6 and 7). Egr1 is essential for Prdm1 gene transcription (Mora-Lopez et al., 2008). The expression of Egr1 is increased following cross-linking of antigen to the BCR; and mature B cells lacking Egr1 are unresponsive to antigen-induced proliferation of B cells (Gururajan et al., 2008). Egr1 modulates the transcriptional activity of several B-cell differentiation-related genes such as Il-2, Cd44, Icam-1, and Tnf-α (McMahon and Monroe, 1996) and forms a complex with the AHR to regulating the Thbs1 gene (Dabir et al., 2008). These results led us to examine whether AHR binding might disrupt Egr1 binding leading to impairment of B-cell differentiation. To obtain a list of Egr1 responsive genes whose function might potentially be disrupted by the binding of the AHR, the 159 regions that were enriched for the V$AHRR-V$EGRF module (Table 4) were searched for overlap with genes that exhibited significant expression at 8 or 12 h (Table 8). The analysis resulted in 4 genes, Cyp1b1, Tiparp, Pou2f1, and Eif2c4, which are potential candidates for AHR and Egr1 coregulation.
To identify which components of the B-cell differentiation network may be directly affected by the AHR in response to TCDD exposure, signaling networks were constructed to connect the 78 genes showing potential direct AHR regulation to each of the three key transcription factors involved in B-cell differentiation (Prdm1, Bcl6, and Pax5). All three networks showed multiple paths for potential regulation by the AHR. These paths included seven upregulated (Xbp1, Runx3, Nfatc1, T-bet, Bach2, Irf1, and Irf8) and four downregulated (Ubf, Stat5, Gata3, Myc) transcription factors.
Prdm1 is a master regulator of B-cell differentiation and is essential for the development of Ig-secreting plasma cells from undifferentiated B cells (Martins and Calame, 2008). The net function of Prdm1 depends on three separate transcriptional repressors (Pax5, Bcl6, and Bach2) and one transcriptional activator (Irf4) (Calame, 2008). In our study, Bach2 exhibited increased AHR binding and increased expression following TCDD treatment, suggesting that it may be directly regulated by the AHR. The increase in Bach2 expression is consistent with a repression of Prdm1 and impairment of B-cell differentiation.
Xbp1, Irf8, and Runx3 all directly or indirectly activate the Prdm1 repressor Bcl6. Among the direct regulators, Irf8 transcriptionally activates Bcl6 (Ku et al., 2008; Lee et al., 2006a). Among the indirect regulators, Xbp1 transcriptionally upregulates Tax1 (Ku et al., 2008) which, in turn, physically interacts with Bcl6 to enhance its repressive activity (Dean et al., 2009). Runx3 may also indirectly upregulate Bcl6 through Foxo3a. Runx3 transcriptionally cooperates with Foxo3a to regulate specific target genes (Calnan and Brunet, 2008). Foxo3a also transcriptionally regulates Bcl6 (Fernandez de Mattos et al., 2004); however, there is no evidence for cooperation between Runx3 and Foxo3a in regulating Bcl6. Irf8, Xbp1, and Runx3 all showed increased AHR binding and increased expression in our study leading to a potential upregulation or enhanced activation of Bcl6. The increase in Bcl6 expression or its activity is consistent with a repression of Prdm1 and impaired B-cell differentiation.
Irf4 is a transcriptional activator of Prdm1 (Calame, 2008). A previous computational study predicted the transcriptional regulation of Irf4 by Myc (Chen et al., 2007). In our study, Myc showed increased AHR binding and decreased expression, which could potentially lead to decreased levels of Irf4. Other studies have also demonstrated the direct regulation of Myc by the AHR (Lee et al., 2006b). A decrease in Irf4 expression is also consistent with lower Prdm1 expression and impaired B-cell differentiation.
Enrichment analysis was performed on the differentially expressed genes at each time point to examine the temporal and overall effect of AHR-regulated gene expression changes on B-cell–related processes. Many of the processes identified have been well established within the B-cell literature, whereas others are better known in other cell types and may point to other important processes within differentiating B cells that are altered by the AHR. The most enriched process network, interferon signaling exhibited a progressive increase in statistical significance up to the 24-h time point followed by a decline through the end of the time course. The involvement of the Irfs, specifically Irf4 and Irf8, in B-cell differentiation and isotype switching has been well established (Battistini, 2009; Johnson et al., 2008; Sciammas et al., 2006). The enrichment results suggested an increasing influence of the AHR for this process at the early time points which could play a role in impairing B-cell differentiation.
The Jak-STAT network showed peak enrichment at the early time points followed by a reduced enrichment at the later time points. The Jak-STAT pathway plays a role in the initiation of B-cell differentiation through activation of Prdm1 and the downregulation of Bcl6 (Desrivieres et al., 2006; Diehl et al., 2008; Klein et al., 2003; Riley et al., 2005). The enrichment results suggest that the AHR affects Jak-STAT signaling at the early time points, which may play a role in suppressing the initiation of B-cell differentiation through this pathway.
Similar to the Jak-STAT pathway, the negative regulation of cell proliferation process showed peak enrichment at the 8-h time point followed by a progressive decrease in significance. The effect of AHR activation on cell cycle arrest has been reported for other cell types (Barhoover et al., 2010; Gasiewicz et al., 2010), and the enrichment of this cellular process points to a similar role for the AHR in B cells. Because B cells undergo multiple rounds of proliferation as part of the differentiation process (Shapiro-Shelef and Calame, 2005), a negative regulation of cellular proliferation may contribute to the impairment of B-cell differentiation by TCDD.
Finally, the IL-4 pathway showed increasing enrichment at the 8- and 12-h time points followed by a reduction at the later time points. Treatment of B cells with CD40 ligand and IL-4 results in B-cell proliferation and isotype switching from IgM and IgD to IgG1 and IgE, which is an important step in the B-cell differentiation process (Hasbold et al., 1998). The isotype switching is based on the number of cell divisions the B cell has gone through with IgG1 expression appearing after three cell divisions and IgE after five (Hasbold et al., 1998). IL-4 is believed to play a role in determining the number of cell divisions required to achieve the necessary class switching (Hasbold et al., 1998). The enrichment results suggest that the AHR is affecting IL-4 signaling at the early time points and may be inhibiting the class switching involved in B-cell differentiation.
Up to 36 other cellular processes exhibited statistically significant enrichment in at least a single time point through our analysis. Although most of these networks were known to be relevant to B-cell function, others have been better defined in other cell types. This observation of specific unrecognized cellular processes may be because of the characteristics of the CH12.LX cell line used as a B-cell model in the study or potentially novel processes involved in B-cell differentiation. The novel processes may have a limited role in B-cell differentiation following treatment with LPS but may also be perturbed following cotreatment with TCDD resulting in statistically significant enrichment.
Although the bulk of the experiments performed in this study used CH12.LX cells as a model of mouse B cells, AHR binding and gene expression changes for a subset of genes were also confirmed in primary mouse B cells. Most of the changes in AHR binding and gene expression in the cell line were also observed in primary cells; however, the magnitude of the changes was lower in the primary cells. These results are consistent with previously published studies that have demonstrated that CH12.LX cells respond similarly to mouse splenic B cells with the exception that they are more sensitive to TCDD (Sulentic et al., 1998). The enhanced sensitivity of the CH12.LX cells compared with primary B cells has been shown based on the greater magnitude of suppression of the IgM response and induction of Cyp1a1 (Marcus et al., 1998; Sulentic et al., 1998, 2000; Williams et al., 1996). The increased sensitivity correlates with higher levels of AHR expressed by this cell line (Sulentic et al., 1998). It is importantly to emphasize that based on in vivo and in vitro studies, mouse primary B cells and CH12.LX cells exhibit remarkably similar profiles of modulation by TCDD, which extends beyond suppression of IgM secretion and includes, but is not limited to suppression of the Ig genes Igμ, Igκ, IgJ, as well as impairment of critical regulators of the B-cell differentiation program such as Pax5 and Xbp-1 (North et al., 2009; Schneider et al., 2008, 2009; Yoo et al., 2004).
Overall, the results illustrate that AHR-mediated inhibition of B-cell differentiation acts at multiple nodes of the B-cell differentiation network and potentially through multiple mechanisms including direct cis-acting effects of the AHR on key regulators of B-cell differentiation, indirect regulation of B-cell differentiation-related pathways, and transcriptional coregulation of target genes by AHR and other transcription factors.
SUPPLEMENTARY DATA
Supplementary data are available online at http://toxsci.oxfordjournals.org/.
FUNDING
National Institutes of Environmental Health Sciences Superfund Basic Research Program (P42-ES004911); National Institutes of Environmental Health Sciences (R01 ES02520).
Supplementary Material
Acknowledgments
We also thank Robert B. Crawford for sharing his technical expertise on the CH12.LX cell line and Dr Melvin Andersen for his review of the manuscript.
References
- Barhoover MA, Hall JM, Greenlee WF, Thomas RS. Aryl hydrocarbon receptor regulates cell cycle progression in human breast cancer cells via a functional interaction with cyclin-dependent kinase 4. Mol. Pharmacol. 2010;77:195–201. doi: 10.1124/mol.109.059675. [DOI] [PubMed] [Google Scholar]
- Battistini A. Interferon regulatory factors in hematopoietic cell differentiation and immune regulation. J. Interferon Cytokine Res. 2009;29:765–780. doi: 10.1089/jir.2009.0030. [DOI] [PubMed] [Google Scholar]
- Benjamini Y, Hochberg Y. Controlling the false discovery rate: a practical and powerful approach to multiple testing. J. R. Stat. Soc. Ser. B. 1995;57:289–300. [Google Scholar]
- Bishop GA, Haughton G. Induced differentiation of a transformed clone of Ly-1+ B cells by clonal T cells and antigen. Proc. Natl. Acad. Sci. U.S.A. 1986;83:7410–7414. doi: 10.1073/pnas.83.19.7410. [DOI] [PMC free article] [PubMed] [Google Scholar]
- Calame K. Activation-dependent induction of Blimp-1. Curr. Opin. Immunol. 2008;20:259–264. doi: 10.1016/j.coi.2008.04.010. [DOI] [PubMed] [Google Scholar]
- Calnan DR, Brunet A. The FoxO code. Oncogene. 2008;27:2276–2288. doi: 10.1038/onc.2008.21. [DOI] [PubMed] [Google Scholar]
- Chen Y, Blackwell TW, Chen J, Gao J, Lee AW, States DJ. Integration of genome and chromatin structure with gene expression profiles to predict c-MYC recognition site binding and function. PLoS Comput. Biol. 2007;3:e63. doi: 10.1371/journal.pcbi.0030063. [DOI] [PMC free article] [PubMed] [Google Scholar]
- Chung JB, Silverman M, Monroe JG. Transitional B cells: step by step towards immune competence. Trends Immunol. 2003;24:343–349. doi: 10.1016/s1471-4906(03)00119-4. [DOI] [PubMed] [Google Scholar]
- Dabir P, Marinic TE, Krukovets I, Stenina OI. Aryl hydrocarbon receptor is activated by glucose and regulates the thrombospondin-1 gene promoter in endothelial cells. Circ Res. 2008;102:1558–1565. doi: 10.1161/CIRCRESAHA.108.176990. [DOI] [PMC free article] [PubMed] [Google Scholar]
- Dean J, Hashimoto K, Tsuji T, Gautier V, Hall WW, Sheehy N. Functional interaction of HTLV-1 tax protein with the POZ domain of the transcriptional repressor BCL6. Oncogene. 2009;28:3723–3734. doi: 10.1038/onc.2009.230. [DOI] [PubMed] [Google Scholar]
- Desrivieres S, Kunz C, Barash I, Vafaizadeh V, Borghouts C, Groner B. The biological functions of the versatile transcription factors STAT3 and STAT5 and new strategies for their targeted inhibition. J. Mamm. Gland Biol. Neoplasia. 2006;11:75–87. doi: 10.1007/s10911-006-9014-4. [DOI] [PubMed] [Google Scholar]
- Diehl SA, Schmidlin H, Nagasawa M, van Haren SD, Kwakkenbos MJ, Yasuda E, Beaumont T, Scheeren FA, Spits H. STAT3-mediated up-regulation of BLIMP1 Is coordinated with BCL6 down-regulation to control human plasma cell differentiation. J Immunol. 2008;180:4805–4815. doi: 10.4049/jimmunol.180.7.4805. [DOI] [PMC free article] [PubMed] [Google Scholar]
- Dijkstra EW. A note on two problems in connexion with graphs. Numerische Mathematik. 1959;1:269–271. [Google Scholar]
- Dooley RK, Holsapple MP. Elucidation of cellular targets responsible for tetrachlorodibenzo-p-dioxin (TCDD)-induced suppression of antibody responses: I. The role of the B lymphocyte. Immunopharmacology. 1988;16:167–180. doi: 10.1016/0162-3109(88)90005-7. [DOI] [PubMed] [Google Scholar]
- Fernandez de Mattos S, Essafi A, Soeiro I, Pietersen AM, Birkenkamp KU, Edwards CS, Martino A, Nelson BH, Francis JM, Jones MC, et al. FoxO3a and BCR-ABL regulate cyclin D2 transcription through a STAT5/BCL6-dependent mechanism. Mol. Cell Biol. 2004;24:10058–10071. doi: 10.1128/MCB.24.22.10058-10071.2004. [DOI] [PMC free article] [PubMed] [Google Scholar]
- Freedman JA, Chang JT, Jakoi L, Nevins JR. A combinatorial mechanism for determining the specificity of E2F activation and repression. Oncogene. 2009;28:2873–2881. doi: 10.1038/onc.2009.153. [DOI] [PMC free article] [PubMed] [Google Scholar]
- Gasiewicz TA, Singh KP, Casado FL. The aryl hydrocarbon receptor has an important role in the regulation of hematopoiesis: implications for benzene-induced hematopoietic toxicity. Chem. Biol. Interact. 2010;184:246–251. doi: 10.1016/j.cbi.2009.10.019. [DOI] [PMC free article] [PubMed] [Google Scholar]
- Gu YZ, Hogenesch JB, Bradfield CA. The PAS superfamily: sensors of environmental and developmental signals. Annu. Rev. Pharmacol. Toxicol. 2000;40:519–561. doi: 10.1146/annurev.pharmtox.40.1.519. [DOI] [PubMed] [Google Scholar]
- Gururajan M, Simmons A, Dasu T, Spear BT, Calulot C, Robertson DA, Wiest DL, Monroe JG, Bondada S. Early growth response genes regulate B cell development, proliferation, and immune response. J. Immunol. 2008;181:4590–4602. doi: 10.4049/jimmunol.181.7.4590. [DOI] [PMC free article] [PubMed] [Google Scholar]
- Hardy RR, Hayakawa K. B cell development pathways. Annu. Rev. Immunol. 2001;19:595–621. doi: 10.1146/annurev.immunol.19.1.595. [DOI] [PubMed] [Google Scholar]
- Hasbold J, Lyons AB, Kehry MR, Hodgkin PD. Cell division number regulates IgG1 and IgE switching of B cells following stimulation by CD40 ligand and IL-4. Eur. J. Immunol. 1998;28:1040–1051. doi: 10.1002/(SICI)1521-4141(199803)28:03<1040::AID-IMMU1040>3.0.CO;2-9. [DOI] [PubMed] [Google Scholar]
- Holsapple MP, Dooley RK, McNerney PJ, McCay JA. Direct suppression of antibody responses by chlorinated dibenzodioxins in cultured spleen cells from (C57BL/6 x C3H)F1 and DBA/2 mice. Immunopharmacology. 1986;12:175–186. doi: 10.1016/0162-3109(86)90001-9. [DOI] [PubMed] [Google Scholar]
- Holsapple MP, Snyder NK, Wood SC, Morris DL. A review of 2,3,7,8-tetrachlorodibenzo-p-dioxin-induced changes in immunocompetence: 1991 update. Toxicology. 1991;69:219–255. doi: 10.1016/0300-483x(91)90184-3. [DOI] [PubMed] [Google Scholar]
- Irizarry RA, Bolstad BM, Collin F, Cope LM, Hobbs B, Speed TP. Summaries of Affymetrix GeneChip probe level data. Nucleic Acids Res. 2003;31:e15. doi: 10.1093/nar/gng015. [DOI] [PMC free article] [PubMed] [Google Scholar]
- Ji H, Jiang H, Ma W, Johnson DS, Myers RM, Wong WH. An integrated software system for analyzing ChIP-chip and ChIP-seq data. Nat. Biotechnol. 2008;26:1293–1300. doi: 10.1038/nbt.1505. [DOI] [PMC free article] [PubMed] [Google Scholar]
- Johnson K, Hashimshony T, Sawai CM, Pongubala JM, Skok JA, Aifantis I, Singh H. Regulation of immunoglobulin light-chain recombination by the transcription factor IRF-4 and the attenuation of interleukin-7 signaling. Immunity. 2008;28:335–345. doi: 10.1016/j.immuni.2007.12.019. [DOI] [PubMed] [Google Scholar]
- Klein B, Tarte K, Jourdan M, Mathouk K, Moreaux J, Jourdan E, Legouffe E, De Vos J, Rossi JF. Survival and proliferation factors of normal and malignant plasma cells. Int. J. Hematol. 2003;78:106–113. doi: 10.1007/BF02983377. [DOI] [PMC free article] [PubMed] [Google Scholar]
- Ku SC, Lee J, Lau J, Gurumurthy M, Ng R, Lwa SH, Klase Z, Kashanchi F, Chao SH. XBP-1, a novel human T-lymphotropic virus type 1 (HTLV-1) tax binding protein, activates HTLV-1 basal and tax-activated transcription. J. Virol. 2008;82:4343–4353. doi: 10.1128/JVI.02054-07. [DOI] [PMC free article] [PubMed] [Google Scholar]
- Lee CH, Melchers M, Wang H, Torrey TA, Slota R, Qi CF, Kim JY, Lugar P, Kong HJ, Farrington L, et al. Regulation of the germinal center gene program by interferon (IFN) regulatory factor 8/IFN consensus sequence-binding protein. J. Exp. Med. 2006a;203:63–72. doi: 10.1084/jem.20051450. [DOI] [PMC free article] [PubMed] [Google Scholar]
- Lee KA, Burgoon LD, Lamb L, Dere E, Zacharewski TR, Hogenesch JB, LaPres JJ. Identification and characterization of genes susceptible to transcriptional cross-talk between the hypoxia and dioxin signaling cascades. Chem. Res. Toxicol. 2006b;19:1284–1293. doi: 10.1021/tx060068d. [DOI] [PMC free article] [PubMed] [Google Scholar]
- Li XY, MacArthur S, Bourgon R, Nix D, Pollard DA, Iyer VN, Hechmer A, Simirenko L, Stapleton M, Luengo Hendriks CL, et al. Transcription factors bind thousands of active and inactive regions in the Drosophila blastoderm. PLoS Biol. 2008;6:e27. doi: 10.1371/journal.pbio.0060027. [DOI] [PMC free article] [PubMed] [Google Scholar]
- Lin B, Wang J, Hong X, Yan X, Hwang D, Cho JH, Yi D, Utleg AG, Fang X, Schones DE, et al. Integrated expression profiling and ChIP-seq analyses of the growth inhibition response program of the androgen receptor. PLoS ONE. 2009;4:e6589. doi: 10.1371/journal.pone.0006589. [DOI] [PMC free article] [PubMed] [Google Scholar]
- Lin KI, Angelin-Duclos C, Kuo TC, Calame K. Blimp-1-dependent repression of Pax-5 is required for differentiation of B cells to immunoglobulin M-secreting plasma cells. Mol. Cell Biol. 2002;22:4771–4780. doi: 10.1128/MCB.22.13.4771-4780.2002. [DOI] [PMC free article] [PubMed] [Google Scholar]
- Marcus RS, Holsapple MP, Kaminski NE. Lipopolysaccharide activation of murine splenocytes and splenic B cells increased the expression of aryl hydrocarbon receptor and aryl hydrocarbon receptor nuclear translocator. J. Pharmacol. Exp. Ther. 1998;287:1113–1118. [PubMed] [Google Scholar]
- Martins G, Calame K. Regulation and functions of Blimp-1 in T and B lymphocytes. Annu. Rev. Immunol. 2008;26:133–169. doi: 10.1146/annurev.immunol.26.021607.090241. [DOI] [PubMed] [Google Scholar]
- McMahon SB, Monroe JG. The role of early growth response gene 1 (egr-1) in regulation of the immune response. J. Leukoc. Biol. 1996;60:159–166. doi: 10.1002/jlb.60.2.159. [DOI] [PubMed] [Google Scholar]
- Mora-Lopez F, Pedreno-Horrillo N, Delgado-Perez L, Brieva JA, Campos-Caro A. Transcription of PRDM1, the master regulator for plasma cell differentiation, depends on an SP1/SP3/EGR-1 GC-box. Eur. J. Immunol. 2008;38:2316–2324. doi: 10.1002/eji.200737861. [DOI] [PubMed] [Google Scholar]
- Morris DL, Karras JG, Holsapple MP. Direct effects of 2,3,7,8-tetrachlorodibenzo-p-dioxin (TCDD) on responses to lipopolysaccharide (LPS) by isolated murine B-cells. Immunopharmacology. 1993;26:105–112. doi: 10.1016/0162-3109(93)90002-8. [DOI] [PubMed] [Google Scholar]
- Morse RH. Transcription factor access to promoter elements. J. Cell. Biochem. 2007;102:560–570. doi: 10.1002/jcb.21493. [DOI] [PubMed] [Google Scholar]
- North CM, Crawford RB, Lu H, Kaminski NE. Simultaneous in vivo time course and dose response evaluation for TCDD-induced impairment of the LPS-stimulated primary IgM response. Toxicol. Sci. 2009;112:123–132. doi: 10.1093/toxsci/kfp187. [DOI] [PMC free article] [PubMed] [Google Scholar]
- Patel RD, Murray IA, Flaveny CA, Kusnadi A, Perdew GH. Ah receptor represses acute-phase response gene expression without binding to its cognate response element. Lab. Invest. 2009;89:695–707. doi: 10.1038/labinvest.2009.24. [DOI] [PMC free article] [PubMed] [Google Scholar]
- Petrulis JR, Perdew GH. The role of chaperone proteins in the aryl hydrocarbon receptor core complex. Chem. Biol. Interact. 2002;141:25–40. doi: 10.1016/s0009-2797(02)00064-9. [DOI] [PubMed] [Google Scholar]
- Poland A, Knutson JC. 2,3,7,8-Tetrachlorodibenzo-p-dioxin and related halogenated aromatic hydrocarbons: examination of the mechanism of toxicity. Annu. Rev. Pharmacol. Toxicol. 1982;22:517–554. doi: 10.1146/annurev.pa.22.040182.002505. [DOI] [PubMed] [Google Scholar]
- Reymann S, Borlak J. Transcriptome profiling of human hepatocytes treated with Aroclor 1254 reveals transcription factor regulatory networks and clusters of regulated genes. BMC Genomics. 2006;7:217. doi: 10.1186/1471-2164-7-217. [DOI] [PMC free article] [PubMed] [Google Scholar]
- Riley RL, Van der Put E, King AM, Frasca D, Blomberg BB. Deficient B lymphopoiesis in murine senescence: potential roles for dysregulation of E2A, Pax-5, and STAT5. Semin. Immunol. 2005;17:330–336. doi: 10.1016/j.smim.2005.05.011. [DOI] [PubMed] [Google Scholar]
- Sartor MA, Schnekenburger M, Marlowe JL, Reichard JF, Wang Y, Fan Y, Ma C, Karyala S, Halbleib D, Liu X, et al. Genomewide analysis of aryl hydrocarbon receptor binding targets reveals an extensive array of gene clusters that control morphogenetic and developmental programs. Environ. Health Perspect. 2009;117:1139–1146. doi: 10.1289/ehp.0800485. [DOI] [PMC free article] [PubMed] [Google Scholar]
- Schneider D, Manzan MA, Crawford RB, Chen W, Kaminski NE. 2,3,7,8-Tetrachlorodibenzo-p-dioxin (TCDD)-mediated impairment of B cell differentiation involves dysregulation of paired box 5 (Pax5) isoform, Pax5a. J. Pharmacol. Exp. Ther. 2008;326:463–474. doi: 10.1124/jpet.108.139857. [DOI] [PMC free article] [PubMed] [Google Scholar]
- Schneider D, Manzan MA, Yoo BS, Crawford RB, Kaminski N. Involvement of Blimp-1 and AP-1 dysregulation in the 2,3,7,8-tetrachlorodibenzo-p-dioxin-mediated suppression of the IgM response by B cells. Toxicol. Sci. 2009;108:377–388. doi: 10.1093/toxsci/kfp028. [DOI] [PMC free article] [PubMed] [Google Scholar]
- Sciammas R, Shaffer AL, Schatz JH, Zhao H, Staudt LM, Singh H. Graded expression of interferon regulatory factor-4 coordinates isotype switching with plasma cell differentiation. Immunity. 2006;25:225–236. doi: 10.1016/j.immuni.2006.07.009. [DOI] [PubMed] [Google Scholar]
- Shaffer AL, Lin KI, Kuo TC, Yu X, Hurt EM, Rosenwald A, Giltnane JM, Yang L, Zhao H, Calame K, et al. Blimp-1 orchestrates plasma cell differentiation by extinguishing the mature B cell gene expression program. Immunity. 2002;17:51–62. doi: 10.1016/s1074-7613(02)00335-7. [DOI] [PubMed] [Google Scholar]
- Shaffer AL, Yu X, He Y, Boldrick J, Chan EP, Staudt LM. BCL-6 represses genes that function in lymphocyte differentiation, inflammation, and cell cycle control. Immunity. 2000;13:199–212. doi: 10.1016/s1074-7613(00)00020-0. [DOI] [PubMed] [Google Scholar]
- Shapiro-Shelef M, Calame K. Regulation of plasma-cell development. Nat. Rev. Immunol. 2005;5:230–242. doi: 10.1038/nri1572. [DOI] [PubMed] [Google Scholar]
- Suh J, Jeon YJ, Kim HM, Kang JS, Kaminski NE, Yang KH. Aryl hydrocarbon receptor-dependent inhibition of AP-1 activity by 2,3,7,8-tetrachlorodibenzo-p-dioxin in activated B cells. Toxicol. Appl. Pharmacol. 2002;181:116–123. doi: 10.1006/taap.2002.9403. [DOI] [PubMed] [Google Scholar]
- Sulentic CE, Holsapple MP, Kaminski NE. Aryl hydrocarbon receptor-dependent suppression by 2,3,7, 8-tetrachlorodibenzo-p-dioxin of IgM secretion in activated B cells. Mol. Pharmacol. 1998;53:623–629. [PubMed] [Google Scholar]
- Sulentic CE, Holsapple MP, Kaminski NE. Putative link between transcriptional regulation of IgM expression by 2,3,7,8-tetrachlorodibenzo-p-dioxin and the aryl hydrocarbon receptor/dioxin-responsive enhancer signaling pathway. J. Pharmacol. Exp. Ther. 2000;295:705–716. [PubMed] [Google Scholar]
- Sulentic CE, Kang JS, Na YJ, Kaminski NE. Interactions at a dioxin responsive element (DRE) and an overlapping kappaB site within the hs4 domain of the 3'alpha immunoglobulin heavy chain enhancer. Toxicology. 2004a;200:235–246. doi: 10.1016/j.tox.2004.03.015. [DOI] [PubMed] [Google Scholar]
- Sulentic CE, Zhang W, Na YJ, Kaminski NE. 2,3,7,8-tetrachlorodibenzo-p-dioxin, an exogenous modulator of the 3'alpha immunoglobulin heavy chain enhancer in the CH12.LX mouse cell line. J. Pharmacol. Exp. Ther. 2004b;309:71–78. doi: 10.1124/jpet.103.059493. [DOI] [PubMed] [Google Scholar]
- Vorderstrasse BA, Steppan LB, Silverstone AE, Kerkvliet NI. Aryl hydrocarbon receptor-deficient mice generate normal immune responses to model antigens and are resistant to TCDD-induced immune suppression. Toxicol. Appl. Pharmacol. 2001;171:157–164. doi: 10.1006/taap.2000.9122. [DOI] [PubMed] [Google Scholar]
- Watson AJ, Hankinson O. Dioxin- and Ah receptor-dependent protein binding to xenobiotic responsive elements and G-rich DNA studied by in vivo footprinting. J. Biol. Chem. 1992;267:6874–6878. [PubMed] [Google Scholar]
- Williams CE, Crawford RB, Holsapple MP, Kaminski NE. Identification of functional aryl hydrocarbon receptor and aryl hydrocarbon receptor nuclear translocator in murine splenocytes. Biochem. Pharmacol. 1996;52:771–780. doi: 10.1016/0006-2952(96)00360-7. [DOI] [PubMed] [Google Scholar]
- Yoo BS, Boverhof DR, Shnaider D, Crawford RB, Zacharewski TR, Kaminski NE. 2,3,7,8-Tetrachlorodibenzo-p-dioxin (TCDD) alters the regulation of Pax5 in lipopolysaccharide-activated B cells. Toxicol. Sci. 2004;77:272–279. doi: 10.1093/toxsci/kfh013. [DOI] [PubMed] [Google Scholar]
- Zhang L, Savas U, Alexander DL, Jefcoate CR. Characterization of the mouse Cyp1B1 gene. Identification of an enhancer region that directs aryl hydrocarbon receptor-mediated constitutive and induced expression. J. Biol. Chem. 1998;273:5174–5183. doi: 10.1074/jbc.273.9.5174. [DOI] [PubMed] [Google Scholar]
Associated Data
This section collects any data citations, data availability statements, or supplementary materials included in this article.