Abstract
Aims
Two-dimensional echocardiographic (2DE) assessment of right ventricular (RV) function is difficult, often resulting in inconsistent RV evaluation. Real-time three-dimensional echocardiography (RT3DE) allows the RV to be viewed in multiple planes, which can potentially improve RV assessment and limit interobserver variability when compared with 2DE.
Methods and results
Twenty-five patients underwent 2DE and RT3DE. Views of 2DE (RV inflow, RV short axis, and apical four-chamber) were compared with RT3DE views by four readers. RT3DE data sets were sliced from anterior–posterior (apical view) and from base to apex (short axis) to obtain six standardized planes. Readers recorded the RV ejection fraction (RVEF) from 2DE and RT3DE images. RVEF recorded by RT3DE (RVEF3D) and 2D (RVEF2D) were compared with RVEF by disc summation (RVEFDS), which was used as a reference. Interobserver variability among readers of RVEF3D and RVEF2D was then compared. Overall, mean RVEFDS, RVEF3D, and RVEF2D were 37 ± 11%, 38 ± 10%, 41 ± 10%, respectively. The mean difference of RVEF3D − RVEFDS was significantly less than RVEF2D–RVEFDS (3.7 ± 4% vs. 7.1 ± 5%, P = 0.0066, F-test). RVEF3D correlated better with RVEFDS (r = 0.875 vs. r = 0.69, P = 0.028, t-test). RVEF3D was associated with a 39% decrease in interobserver variability when compared with RVEF2D [standard deviation of mean difference: 3.7 vs. 5.1, (RT3DE vs. 2DE), P = 0.018, t-test].
Conclusions
RT3DE provides improved accuracy of RV function assessment and decreases interobserver variability when compared with 2D views.
KEYWORDS: Right ventricle function, Three-dimensional echocardiography
Introduction
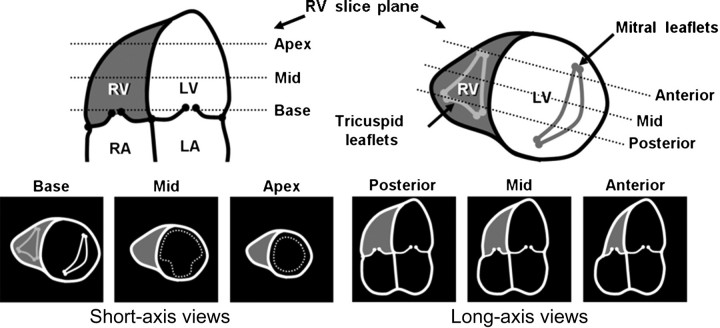
Accurate assessment of right ventricular (RV) function has important clinical utility including prognostic information in patients with LV cardiomyopathy, mitral valve disease, pulmonary embolism, pulmonary hypertension, congenital heart disease,1–4 and chronic obstructive lung disease.5,6 Assessment of RV function by two-dimensional echocardiogram (2DE) has been limited because of the asymmetric, pyramidal shape of the RV, which does not lend itself to geometric assumptions, and can vary greatly depending on the particular imaging plane (Figure 1). This results in considerable variability and inaccuracy of RV function assessment.
Figure 1.
Assessment of RV function by two-dimensional echocardiogram varies greatly depending on the particular imaging plane. RV, right ventricle; LV, left ventricle; RA, right atrium; LA, left atrium.
The three-dimensional (3D) echocardiographic assessment of RV function has permitted an increase in assessment accuracy.7–13 Prior 3D techniques required extensive reconstruction from 2D images, which limits its widespread clinical application. Recent development of real-time 3D echocardiography (RT3DE) can provide an RV image that encompasses all portions of its asymmetric shape,14–16 allowing 3D assessment of the RV in a rapid and reproducible manner. In our study, we hypothesized that RT3DE could improve the accuracy and limit variability of RV function assessment in comparison with conventional 2D methods.
Methods
This prospective study was approved by our Institutional Review Board.
Patient population
We prospectively studied consecutive adult patients referred by physicians for echocardiography with a diagnosis of clinical right heart failure, inclusive of RV infarction (three), biventricular heart failure (three), chronic obstructive lung disease (two), pulmonary hypertension from concomitant mitral valve disease (four), atrial septal defect left with right shunt (two), and presence of moderate or greater tricuspid regurgitation (three). Of 17 patients, 12 had dilated RV chamber. From this prospective group, patients with technical adequate acquisition of the RV (inflow tract and main body with apical trabecular component) echocardiographic images and no major arrhythmia (including atrial fibrillation that might restrict accurate 3D reconstruction) were selected for inclusion in our study. Ultimately, approximately 20% of the RV RT3DE acquisitions from these patients were excluded for reason of inapplicable quantitative analysis.
Echocardiography two-dimensional and real-time three-dimensional echocardiographic images
The 2D images of the RV were acquired using a Sonos 7500 (Philips Medical Systems, Bothek, WA, USA) with a S3 transducer for standard views (RV inflow, short axis of RV at base to midventricular levels, and apical four-chamber views).
RT3D data sets of the RV were obtained using Sonos 7500 (Philips Medical systems) with an X4 matrix transducer. Full volume data sets were obtained in the parasternal short axis and apical four-chamber windows with respiration suspended for the seven heart beats acquisition.
Both 2D and 3D RV data sets were transferred to a magnetic optical disk and analysed offline with Echoview 5.2 software (Tom Tec imaging Systems, Munich, Germany). Four observers of varying experience (senior echocardiographer, senior fellow, and two attending cardiologists) viewed both 2D and RT3DE data sets on all patients in a blinded fashion.
Analysis of right ventricular function
Two-dimensional assessment of right ventricle by observers
The 2D views of the RV were displayed on a computer monitor and observers were asked to record a visually estimated RV ejection fraction (RVEF). To standardize RV function estimation, RVEF was considered to be abnormal if RVEF < 45%.
Six real-time three-dimensional echocardiography-derived views
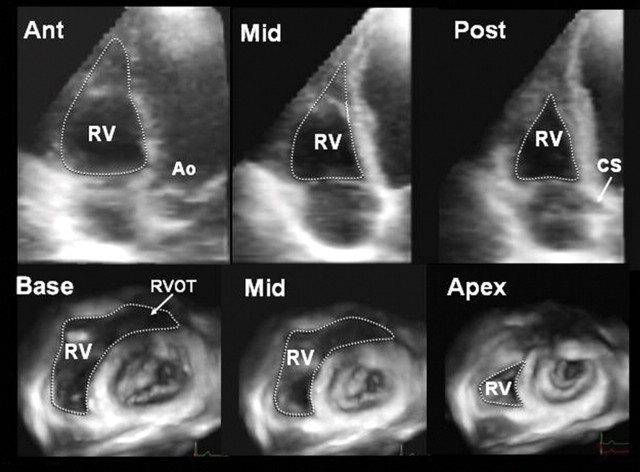
RT3DE data sets of the RV were analysed off-line using Echoview 5.2 from Tom Tec Imaging Systems. A full volume parasternal short axis RT3DE data set of the RV was sliced from base to apex to obtain views of the RV at three levels: base, midpapillary, and apex. Similarly, a full volume apical RT3D data set of the RV was sliced in an anterior to posterior direction at three levels: five-chamber view, four-chamber view, and a posterior-oriented four-chamber view with coronary sinus in view. The observers were asked to record a visually estimated RVEF in a manner similar to their 2D estimation of RVEF. The RV slicing planes of the RT3DE data sets are demonstrated in Figure 2.
Figure 2.
Display of the RV slicing planes of the real-time three-dimensional echocardiography data sets is demonstrated. RV, right ventricle; LV, left ventricle; RA, right atrium; LA, left atrium; Ao, aorta; CS, coronary sinus.
Real-time three-dimensional disc summation method
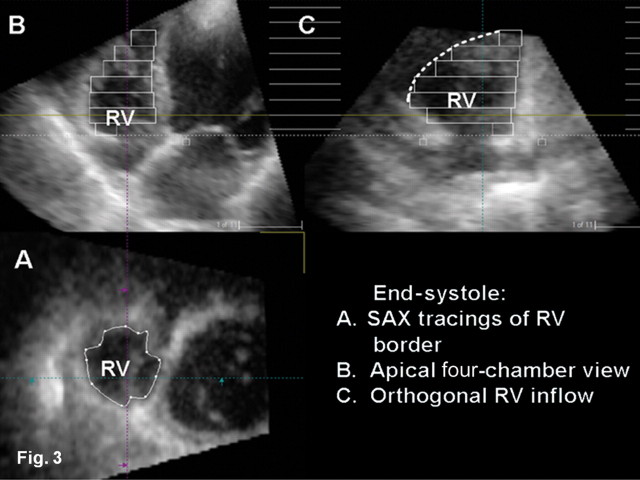
A quantitative measure of RV ejection was performed as a standard reference. RVEF was calculated using disc summation method.9,10,14 Global RVEF was computed for all patients. The software provided evenly spaced, parallel, horizontal slices of RV, wherein manual tracing of RV endocardial boundaries was done at end-systolic and end-diastolic frames.14,17 The horizontal slice tracings were reflected as rectangular boxes in the longitudinal apical four-chamber as well as the orthogonal RV inflow two-chamber view. A reference RV anterior wall lateral line starting from RV apex propagating along the endocardial border towards the basal horizontal plane was drawn (Figure 3). This reference line was used for consistency when tracing the RV endocardial boundary at short-axis plane. The slices were summed to include the most apical slice up through the basal slice that contained the RV inflow tract and main body with apical trabecular component (but excluding RV outflow tract and right atrium). The software provided the end-diastolic and end-systolic volume, which were determined through multislice with summation of lumen areas. RVEF calculation method by disc summation has been validated against magnetic resonance imaging (MRI) by several clinical studies.14,17
Figure 3.
Manual tracing of short-axis slices (A) of right ventricular (RV) endocardial boundaries translated as evenly parallel horizontal rectangular boxes as displayed on apical four-chamber (B) and orthogonal RV inflow view (C). Because of thin RV anterior wall, a reference line was drawn for consistency in RV inflow view (C). SAX, short axis.
Observer variability
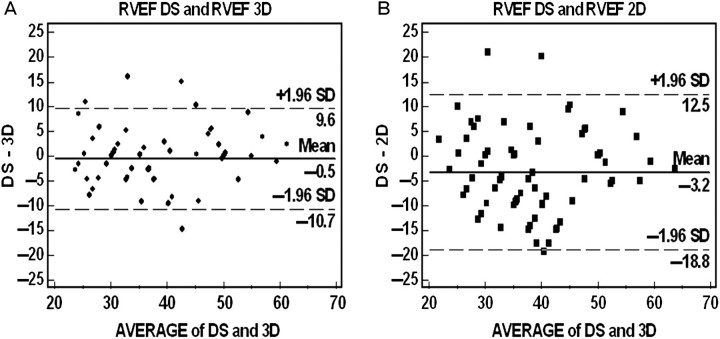
To assess interobserver variability, the mean standard deviation (SD) of the difference of each observer's recorded RVEF from that of the average of all observers' RVEF was compared for 2D and RT3DE. To assess agreement of RVEF by 2D and RT3DE methods with that of RVEF by disc summation, a Bland–Altman plot was performed.18
To gauge RVEFDS intraobserver variability, RVEF assessment was repeated for RT3DE data sets by one observer after 7 days. To gauge RVEFDS interobserver variability, RVEF assessment was performed by two independent observers (C.S. and Y.C.).
Statistical analysis
Data are expressed as mean ± SD. To compare the accuracy of RT3DE vs. 2DE, RVEF assessment relative to RVEFDS (used as a standard reference) was compared, i.e. the mean difference of RVEF3D − RVEFDS was compared with the mean difference of RVEF2D − RVEFDS by F-test.
Linear regression was used to compare correlation coefficients of RVEF2D and RVEF3D to RVEFDS. Z-transformation of correlation coefficients was performed to determine significant differences between correlation coefficients. Significant differences in interobserver variability were assessed by F-test.
Intraclass correlation coefficients, kappa-statistics, and contigency table were calculated to determine interobserver agreement. Statistical analysis was performed with SPSS software for Windows (SPSS Inc, Chicago, IL, USA). A probability value <0.05 was considered significant.
Results
Patients
There were 25 patients (eight with normal RVs and 17 with abnormal RVs; mean age of 55 ± 30 years). The patients were divided into Groups A and B with cut-off value (based on disc summation method) of RVEF ≥ 45% (normal) and <45% (abnormal), respectively.
Accuracy of RVEF3D and RVEF2D compared with RVEFDS
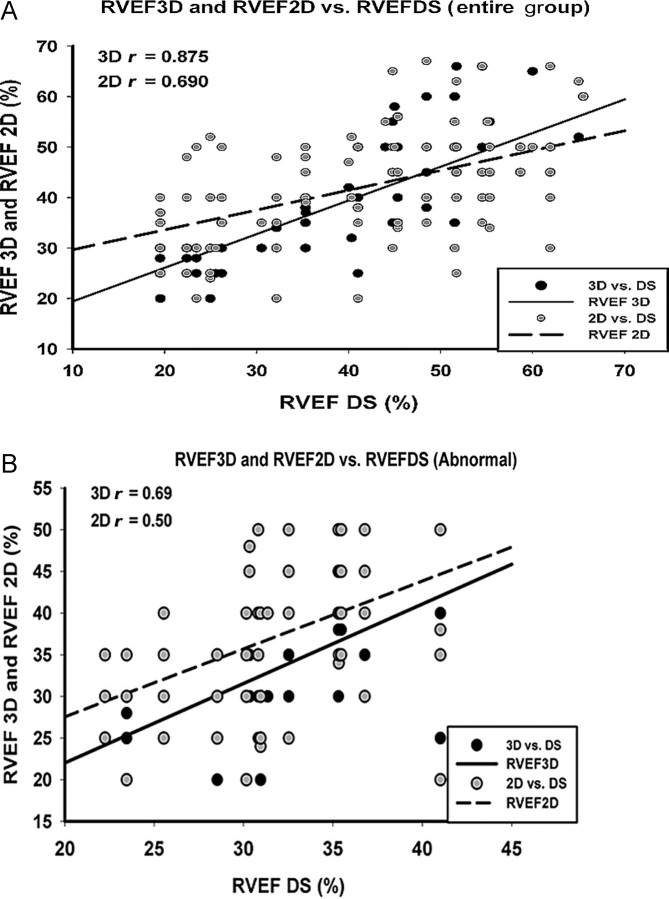
The mean and SD of RVEFDS, RVEF3D, and RVEF2D for the entire group (n = 100; i.e. 25 patients × assessments by four observers) as well as for patients divided in Group A (RVEF ≥ 45%) and Group B (<45%) are shown in Table 1. Overall, the mean of the RVEF3D was not significantly different from the mean of the RVEFDS (37 ± 11 vs. 38 ± 10%, P = 0.717 by t-test), whereas RVEF2D was significantly different from RVEFDS (37 ± 11 vs. 41 ± 10%, P = 0.028 by t-test). As seen in Table 2, the mean difference of RVEF3D minus RVEFDS was significantly less than the mean difference of RVEF2D minus RVEFDS (3.7 ± 4% vs. 7.1 ± 5%, P = 0.0066 by F-test). This was consistent with better accuracy of RVEF3D compared with RVEF2D, relative to the standard reference (RVEFDS). Overall, as shown in Figure 4A, RVEF3D also had a higher correlation with RVEFDS than did RVEF2D (r = 0.875 vs. r = 0.69, P = 0.028 by t-test), particularly in patients with abnormal RV function (Group B, r = 0.69 vs. r = 0.50, P = 0.00 001 by t-test), as shown in Figure 4B.
Table 1.
Right ventricular ejection fraction (RVEF) by disc summation, real-time three-dimensional echocardiography (RT3DE), and two-dimensional (2D) echocardiography
| RVEFDS (%) | RVEF3D (%) | RVEF2D (%) | P-value | |
|---|---|---|---|---|
| Normal | 52 ± 4 | 50 ± 6* | 49 ± 7** | NS |
| Abnormal | 32 ± 5 | 33 ± 7* | 37 ± 8† | 0.00001 |
| Total | 37 ± 11 | 38 ± 10§ | 41 ± 10§§ | 0.028 |
Patients were divided into Group A (RVEF ≥ 45%) and Group B (RVEF < 45%). Mean and standard deviation of RVEFDS, RVEF3D, and RVEF2D for both the Groups A and B (n = 25).
t-Test, *P = NS for RVEF3D vs. RVEFDS.
**P = NS for RVEF2D vs. RVEFDS.
†P = 0.00001 for RVEF2D vs. RVEFDS.
§P = 0.718 for RVEF3D vs. RVEFDS.
§§P = 0.028 for RVEF2D vs. RVEFDS.
Table 2.
Improved accuracy of RVEF3D vs. RVEF2D
| RV function | Mean difference RVEFDS − RVEF3D (%) | Mean difference RVEFDS − RVEF2D (%) | P-value |
|---|---|---|---|
| Total | 3.7 ± 4 | 7.1 ± 5* | 0.0066 |
*F-test, P = 0.0066 for RVEF2D vs. RVEFDS.
Figure 4.
Linear regression comparison of RVEF3D and RVEF2D with RVEFDS showing a stronger correlation of RVEF3D (continuous line) than RVEF2D (interrupted line) to RVEFDS in the entire group (A) and in the abnormal RVEF group (B).
Interobserver variability and agreement
Table 3 shows that RVEF3D decreased interobserver variability by 39% when compared with RVEF2D (3.69% vs. 5.13% (SD), by t-test, P = 0.018). The Bland–Altman plot indicated better agreement between RVEF3D and RVEFDS than between RVEF2D and RVEFDS, with a mean difference between the two methods of −0.5 ± 10.2% and −3.2 ± 15.6%, respectively (Figure 5). RVEF2D had a greater overestimation of RVEF when compared with RVEF3D.
Table 3.
Comparing with RVEF2D, RVEF3D decreases the interobserver variability
| Difference of RVEF − average of all readers | RVEF3D | RVEF2D | Decrease of |
|---|---|---|---|
| Total | 3.69% | 5.13% | 39%* |
Comparing with RVEF2D, RVEF3D decreases the interobserver variability. RVEF, right ventricular ejection fraction; 2D, two-dimensional echocardiography; 3D, three-dimensional echocardiography.
*t-Test; P = 0.018.
Figure 5.
Bland–Altman plot showing better agreement between RVEF3D compared with RVEFDS (left panel) than RVEF2D with RVEFDS (right panel) method. RVEF, right ventricular ejection fraction; RT3DE, real-time three-dimensional echocardiography; 2DE, two-dimensional echocardiography; DS, disc summation method.
The interobserver intraclass correlation coefficients as single measures were higher than 0.795 for RVEF3D compared with 0.497 for RVEF2D, both having P < 0.05. Intraclass correlation values are consistently higher in RVEF3D compared with RVEF2D suggesting better interobserver agreement. Table 4 shows that kappa-statistic and contigency table, both are consistently higher in RVEF3D compared with RVEF2D.
Table 4.
Kappa and contingency coefficient of RVEF2D, RVEF3D compared with RVEFDS
| Coefficient | 2D | P-value | 3D | P-value | |
|---|---|---|---|---|---|
| Reader 1 | Kappa | 0.277 | 0.020 | 0.452 | <0.001 |
| Contingency | 0.778 | 0.035 | 0.799 | 0.010 | |
| Reader 2 | Kappa | * | 0.576 | <0.001 | |
| Contingency | 0.681 | 0.214 | 0.827 | 0.001 | |
| Reader 3 | Kappa | 0.268 | 0.022 | 0.502 | <0.001 |
| Contingency | 0.726 | 0.219 | 0.819 | 0.002 | |
| Reader 4 | Kappa | 0.220 | 0.053 | 0.773 | <0.001 |
| Contingency | 0.768 | 0.056 | 0.878 | <0.001 |
Based on kappa-statistic and contigency table, comparing with RVEF2D, RVEF3D increases the interobserver agreement. RVEF, right ventricular ejection fraction; 2DE, two-dimensional echocardiography; 3DE, three-dimensional echocardiography.
*Kappa statistics cannot be computed. It requires a symmetric two-way table in which the values of the first variable match the values of the second variable.
Interobserver and intraobserver variability for quantitative measurement of RVEF by disc summation (RVEFDS) were 2.5% and 2.1%, respectively (C.S, and Y.C.).
Discussion
Our study demonstrates that evaluation of RV function by RT3DE results in greater accuracy and decreased variability in assessment when compared with standard 2D methods. Because the ventricle has dense trabeculations, complex geometric structure, and physiology, reliable assessment of RV function is difficult. Most methods require the measurement of RV dimensions, but conventional imaging methods such as angiography19,20 and radionuclide methods21 are of limited use because of the RV's position in the thorax. Recently, magnetic resonance imaging (MRI) has been validated as an accurate technique for determining RV volumes in vivo.22–24 However, the high cost, long examination time, and non-portability of MRI limits the extensive use of this technique in clinical practice, especially for serial follow-up studies of RV function. Thus echocardiography remains indispensable in the clinical setting.
The complex structural geometry of the RV hinders accurate assessment of RV volume and function on conventional 2DE. Volumetry by 2D, either by single-plane or biplane Simpson's rule, depends on geometric assumptions and is subject to image plane-positioning errors.25,26 Because of difficulties in obtaining standard and consistent imaging planes of the RV by 2DE, assessment of RV function using this method has been discrepant. This can also limit its clinical applications, especially in serial assessment of RV function for prognostic information in disease states such as cardiomyopathy, chronic lung disease, pulmonary embolism, and post-operative congenital heart disease.
This present study demonstrates that RT3DE data set offers the advantage of examining the RV in a standardized fashion, which allows for more accurate function assessment and decreased observer variability. In addition, RT3DE provides a data set that encompasses the entire RV and accounts for its asymmetric shape. These advantages of RT3DE over 2DE were observed in general and especially, among abnormal RV function group.
Importantly, our study showed RVEF3D comparing with RVEF2D offered lesser interobserver variability with a decrease of 39% (3.69% vs. 5.13%, P = 0.018, t-test, respectively).
Limitations
Comparison of RV assessment by RT3DE and 2DE was evaluated visually by observers and was thus qualitative in nature. However, the qualitative assessment was compared with a reference standard of RVEF measured quantitatively using a well-validated disc summation method.14,17 Nevertheless, subjective visual assessment of RV function is the most commonly employed method in present clinical practice.27 Another limitation was the number of patients investigated in this study was small, and it is therefore difficult to make generalizations based on our sample size.
Limitations to real-time three-dimensional echocardiography
The process of obtaining an RT3DE data set requires versatile acquisition from multiple acoustic windows that ideally, after post-processing, would yield a complete dynamic 3D data set of good quality. However, in our experience such a multi-window acquisition of good quality is not possible if the windows are too far apart (e.g. parasternal and apical). Electrocardiogram triggering is a limitation to all real- and non-real-time methods, since in the presence of irregular rhythms or atrial fibrillation, image quality will deteriorate. Higher heart rates will lead to a shortened and incomplete cardiac cycle (with loss of a true end-systolic frame).
Conclusion
The assessment of RV function by RT3DE improves accuracy and decreases interobserver variability compared with conventional 2D views.
Conflict of interest: none declared.
References
- 1.Guedes A, Mercier LA, Leduc L, Berube L, Marcotte F, Dore A. Impact of pregnancy on the systemic right ventricle after a Mustard operation for transposition of the great arteries. J Am Coll Cardiol. 2004;44:433–7. doi: 10.1016/j.jacc.2004.04.037. [DOI] [PubMed] [Google Scholar]
- 2.Van Straten A, Vliegen HW, Hazekamp MG, Bax JJ, Schoof PH, Ottenkamp J, et al. Right ventricular function after pulmonary valve replacement in patients with tetralogy of Fallot. Radiology. 2004;233:824–9. doi: 10.1148/radiol.2333030804. [DOI] [PubMed] [Google Scholar]
- 3.Salehian O, Schwerzmann M, Merchant N, Webb GD, Siu SC, Therrien J. Assessment of systemic right ventricular function in patients with transposition of the great arteries using the myocardial performance index: comparison with cardiac magnetic resonance imaging. Circulation. 2004;110:3229–33. doi: 10.1161/01.CIR.0000147284.54140.73. [DOI] [PubMed] [Google Scholar]
- 4.Agnetti A, Carano N, Cavalli C, Tchana B, Bini M, Squarcia U, et al. Long-term outcome after senning operation for transposition of the great arteries. Clin Cardiol. 2004;27:611–4. doi: 10.1002/clc.4960271107. [DOI] [PMC free article] [PubMed] [Google Scholar]
- 5.Nath J, Demarco T, Hourigan L, Heidenreich PA, Foster E. Correlation between right ventricular indices and clinical improvement in epoprostenol treated pulmonary hypertension patients. Echocardiography. 2005;22:374–9. doi: 10.1111/j.1540-8175.2005.04022.x. [DOI] [PubMed] [Google Scholar]
- 6.Espinola-Zavaleta N, Vargas-Barron J, Tazar JI, Casanova JM, Keirns C, Cardenas AR, et al. Echocardiographic evaluation of patients with primary pulmonary hypertension before and after atrial septostomy. Echocardiography. 1999;16:625–34. doi: 10.1111/j.1540-8175.1999.tb00117.x. [DOI] [PubMed] [Google Scholar]
- 7.Levine RA, Weyman AE, Handschumacher MD. Three-dimensional echocardiography: techniques and applications. Am J Cardiol. 1992;69:121–34. doi: 10.1016/0002-9149(92)90656-j. [DOI] [PubMed] [Google Scholar]
- 8.Munoz R, Marcus E, Palacio G, Gauvreau K, Wessel DL, Colan SD. Reconstruction of 3-dimensional right ventricular shape and volume from 3 orthogonal planes. J Am Soc Echocardiogr. 2000;13:177–85. doi: 10.1067/mje.2000.103108. [DOI] [PubMed] [Google Scholar]
- 9.Vogel M, Gutberlet M, Dittrich S, Hosten N, Lange PE. Comparison of transthoracic three-dimensional echocardiography with magnetic resonance imaging in the assessment of right ventricular volume and mass. Heart. 1997;78:127–30. doi: 10.1136/hrt.78.2.127. [DOI] [PMC free article] [PubMed] [Google Scholar]
- 10.Vogel M, White PA, Redington AN. In vitro validation of right ventricular volume measurement by three-dimensional echocardiography. Br Heart J. 1995;74:460–3. doi: 10.1136/hrt.74.4.460. [DOI] [PMC free article] [PubMed] [Google Scholar]
- 11.Jiang L, Siu SC, Handschumacher MD, Luis Guererro J, Vazquez de Prada JA, King ME, et al. Three-dimensional echocardiography. In vivo validation for right ventricular volume and function. Circulation. 1994;89:2342–50. doi: 10.1161/01.cir.89.5.2342. [DOI] [PubMed] [Google Scholar]
- 12.Jiang L, Handschumacher MD, Hibberd MG, Siu SC, King ME, Weyman AE, et al. Three-dimensional echocardiographic reconstruction of right ventricular volume: in vitro comparison with two-dimensional methods. J Am Soc Echocardiogr. 1994;7:150–8. doi: 10.1016/s0894-7317(14)80120-x. [DOI] [PubMed] [Google Scholar]
- 13.Pini R, Giannazzo G, Di Bari M, Innocenti F, Rega L, Casolo G, et al. Transthoracic three-dimensional echocardiographic reconstruction of left and right ventricles: in vitro validation and comparison with magnetic resonance imaging. Am Heart J. 1997;33:221–9. doi: 10.1016/s0002-8703(97)70212-6. [DOI] [PubMed] [Google Scholar]
- 14.Nesser HJ, Tkalec W, Patel AR, Masani ND, Niel J, Markt B, et al. Quantitation of right ventricular volumes and ejection fraction by three-dimensional echocardiography in patients: comparison with magnetic resonance imaging and radionuclide ventriculography. Echocardiography. 2006;23:666–80. doi: 10.1111/j.1540-8175.2006.00286.x. [DOI] [PubMed] [Google Scholar]
- 15.Nabeel H. Optimal assessment of right ventricular size and function by real-time 3D echocardiography: comparison to cardiac magnetic resonance imaging. Circulation. 2004;110 (Suppl. III-570) [Google Scholar]
- 16.Prakash K, Li X, Hejmadi A, Hashimoto I, Sahn DJ. Determination of asymmetric cavity volumes using real-time three-dimensional echocardiography: an in vitro Balloon Model Study. Echocardiography. 2004;21:257–63. doi: 10.1111/j.0742-2822.2004.03071.x. [DOI] [PubMed] [Google Scholar]
- 17.Gopal AS, Chukwu EO, Iwuchukwu CJ, Katz AS, Toole RS, Schapiro W, et al. Normal values of right ventricular size and function by real-time 3-dimensional echocardiography: comparison with cardiac magnetic resonance imaging. J Am Soc Echocardiogr. 2007;20:445–55. doi: 10.1016/j.echo.2006.10.027. [DOI] [PubMed] [Google Scholar]
- 18.Bland JM, Altman DG. Statistical methods for assessing agreement between two methods of clinical measurement. Lancet. 1986;1:307–10. [PubMed] [Google Scholar]
- 19.Bashore TM. Right ventricular volumes are rarely right and are right hard to do. Catheter Cardiovasc Interv. 2004;62:52–5. doi: 10.1002/ccd.20034. [DOI] [PubMed] [Google Scholar]
- 20.Sheehan FH, Bolson EL. Measurement of right ventricular volume from biplane contrast ventriculograms: validation by cast and three-dimensional echo. Catheter Cardiovasc Interv. 2004;62:46–51. doi: 10.1002/ccd.20003. [DOI] [PubMed] [Google Scholar]
- 21.Daou D, Van Kriekinge SD, Coaguila C, Lebtahi R, Fourme T, Sitbon O, et al. Automatic quantification of right ventricular function with gated blood pool SPECT. J Nucl Cardiol. 2004;11:242–4. doi: 10.1016/j.nuclcard.2004.01.008. [DOI] [PubMed] [Google Scholar]
- 22.Grothues F, Moon JC, Bellenger NG, Smith GS, Klein HU, Pennell DJ. Interstudy reproducibility of right ventricular volumes, function, and mass with cardiovascular magnetic resonance. Am Heart J. 2004;147:218–23. doi: 10.1016/j.ahj.2003.10.005. [DOI] [PubMed] [Google Scholar]
- 23.Koch K, Oellig F, Oberholzer K, Bender P, Kunz P, Mildenberger P, et al. Assessment of right ventricular function by 16-detector-row CT: comparison with magnetic resonance imaging. Eur Radiol. 2005;15:312–8. doi: 10.1007/s00330-004-2543-6. [DOI] [PubMed] [Google Scholar]
- 24.Fujimoto S, Mizuno R, Nakagawa Y, Dohi K, Nakano H. Estimation of the right ventricular volume and ejection fraction by transthoracic three-dimensional echocardiography. A validation study using magnetic resonance imaging. Int J Card Imaging. 1998;14:385–90. doi: 10.1023/a:1006117321095. [DOI] [PubMed] [Google Scholar]
- 25.Aebischer NM, Czegledy F. Determination of right ventricular volume by two-dimensional echocardiography with a crescentic model. J Am Soc Echocardiogr. 1989;2:110–8. doi: 10.1016/s0894-7317(89)80073-2. [DOI] [PubMed] [Google Scholar]
- 26.Kaul S, Tei C, Hopkins JM, Shah PM. Assessment of right ventricular function using two-dimensional echocardiography. Am Heart J. 1984;107:526–31. doi: 10.1016/0002-8703(84)90095-4. [DOI] [PubMed] [Google Scholar]
- 27.Cheitlin MD, Alpert JS, Armstrong W, Aurigemma GP, Beller GA, Bierman FZ, et al. ACC/AHA guidelines for the clinical application of echocardiography. Circulation. 1997;95:1686–744. doi: 10.1161/01.cir.95.6.1686. [DOI] [PubMed] [Google Scholar]


