

Abstract
We report the use of individual gold nanorods as plasmonic transducers to detect the binding of streptavidin to individual biotin-conjugated nanorods in real time on a surface. Label-free detection at the single-nanorod level was performed by tracking the wavelength shift of the nanorod-localized surface plasmon resonant scattering spectrum using a dark-field microspectroscopy system. The lowest streptavidin concentration that was experimentally measured was 1 nM, which is a factor of 1000-fold lower than the previously reported detection limit for streptavidin binding by biotinylated single plasmonic nanostructures. We believe that the current optical setup is able to reliably measure wavelength shifts as small as 0.3 nm. Binding of streptavidin at 1 nM concentration induces a mean resonant wavelength shift of 0.59 nm suggesting that we are currently operating at close to the limit of detection of the system.
Herein, we report the binding of a protein to its ligand that is immobilized on a single gold nanorod in real time as proof-of-concept of a localized surface plasmon resonance (LSPR) biosensor that is miniaturized to the dimensions of a single gold nanorod. This nanosensor is based upon the LSPR behavior of noble metal nanostructures that enables optical transduction of binding events at their surface into an optical signal.1–5 LSPR arises from the resonant oscillation of conduction electrons on the surface of noble metal nanostructures. The energy associated with this optical resonance is a function of the nanoparticle composition, size, shape, and surrounding dielectric environment.6–11 Plasmonic nanostructures exhibit a characteristic LSPR spectrum with one or more peaks corresponding to specific electron oscillation resonances. The LSPR peak location and intensity are sensitive to the local refractive index surrounding the nanoparticle, which is altered by the binding of biomolecular targets to receptor-functionalized nanostructures, and forms the basis of their utility as label-free biosensors.12
We have previously shown that this transduction modality allows label-free, optical biomolecular detection in a chip-based format;13,14 this ensemble approach has also been validated by other groups.15–20 Most work on LSPR biosensors, to date, has been based on interrogation of an ensemble of nanoparticles. In an effort to push this technology to its limits, we report here the use of single plasmonic nanostructures as transducers of biomolecular binding events, with the ultimate goal of single-molecule detection of proteins (and other biomolecules) from complex mixtures. We note that the ability to detect single molecules will not, per se, provide a gain in sensitivity as defined by the lowest concentration of the analyte that can be detected, primarily because of mass transport limitations.21–23 Indeed, Raschke et al., showed streptavidin detection by individual biotinylated gold nanospheres,24 but the concentration detection limit reported in that study was only 1 μM, in contrast to the nanomolar streptavidin detection limits reported for similar nanoparticles when utilized in an ensemble mode sensor.14,18,25
Rather, miniaturizing the sensor to a single nanoparticle is of interest because it is a useful test of the limits of this technology for biosensing and also because it will provide a potentially useful biophysical tool for the interrogation of single binding events that is complementary to other transduction modalities under development for single-molecule, stochastic sensing.26–29 Another advantage of miniaturization of the transducer is that with concomitant miniaturization of the fluid handling system, sample volumes can be greatly reduced, which is likely to be important in the design of clinical diagnostics where analysis is constrained by the available sample volume (e.g., in neonatal diagnosis and archival samples) or by the high cost of reagents.
The plasmonic response of individual nanostructures such as gold nanoshells,30 silver spheres,31 and silver triangular prisms32 have been previously investigated in response to the self-assembly of alkanethiols on the surface of the noble metal nanostructures. We are aware of only two previous studies that have studied biosensing at the single-nanoparticle level: Raschke et al. used spherical gold nanoparticles functionalized with biotin to detect streptavidin binding at the 1 μM level24 and Rindzevicius et al. have reported LSPR shifts from single plasmonic nanoholes on a gold film in response to the binding of 15 μM neutravidin to biotin–BSA.33 To our knowledge, there have been no reports of specific biodetection using single plasmonic nanoparticles at analyte levels lower than 1 μM in concentration. Given that gold nanoparticle sensors can permit detection of biological analytes at subnanomolar concentration in an ensemble mode sensor,18,34 we sought to examine the limit of detection by a single metal nanoparticle acting as a transducer of biomolecular binding events.
EXPERIMENTAL SECTION
Materials
Hydrogen tetrachloroaurate trihydrate (HAuCl4), sodium borohydride, ascorbic acid, phosphate-buffered saline (PBS) tablets, and mercaptohexadecanoic acid (MHA) were purchased from Sigma. Glass coverslips, sodium citrate, glycerol, sodium hydroxide, ethanol, methanol, sodium chloride (NaCl), and hydrochloric acid were purchased from VWR. Cetyltrimethylammonium bromide (CTAB) was purchased from Fluka. (+)-biotinyl-3,6,9-trioxaundecanediamine (biotin-amine), D-biotin, 1-ethyl-3-(3-dimethylaminopropyl) carbodiimide (EDC), N-hydroxysuccinimide (NHS), and streptavidin were purchased from Pierce. Aminopropyltriethoxysilane (APTES) and mercaptopropyltriethoxysilane (MPTES) were purchased from Gelest. (1-Mercaptoundec-11-yl)tri(ethylene glycol) (EG3SH) was purchased from Prochimia. Distilled water purified by a reverse-osmosis filtration system (18 MΩ·cm, Pureflow Inc.) was used for all experiments.
Nanorod Synthesis
Gold nanorods were chemically synthesized by a seed-mediated growth procedure.35,36 Spherical gold seed particles were synthesized as follows: to a mixture of 7.5 mL of 0.1 M CTAB in water and 0.250 mL of 0.01 M HAuCl4, 0.6 mL of ice-cold 0.01 M NaBH4 was added under vigorous stirring. The yellow solution turned brown in color and was then stirred over gentle heat for a few minutes. Gold nanorods were synthesized in a water bath at 29 °C, as follows. To 95 mL of 0.1 M CTAB in water, 4 mL of 0.01 M HAuCl4, 0.6 mL of silver nitrate, and 0.64 mL of 0.1 M ascorbic acid were added. The mixture was swirled after the addition of each reactant to ensure mixing. An amount of 50 μL of gold seeds was added, the mixture was swirled and inverted, and then allowed to sit overnight, resulting in a purple-colored suspension of gold nanorods. Excess CTAB was removed from the gold rod suspension by centrifugation twice at 4500 rpm for 30 min. The gold nanorods were resuspended in water to a total volume of 10 mL and stored at room temperature until further use. The nanorod dimensions used in this study were 74 ± 9 nm in length and 33 ± 6 nm in diameter (n > 100) as measured by transmission electron microscopy (TEM) of the nanorods (Figure 1a).
Figure 1.

(a) TEM of gold nanorods used for biodetection experiments and (b) dark-field micrograph of gold nanorods immobilized on a glass substrate. (c) Scattering spectra of a single gold nanorod on a glass substrate (red) and the extinction spectrum of an ensemble of gold nanorods suspended in water (blue). Scale bar is 100 nm in (a) and 5 μm in (b).
Sample Preparation
Gold nanorods were immobilized onto 25 mm diameter, round no.1 glass coverslips in a manner similar to that previously reported to fabricate nanoparticle sensor chips.14 First, the coverglasses were cleaned by sonication for 20 min in a 1:1 HCl/methanol mixture. The coverslips were rinsed with ethanol, dried overnight at 65 °C, and were then incubated in a solution of 10% (v/v) MPTES in ethanol for 15 min. The coverslips were rinsed several times with ethanol, and then dried at 120 °C for 3 h. The nanorod suspension was first diluted in water to 1:15 (v/v), and a 20 μL aliquot of the suspension was pipetted onto the center of the coverglass and incubated for 10 s before being rinsed off with water. Interparticle spacing has been shown to be a function of nanoparticle concentration and incubation time.37 This nanorod concentration and incubation time has been empirically determined to produce nanorod chips with an average interparticle spacing of ~5 μm, which is ideal for interrogation of isolated nanorods by the microspectroscopy system because the diffraction-limited spots are separated enough as to not overlap. In order to compare single-nanoparticle measurements to previously reported ensemble measurements,14,18 glass slides treated with MPTES were incubated in nanorod suspension overnight.
Dark-Field Microspectroscopy
The foundation of the optical dark-field microscopy system is a Zeiss Axiovert 200 inverted microscope. The system employs an oil immersion ultra-dark-field condenser (numerical aperture = 1.2–1.4) and a 100× oil immersion Plan-neofluar (Zeiss) objective (adjustable numerical aperture, from 0.7 to 1.3). Illumination is provided by an integrated 100 W halogen source. A selectable output adapter is connected to the microscope’s camera port that allows the field of view to be imaged by either a color digital camera (Photometrics Cool-Snap cf) or a line-imaging spectrometer (Acton Research SpectraPro 2150i). The camera records the microscope’s field of view for coregistration with the spectrometer. Gold nanorods are identified within the field of view as diffraction-limited spots exhibiting a Lorentzian scattering spectrum. A programmable shutter is mounted internal to the spectrometer entrance slit and was set at 150 μm to ensure that the entire diffraction pattern from a nanorod was imaged within the slit width. Further details of the optical setup have been reported previously.38 For time-resolved microspectroscopy measurements, the gold nanorod chips were mounted in a flow cell (Bioptechs FCS3). All time-resolved measurements were taken under continuous flow conditions with a flow rate of approximately 1 μL/s, controlled by a peristaltic pump (Rainin, model RP-1). Temporal resolution of this microspectroscopy system is limited by spectral acquisition time, with a typical integration time of 10 s per spectrum for a single nanorod. All time-resolved microspectroscopy experiments employed a peak centroid-fitting algorithm for precise and efficient data processing.39 This algorithm performs a polynomial fit to the measured spectrum and then determines the centroid of the resonant scattering peak. This method offers increased precision in measuring LSPR shifts versus simply measuring the scattering peak wavelength and has been shown to yield a peak position precision of <5 × 10⁻⁴ nm for bulk ensemble measurements.39 Application of this technique to the single-nanoparticle microspectroscopy system described in this paper currently yields a fitting-limited peak measurement precision of 0.02 nm. The total experimental peak uncertainty is ~0.3 nm and is attributed to instrumental factors including spectrometer resolution, microscope focus control, and physical stability and analytical factors including spectral source correction, spatial averaging, and sample signal-to-noise ratio (S/N).40
Bulk RI Sensitivity Determination
The bulk refractive index sensitivity of a plasmonic nanostructure is defined as the wavelength shift of an LSPR peak in response to the change of the refractive index (RI) of the surrounding bulk medium in units of nm/RIU (RIU: refractive index unit). Single-nanoparticle bulk refractive index sensitivities are experimentally determined by the slope of a linear fit to a plot of LSPR peak wavelength versus surrounding RI. This parameter was determined by measuring the scattering spectrum from a single nanorod that was immobilized on glass in water and in solutions containing 20%, 40%, 60%, and 80% glycerol (OmniPur) (Figure 2).
Figure 2.
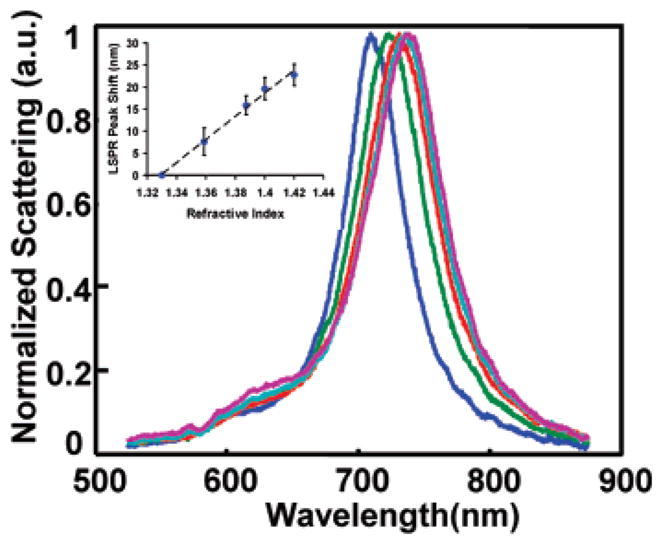
Normalized scattering spectra of a single gold nanorod as the refractive index of the surrounding medium is changed to 1.33 (blue), 1.36 (green), 1.38 (red), 1.40 (cyan), and 1.42 (purple). Inset shows a plot of LSPR peak shift vs surrounding RI for 15 nanorods (error bars represent the 95% confidence interval) yielding a fit with a slope of 262 nm/RIU.
Real-Time Spectroscopy
Real-time measurements using this microspectroscopy system under dynamic flow conditions were performed by immobilizing gold nanorods on an MPTES-treated coverglass mounted in a flow cell (Bioptechs FCS3). The scattering spectra were then recorded as a function of time as the medium surrounding the nanorods was exchanged. All time-resolved microspectroscopy experiments employed a peak centroid-fitting algorithm for precise and efficient data processing.39 Spectra were collected every 10 s in biotin–streptavidin binding experiments.
Biotin–Streptavidin Binding
First, centrifuged gold nano-rods were chemisorbed onto the MPTES-treated glass substrate. The immobilized nanorods were then incubated in an ethanol solution of 0.5 mM EG3SH and 0.5 mM MHA which forms a mixed self-assembled monolayer (SAM) with dual functionality: the MHA provides a moiety to which biotin-amine can be conjugated via EDC/NHS coupling and the EG3SH prevents nonspecific adsorption of protein molecules to the surface of the nanorod. The glass substrate was mounted in the flow cell of the microspectroscopy system, and the surface was activated by 10 min of incubation in a solution containing 0.4 M EDC and 0.1 M NHS followed by 5 min of water rinse. Subsequently, 1 mM biotin-amine in 1 mM biotin-amine in PBS buffer was flowed over the gold nanorods in situ for 2 h, followed by incubation of streptavidin solutions at various concentrations in PBS at a constant flow rate for 2 h.
To ensure the observed LSPR shifts result from specific interaction between biotin and streptavidin, controls were performed by incubating biotin-functionalized gold nanorods in streptavidin solutions (1 nM to 1 μM) that had been presaturated with excess (1 mM) free biotin. Control binding studies were performed identically as those described above except that presaturated streptavidin incubation was also performed in the presence of excess (1 mM) free biotin.
RESULTS AND DISCUSSION
We chose gold nanorods as plasmonic transducers of binding events for two primary reasons. First, we chose gold over silver, even though silver particles exhibit a higher bulk refractive index sensitivity than gold particles of the same shape and size,41 because the greater reactivity of silver as compared to gold makes it less suitable for use in biologically relevant media. Second, we chose nanorods over many other possible shapes because gold nanorods can be conveniently synthesized to exhibit plasmon bands with peak wavelengths ranging from 600 to 900 nm simply by tuning their aspect ratio and size through chemical synthesis methods.35
This wavelength range is attractive for optical biosensing for many reasons. Recent simulations by Miller and Lazarides have shown that the bulk refractive index sensitivity of the plasmon band is linearly correlated with the wavelength of the LSPR peak for particles of a specified composition42 so that nanoparticles with a plasmon band at higher wavelengths are more sensitive to their local environment than those at shorter wavelengths. In view of this finding, we chemically synthesized nanorods with dimensions of 74 nm × 33 nm (l × w) with a longitudinal plasmon band with a peak wavelength of 780 nm to maximize their sensitivity to their environment while remaining in the visible wavelength range (Figure 1a). The choice of rods with a scattering peak wavelength centered at ~780 nm is also advantageous because the background absorption and scattering of endogenous chromophores from biological mixtures (e.g., serum and blood) is minimal in this wavelength range.
Figure 1b shows a dark-field micrograph of nanorods immobilized on glass acquired on the microspectroscopy system. The dark-field micrograph shows diffraction-limited spots corresponding to light scattered by individual nanoparticles. Figure 1c shows a typical scattering spectrum of a single nanorod that is obtained on the dark-field microspectroscopy system and shows the high S/N of 80 and low full width at half-maximum (fwhm) of ~60 nm that is obtained for an isolated gold nanorod by single-particle spectroscopy with an acquisition time of 10 s. The fwhm of 60 nm of these nanorods is narrower than that of other nanostructures that also have a plasmon band in this wavelength range such as gold nanoshells,43 which allows for more accurate determination of peak shifts, and is a useful spectral feature of these nanorods as plasmonic transducers.
This figure also highlights an important spectroscopic advantage (albeit at the cost of more complex instrumentation), by comparing the scattering spectrum of a single immobilized gold nanorod (Figure 1c, red curve) with the extinction spectrum of an ensemble of ~108 nanorods from the same synthesis batch immobilized on glass (Figure 1c, blue curve), as measured by a UV–vis spectrophotometer (Cary 300-Bio). The ensemble spectrum exhibits heterogeneous broadening compared to the single Lorentzian peak observed for each resonance of a single nanoparticle. This broadening is simply due to the fact that even the most careful chemical synthesis will yield nanoparticles with a distribution of size and shapes, and as the LSPR behavior of a nanoparticle is strongly dependent upon these structural parameters, this structural inhomogeneity leads to a broadening of the ensemble LSPR peaks. Additionally, the location and amplitude of smaller scattering peaks corresponding to plasmonic resonances other than the longitudinal resonance of the nanorod are observed. The location and magnitude of these minor peaks has been shown to be highly dependent on nanorod end cap geometry and thus tends to vary widely between chemically synthesized nanorods.44
The bulk refractive index sensitivity was determined as shown in the inset to Figure 2. The sensitivity of the rods used in this study was 261.7 ± 26.9 nm/RIU (n = 15). This value determined by single nanorod measurements is in good agreement with the previously reported sensitivity of 252 nm/RIU from an ensemble of gold nanorods with the same nominal dimensions.18 These data highlight that rods are attractive as optical transducers that work in a wavelength sensing mode, because their mean bulk refractive index sensitivity of 262 nm/RIU is significantly greater than that of 39 nm diameter gold spheres25 (70 nm/RIU), and gold nanoshells (~140 nm/RIU)30 that have a similar wavelength maximum of the plasmon band around 700 nm.
The large variability noted in refractive index sensitivity is believed to be caused by several reasons. The largest variations are a result of nanoparticle size variations resulting from the chemical synthesis technique. These geometric variations result in a corresponding distribution of nanoparticle sensitivities since nanoparticle sensitivity has been shown to be directly correlated to LSPR wavelength42 and LSPR wavelength is directly determined by nanoparticle shape.8–11,45,46 Additionally, remaining CTAB on the surface of some of the nanorods could affect the measured sensitivity of the nanorod. CTAB was rinsed from the nanorod suspensions by centrifugation and resuspension. If additional rinse cycles were performed, the nanorods would aggregate and fall out of suspension.18 Thus, a critical amount of CTAB is required to keep the nanorods in stable suspension. We believe that small amounts of CTAB remain on some of the particles, restricting the active sensing volume accessible for sensitivity measurements as well as binding experiments.
Next, we investigated the binding of streptavidin to a biotin-functionalized gold nanorod. Figure 3, parts a and b, shows three representative spectra collected from a streptavidin binding experiment. The first spectrum was collected before conjugating biotin to the nanorods, and the second spectrum was collected after biotin was conjugated to the nanorods. The first two spectra are useful diagnostics of the efficiency of biotin conjugation to a gold nanorod. From previously reported ensemble studies, it has been observed that successful biotin conjugation onto nanorods increases the refractive index surrounding the nanoparticles and induces a reproducible red shift in the LSPR peak18,25 The 5.6 nm shift observed after biotin conjugation indicates successful coupling of the biotin to the nanorod. The third spectrum was collected after the nanorod was incubated in a solution of 130 nM streptavidin. The resulting 5.2 nm shift indicated that streptavidin binding occurred on the surface of the biotinylated nanorod. We conclude that the nanorod sensor saturated at this concentration because incubation with higher concentrations of streptavidin resulted in identical LSPR shifts (data not shown).
Figure 3.
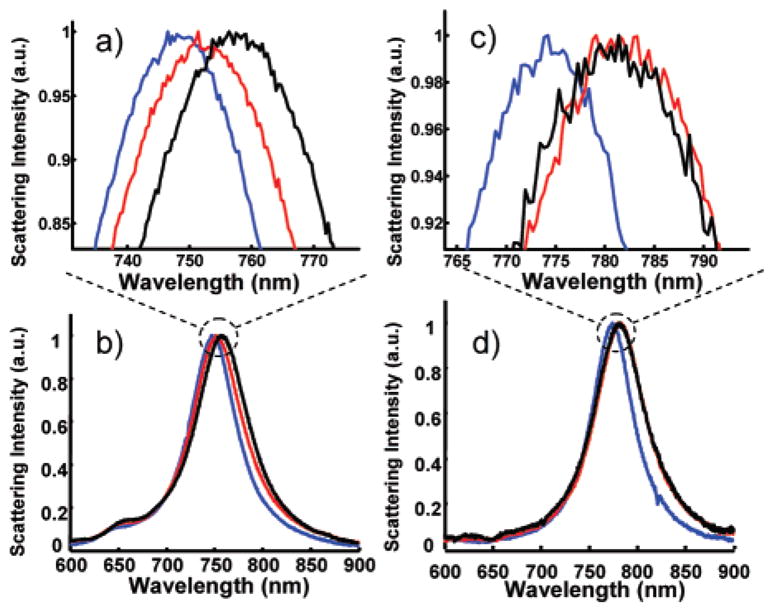
(a and b) Scattering spectra of a single gold nanorod after sequential incubation in EG3SH/MHA (blue), biotin (red), and 10 nM streptavidin (black). (c and d) Scattering spectra of a single gold nanorod in EG3SH/MHA (blue), biotin (red), and 100 nM streptavidin presaturated with free biotin (black).
In order to probe the system detection limit, measurements were taken of biotinylated gold nanorods in streptavidin concentrations of 130, 10, and 1 nM. A mean LSPR centroid shift of 5.29 ± 1.47 nm (95% CI, n = 9) was observed upon introduction of the 130 nM streptavidin solution. An LSPR peak centroid shift of 1.22 ± 0.24 nm (95% CI, n = 8) was measured from 10 nM streptavidin and 0.588 ± 0.32 nm (95% CI, n = 9) for 1 nM streptavidin.
Figure 3, parts c and d, shows the results of a control experiment using biotin-saturated streptavidin. The spectra shown are of a single gold nanorod before biotin conjugation, after biotin conjugation, and after incubation with biotin-saturated streptavidin. The characteristic ~5 nm LSPR shift resulting from the biotin coupling was observed, consistent with the previous experiment, which indicated that biotin was successfully conjugated to the gold nanorods. However, there was no further shift in the LSPR peak centroid upon incubation with the biotin-saturated streptavidin, which clearly demonstrated that the saturation of biotin-binding sites on the streptavidin prevents binding of streptavidin to the biotin-functionalized nanoparticle surface. These results also suggest that the mixed SAM on the nanorod surface successfully prevented nonspecific adsorption of streptavidin because the streptavidin molecules did not nonspecifically adsorb to the nanorods when their biotin-binding sites were blocked. Together, these results strongly suggest that the measured LSPR shifts observed for streptavidin binding to the biotin-functionalized nanorods are caused by molecular recognition of biotin by streptavidin.
Next, the time-resolved spectral acquisition mode of the microspectroscopy system was used to measure the kinetics of streptavidin binding to biotin-conjugated nanorods. Figure 4 shows a plot of the LSPR scattering peak centroid versus time for single biotin-conjugated nanorods incubated in 130, 10, and 1 nM streptavidin. A rapid 5.10 nm shift in the LSPR scattering peak centroid was observed upon introduction of the 130 nM streptavidin solution. After rinsing with PBS at time t = 100 min, the peak centroid location remained constant, which demonstrated the irreversibility of the biotin–streptavidin binding and is consistent with the long (~35 h) half-life of the biotin–streptavidin bond.47,48 A steady-state LSPR peak centroid shift of 1.09 nm was observed for streptavidin binding at a concentration of 10 nM. Finally, a shift of 0.48 nm was observed from a biotin-conjugated nanorod after incubation in streptavidin concentration of 1 nM. This shift is close to the limit of detection of this system, which we estimate to be ~0.3 nm.40
Figure 4.
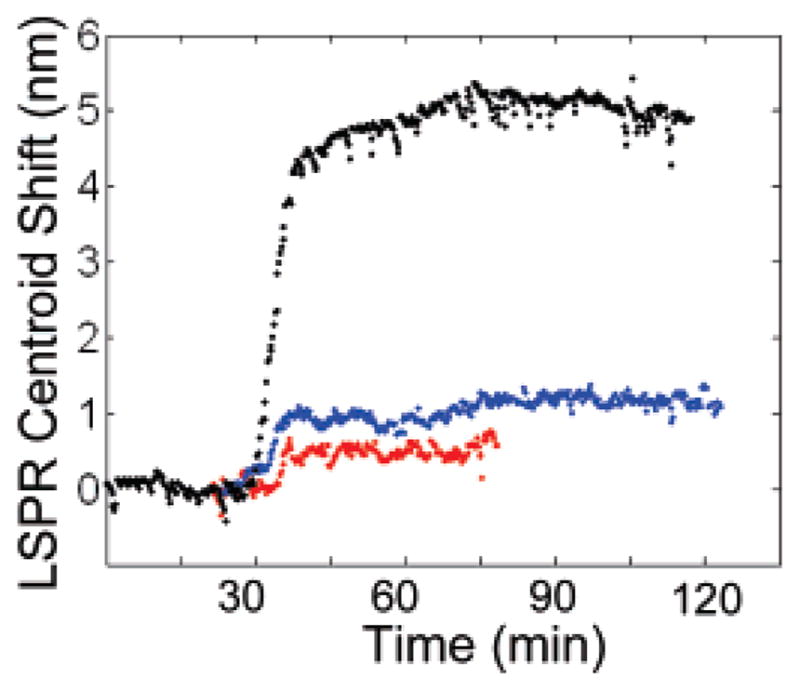
Real-time measurement of the LSPR scattering peak centroid shifts of single biotin-conjugated gold nanorods incubated in 130 (black), 10 (blue), and 1 nM (red) streptavidin in PBS.
CONCLUSION
We believe that this paper represents an advance in the field of plasmonic biosensors for three reasons. First, we report detection of streptavidin at a concentration of 1 nM, which is a factor of 1000-fold lower than the previously reported minimum detectable streptavidin concentration by single plasmonic nanostructures.24 The steady-state binding of 1 nM streptavidin corresponds to a mean LSPR peak shift of approximately 0.59 nm, and we estimate the current limit of detection at 0.3 nm. Second, we show the advantages that single-nanostructure experiments have over ensemble measurements that offer similar limits of detection in terms of concentration of analyte. This is because ensemble experiments utilizing a conventional spectrophotometer with a beam illumination area of 1 mm2 provide an averaged signal from approximately 108 nanoparticles, making stochastic measurements virtually impossible. Finally, these single-nanorod measurements were carried out in kinetic mode, which is critical to developing this technology to the ultimate, and as yet unattained, goal of observing the dynamics of single-molecule binding events in real time on a single nanoparticle.
Acknowledgments
This work was supported by a Grant from the Centers for Disease Control (NCID; R01 CI-00097) to A.C. G.J.N. acknowledges the support of a graduate fellowship from the NIH through a Biotechnology Training Grant (GM8555) awarded to the Center of Biomolecular and Tissue Engineering at Duke University.
References
- 1.Yguerabide J, Yguerabide EE. Anal Biochem. 1998;262:157–176. doi: 10.1006/abio.1998.2760. [DOI] [PubMed] [Google Scholar]
- 2.Alivisatos P. Nat Biotechnol. 2004;22:47–52. doi: 10.1038/nbt927. [DOI] [PubMed] [Google Scholar]
- 3.Penn SG, He L, Natan MJ. Curr Opin Chem Biol. 2003;7:609–615. doi: 10.1016/j.cbpa.2003.08.013. [DOI] [PubMed] [Google Scholar]
- 4.Iqbal SS, Mayo MW, Bruno JG, Bronk BV, Batt CA, Chambers JP. Biosens Bioelectron. 2000;15:549–578. doi: 10.1016/s0956-5663(00)00108-1. [DOI] [PubMed] [Google Scholar]
- 5.Storhoff JJ, Elghanian R, Mucic RC, Mirkin CA, Letsinger RL. J Am Chem Soc. 1998;120:1959–1964. [Google Scholar]
- 6.Mie G. Ann Phys. 1908;25:377–445. [Google Scholar]
- 7.Yguerabide J, Yguerabide EE. Anal Biochem. 1998;262:137–156. doi: 10.1006/abio.1998.2759. [DOI] [PubMed] [Google Scholar]
- 8.Kelly KL, Coronado E, Zhao LL, Schatz GC. J Phys Chem B. 2003;107:668–677. [Google Scholar]
- 9.Khlebtsov NG, Trachuk LA, Mel’nikov AG. Opt Spectrosc. 2005;98:77–83. [Google Scholar]
- 10.Mock JJ, Barbic M, Smith DR, Schultz DA, Schultz S. J Chem Phys. 2002;116:6755–6759. [Google Scholar]
- 11.Mock JJ, Smith DR, Schultz S. Nano Lett. 2003;3:485–491. [Google Scholar]
- 12.Englebienne P. Analyst. 1998;123:1599–1603. doi: 10.1039/a804010i. [DOI] [PubMed] [Google Scholar]
- 13.Nath N, Chilkoti A. J Fluoresc. 2004;14:377–389. doi: 10.1023/b:jofl.0000031819.45448.dc. [DOI] [PubMed] [Google Scholar]
- 14.Nath N, Chilkoti A. Anal Chem. 2002;74:504–509. doi: 10.1021/ac015657x. [DOI] [PubMed] [Google Scholar]
- 15.Haes AJ, Stuart DA, Nie SM, Van Duyne RP. J Fluoresc. 2004;14:355–367. doi: 10.1023/b:jofl.0000031817.35049.1f. [DOI] [PubMed] [Google Scholar]
- 16.Frederix F, Friedt JM, Choi KH, Laureyn W, Campitelli A, Mondelaers D, Maes G, Borghs G. Anal Chem. 2003;75:6894–6900. doi: 10.1021/ac0346609. [DOI] [PubMed] [Google Scholar]
- 17.Dahlin A, Zach M, Rindzevicius T, Kall M, Sutherland DS, Hook F. J Am Chem Soc. 2005;127:5043–5048. doi: 10.1021/ja043672o. [DOI] [PubMed] [Google Scholar]
- 18.Marinakos SM, Chen S, Chilkoti A. Anal Chem. 2007;79:5278–5283. doi: 10.1021/ac0706527. [DOI] [PubMed] [Google Scholar]
- 19.Fujiwara K, Watarai H, Itoh H, Nakahama E, Ogawa N. Anal Bioanal Chem. 2006;386:639–644. doi: 10.1007/s00216-006-0559-2. [DOI] [PubMed] [Google Scholar]
- 20.Chen CD, Cheng SF, Chau LK, Wang CRC. Biosens Bioelectron. 2007;22:926–932. doi: 10.1016/j.bios.2006.03.021. [DOI] [PubMed] [Google Scholar]
- 21.Gervais T, Jensen KF. Chem Eng Sci. 2006;61:1102–1121. [Google Scholar]
- 22.Dejardin P, Vasina EN. Colloids Surf, B. 2004;33:121–127. [Google Scholar]
- 23.Nair PR, Alam MA. Appl Phys Lett. 2006;88:233120–233123. [Google Scholar]
- 24.Raschke G, Kowarik S, Franzl T, Sonnichsen C, Klar TA, Feldmann J, Nichtl A, Kurzinger K. Nano Lett. 2003;3:935–938. [Google Scholar]
- 25.Nath N, Chilkoti A. Anal Chem. 2004;76:5370–5378. doi: 10.1021/ac049741z. [DOI] [PubMed] [Google Scholar]
- 26.Cui Y, Wei QQ, Park HK, Lieber CM. Science. 2001;293:1289–1292. doi: 10.1126/science.1062711. [DOI] [PubMed] [Google Scholar]
- 27.Gu LQ, Braha O, Conlan S, Cheley S, Bayley H. Nature. 1999;398:686–690. doi: 10.1038/19491. [DOI] [PubMed] [Google Scholar]
- 28.Besteman K, Lee JO, Wiertz FGM, Heering HA, Dekker C. Nano Lett. 2003;3:727–730. [Google Scholar]
- 29.Bayley H, Martin CR. Chem Rev. 2000;100:2575–2594. doi: 10.1021/cr980099g. [DOI] [PubMed] [Google Scholar]
- 30.Raschke G, Brogl S, Susha AS, Rogach AL, Klar TA, Feldmann J, Fieres B, Petkov N, Bein T, Nichtl A, Kurzinger K. Nano Lett. 2004;4:1853–1857. [Google Scholar]
- 31.McFarland AD, Van Duyne RP. Nano Lett. 2003;3:1057–1062. [Google Scholar]
- 32.Sherry LJ, Jin RC, Mirkin CA, Schatz GC, Van Duyne RP. Nano Lett. 2006;6:2060–2065. doi: 10.1021/nl061286u. [DOI] [PubMed] [Google Scholar]
- 33.Rindzevicius T, Alaverdyan Y, Dahlin A, Hook F, Sutherland DS, Kall M. Nano Lett. 2005;5:2335–2339. doi: 10.1021/nl0516355. [DOI] [PubMed] [Google Scholar]
- 34.Haes AJ, Van Duyne RP. J Am Chem Soc. 2002;124:10596–10604. doi: 10.1021/ja020393x. [DOI] [PubMed] [Google Scholar]
- 35.Nikoobakht B, El-Sayed MA. Chem Mater. 2003;15:1957–1962. [Google Scholar]
- 36.Jana NR, Gearheart L, Murphy CJ. Adv Mater. 2001;13:1389–1393. [Google Scholar]
- 37.Natan MJ, Grabar KC, Smith PC, Musick MD, Davis JA, Walter DG, Jackson MA, Guthrie AP. J Am Chem Soc. 1996;118:1148–1153. [Google Scholar]
- 38.Curry A, Nusz G, Chilkoti A, Wax A. Opt Express. 2005;13:2668–2677. doi: 10.1364/opex.13.002668. [DOI] [PubMed] [Google Scholar]
- 39.Dahlin AB, Tegenfeldt JO, Hook F. Anal Chem. 2006;78:4416–4423. doi: 10.1021/ac0601967. [DOI] [PubMed] [Google Scholar]
- 40.Curry A, Nusz G, Chilkoti A, Wax A. Appl Opt. 2007;46:1931–1939. doi: 10.1364/ao.46.001931. [DOI] [PubMed] [Google Scholar]
- 41.Chumanov G, Sokolov K, Gregory BW, Cotton TM. J Phys Chem. 1995;99:9466–9471. [Google Scholar]
- 42.Miller MM, Lazarides AA. J Phys Chem B. 2005;109:21556–21565. doi: 10.1021/jp054227y. [DOI] [PubMed] [Google Scholar]
- 43.Hafner JH, Nehl CL, Grady NK, Goodrich GP, Tam F, Halas NJ. Nano Lett. 2004;4:2355–2359. [Google Scholar]
- 44.Prescott SW, Mulvaney P. J Appl Phys. 2006;99:123504/1–123504/4. [Google Scholar]
- 45.Zhu J. Phys Lett A. 2005;339:466–471. [Google Scholar]
- 46.Link S, El-Sayed MA. Int Rev Phys Chem. 2000;19:409–453. [Google Scholar]
- 47.Chilkoti A, Stayton PS. J Am Chem Soc. 1995;117:10622–10628. [Google Scholar]
- 48.Stayton PS, Freitag S, Klumb LA, Chilkoti A, Chu V, Penzotti JE, To R, Hyre D, Le Trong I, Lybrand TP, Stenkamp RE. Biomol Eng. 1999;16:39–44. doi: 10.1016/s1050-3862(99)00042-x. [DOI] [PubMed] [Google Scholar]