Abstract
A cell pellet biophantom technique is introduced, and applied to the ultrasonic backscatter coefficient (BSC) estimate using Chinese hamster ovary (CHO) cells. Also introduced is a concentric sphere scattering model because of its geometrical similarities to cells with a nucleus. BSC comparisons were made between the concentric sphere model and other well-understood models for mathematical verification purposes. BSC estimates from CHO cell pellet biophantoms of known number density were performed with 40 and 80 MHz focused transducers (overall bandwidth: 26–105 MHz). These biophantoms were histologically processed and then evaluated for cell viability. Cell pellet BSC estimates were in agreement with the concentric sphere model. Fitting the model to the BSC data yielded quantitative values for the outer sphere and inner sphere. The radius of the cell model was 6.8±0.7 μm; the impedance of the cytoplasm model was 1.63±0.03 Mrayl and the impedance of the nuclear model was 1.55±0.09 Mrayl. The concentric sphere model appears as a new tool for providing quantitative information on cell structures and will tend to have a fundamental role in the classification of biological tissues.
INTRODUCTION
Recent developments in ultrasonic imaging techniques involve model-based approaches to quantify and thus display tissue anatomic features (Mamou et al., 2006). Quantitative ultrasound (QUS) model-based imaging identifies, quantifies and displays tissue features that are intended to relate to histopathologic properties and thus may have the potential to classify (diagnosis) pathologies. QUS quantifies tissue properties such as the size, shape, number density and acoustic impedance by examining the frequency-dependent information of the radio frequency (RF) echo signals backscattered from biological tissues. In that perspective, the backscatter coefficient (BSC) is a frequency-dependent quantity from which different tissue property parameters can be derived. In order to extract these properties from the RF echo signals, an understanding of ultrasonic scattering sites in tissues is essential. In QUS, prior assumptions about the nature of scattering structure must be made in order to quantitatively estimate tissue parameters (Mamou et al., 2008). However, in most tissues the structures responsible for scattering remain unknown, which limits the scientific basis for validating current hypotheses or choosing a model for QUS applications (Mamou et al., 2008).
There have been efforts in understanding via models the scattering structures and the mechanisms of cell scattering. Several models including spherical Gaussian model, fluid-filled sphere model and concentric sphere model have been examined (Oelze and O’Brien, 2006). In particular, the application of the earlier concentric sphere model suggested that scattering from cells had the potential to be more appropriately modeled. The earlier concentric sphere model is a bit different from that proposed herein; in the earlier model, the outer sphere (cytoplasm region) was modeled with a spatially varying impedance and the inner sphere (nuclear region) was modeled with a spatially homogeneous impedance. Speed and density were not included in the model. For the new model, both the inner and outer spheres are modeled individually with their own spatially uniform speed and density values (McNew et al., 2009).
The principal concept is for a model or models to fit the anatomic structure of interest wherein the model-based BSC matches the experimentally derived BSC. To evaluate the new concentric sphere model, a unique biophantom is developed that contains Chinese hamster ovary (CHO) cells, and then the BSC estimate from the biophantom is compared with the new concentric sphere model BSC. The study is considered unique wherein this may be the first time that a model similar in geometry to a biological cell is evaluated experimentally with cell-based biophantoms.
CONCENTRIC SPHERE BACKSCATTER COEFFICIENT
BSC theory
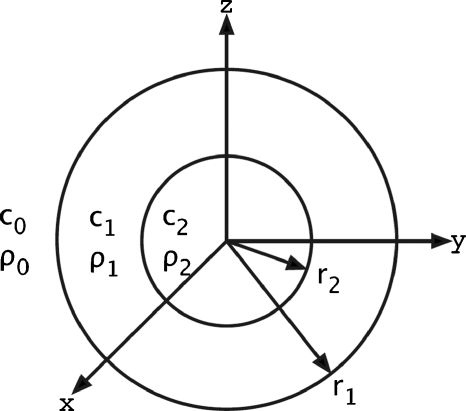
Consider a plane wave incident on a scattering volume composed of two concentric fluid spheres centered at the origin of a coordinate system (Fig. 1); the media are fluids. At an observation point r, the acoustic pressure scattered from the two concentric spheres is known (McNew et al., 2009) and given by
| (1) |
where Po is the amplitude of the incident pressure, Pm is the Legendre polynomial, μ=cos(θ), is the spherical Hankel function of the first kind, ko and αo are the wave number and the attenuation relative to the background medium, and Am results from the system of equations given by the boundary conditions of continuity of pressure and radial velocity at the two interfaces; these coefficients mainly depend on the propagation speeds and densities of the three fluid media (inner sphere, outer sphere and background) and the radii of the two spheres.
Figure 1.
Physical properties of two concentric spheres. The infinite (background) medium has density ρo and sound speed co. The outer sphere has density ρ1, sound speed c1 and radius r1. The inner sphere has density ρ2, sound speed c2 and radius r2. The respective impedances are: Zo=ρoco, Z1=ρ1c1 and Z2=ρ2c2. All three media (inner sphere, outer sphere and background) are modeled as spatially homogeneous fluids.
The average differential cross section per unit volume is defined for large observation distances to the direction θ as the power scattered into a unit solid angle divided by the product of the incident intensity [proportional to the magnitude squared of Eq. 1] and the scattering volume V (Insana et al., 1990). The BSC corresponds to the average differential cross section per unit volume in the direction to the incident wave, the backscattered direction. The BSC given by two concentric fluid spheres (functioning as a single scattering unit in a fluid medium) can be written as
| (2) |
Assuming the coherent field is not taken into account (waves do not interfere), the total intensity is the sum of the individual intensities from a randomLy positioned ensemble of n scatterers, thus yielding
| (3) |
where the factor n∕V can be expressed as corresponding to the number density of the ensemble. Therefore, under the far-field assumption and by including Eq. 1 into Eq. 3, the theoretical BSC given by an ensemble of identical concentric fluid spheres can be computed.
If the ensemble has a known size distribution, the theoretical BSC can be generally computed by
| (4) |
where is the number of spheres per unit volume having radii between r1 and r1+dr1 and between r2 and r2+dr2 and where
| (5) |
Code verification
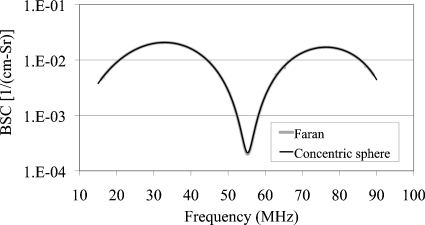
For code verification, the same values of radius, density and speed of sound for the inner and the outer spheres of the concentric sphere model were used to match against an existing model (Faran, 1951). The concentric sphere model is compared with the Faran model (Poisson ratio=0.4999 to model a fluid) for the condition r1=r2=10 μm, Z1=Z2=1.6 Mrayl (ρ1=ρ2=1.03 g∕mL, c1=c2=1550 m∕s) and Zo=1.5 Mrayl (ρo=1 g∕mL and co=1500 m∕s) (Fig. 2). Excellent agreement is shown with the Faran model wherein both curves are the same.
Figure 2.
Comparison of concentric sphere model BSC vs. frequency against the Faran model under similar conditions. For the Faran model, rsphere=10 μm, Zsphere=1.6 Mrayl (ρ=1.03 g∕mL and c=1550 m∕s), Zbackground=1.5 Mrayl (ρ=1 g∕mL and c=1500 m∕s) and Poisson’s ratio ν=0.4999 9. For the concentric sphere model, r1=r2=10 μm, Z1=Z2=1.6 Mrayl (ρ1=ρ2=1.03 g∕mL and c1=c2=1550 m∕s) and Zo=1.5 Mrayl (ρo=1 g∕mL and co=1500 m∕s). The number density n=20 million scatterers∕mL for the 2 models.
Size distribution of inner sphere
The theoretical BSC for a uniform size distribution of two concentric spheres was calculated from Eq. 4. During the different stages of the cell cycle, CHO cells vary in size. Measurements of 500 CHO cells (see Sec 3A) yielded the cell diameter to have a mean of 13.4 μm and a standard deviation of 1.7 μm, or a ±sd range of 11.7–15.1 μm, along with a nuclear diameter mean of 6.6 μm and a ±sd range of 5.3–7.9 μm. A one-to-one comparison of the 500 measured CHO cells yields for the ratio of the cell-to-nuclear diameter a mean of 2.1 and a standard deviation of 0.3 (overall range between 1.4 and 3.0). The size of the nucleus varies over twice more than the size of the cell. For computational simplification, therefore, a uniform size distribution of the inner sphere radius (keeping a constant outer sphere radius) was applied on the concentric sphere model, given by
| (6) |
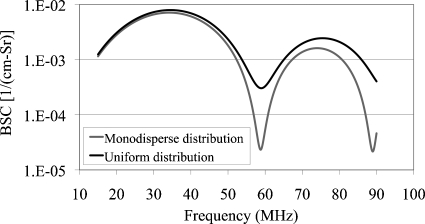
where N is the number of iterations of the computation and for i∊[1;N], r2i is the inner radius within the giving interval from the lowest value (r2l) to the highest value (r2N) of the inner radius. As an example, Fig. 3 shows the comparison of theoretical BSC vs. frequency for a uniform distribution on the inner sphere (r21=1 μm≤r2≤r2N=7 μm) and monodisperse distribution (r2=4 μm) for the concentric sphere model. Number of iterations was N=25. For both distributions, r1=10 μm, Z0=1.5 Mrayl (ρ0=1 g∕mL and c0=1500 m∕s), Z1=1.55 Mrayl (ρ1=1.01 g∕mL and c1=1535 m∕s), Z2=1.6 Mrayl (ρ2=1.03 g∕mL and c2=1550 m∕s). For example, BSC calculations for uniform and monodisperse distributions have similar maxima. However, the minimum value of uniform distribution BSC calculations is about 10 times higher than monodisperse distribution BSC estimates.
Figure 3.
Comparison of theoretical BSC vs. frequency for a uniform distribution on the inner sphere (1 μm≤r2≤7 μm) and monodisperse distribution (r2=4 μm) for the concentric sphere model. For both distributions, r1=10 μm, Z0=1.5 Mrayl (ρ0=1 g∕mL and c0=1500 m∕s), Z1=1.55 Mrayl (ρ1=1.01 g∕mL and c1=1535 m∕s), Z2=1.6 Mrayl (ρ2=1.03 g∕mL and c2=1550 m∕s) and number density n=20 million scatterers∕mL.
BSC MEASUREMENTS OF CHO CELL PELLETS
Biophantom construction
Chinese hamster ovary (CHO) cells (American Type Culture Collection (ATCC), Manassas, Virginia, USA) were cultured in an F-12K medium (ATCC, Manassas, Virginia, USA) along with 8.98% of fetal bovine serum (Hyclone Laboratories, Logan, Utah, USA) and 1.26% of antibiotic (Hyclone Laboratories, Logan, Utah, USA). A Reichert Bright-Line® hemacytometer (Hausser Scientific, Buffalo, New York, USA) was used to count viable cells to yield the number of CHO cells per known volume. Equal volumes of the dye Trypan Blue (HyClone Laboratories, Logan, Utah, USA) and cell suspension (CHO cells in F-12K medium) were gently mixed by pippetting and then added to the counting chambers of the hemacytometer. Trypan Blue was used to differentiate nonviable cells (stained as blue cells) from viable cells (stained as bright cells). At this point, each cell pellet had an average of over 90% live cell viability. A known number of viable cells was placed into a 50 mL centrifuge tube, centrifuged, and the supernatant was removed. 90 μL of bovine plasma (Sigma-Aldrich, St. Louis, Missouri, USA) were added to the cell sediment in the centrifuge tube, which was then vortexed. 60 μL of bovine thrombin (Sigma-Aldrich, St. Louis, Missouri, USA) were added, and the mixture was lightly agitated to coagulate. 0.5 mL of F-12K medium was added to submerse the newly formed pellet. The pellet was transferred to a 1.7 mL microcentrifuge tube that was sealed with Saran Wrap. The F-12K is heated to 37 °C prior to its use but other materials are handled at room temperature.
The following procedure was used to determine the size of the CHO cell line. The cells were washed with Dulbecco’s Phosphate Buffered Saline (Sigma-Aldrich, St. Louis, Missouri, USA) and covered with 0.25 % Trypsin-EDTA solution (Sigma-Aldrich, St. Louis, Missouri, USA). The cell culture flask is immediately placed onto an inverted microscope (Olympus CKX41, Optical Analysis Corporation, Nashua, NH, USA) with a microscope digital camera (Olympus DP20, Optical Analysis Corporation, Nashua, NH, USA). The cells are exposed to Trypsin-EDTA for 10 min at room temperature. At this point in time, the cells appear round and very loosely attached to the flask. Using the camera that is in sync with the microscope, multiple 20× TIF format pictures are taken at varying locations within the flask. Each image contains a 20 μm measure bar. Pictures are no longer taken once the flask has been exposed to Trypsin-EDTA for 18 min. The TIF images are opened using Adobe Photoshop CS3. Approximately 25–30 cells are numbered per image using the count tool. These cells are randomLy picked based on the criteria that they have a visibly defined cell outer boarder as well as a visibly defined nucleus. These cells are measured (in pixels) along the x and y axis of both the cell and the cell nucleus. The measurement of each parameter is obtained by using the ruler tool and recorded for analysis. The length of the 20 μm measure bar is also measured in pixels as a control. These measurements are taken for 500 samples of the same cell line, averaged, and converted from pixels to microns.
Biophantom scanning and data processing
The biophantoms were ultrasonically scanned using two single-element transducers (NIH High-frequency Transducer Resource Center, University of Southern California, Los Angeles, California USA; see Table 1). The transducers were driven using either a Panametrics 5900 pulser∕receiver (Panametrics, Waltham, Massachusetts, USA) or a UTEX UT340 pulser∕receiver (UTEX Scientific Instruments Inc., Mississauga, Ontario, Canada). The transducers were moved using a motion control system (Daedal Parker Hannifin Corporation, Irwin, Pennsylvania, USA) that has a linear spatial accuracy of 1 μm. The analog echo signal was processed using a 10-bit Agilent U1065A-002 A∕D card (Agilent Technologies, Santa Clara, California, USA) set to sample at 1 GHz. Scans were performed in a tank filled with degassed water having a temperature between 21.5 and 22.5 °C. To scan the CHO biophantoms, the transducer focus was positioned in the cell pellet. The focal volume was of sufficient length so that several regions of interest (ROIs) could be acquired and processed from each scan as shown on Fig. 4. Each cell pellet yielded 11 independent scans. Each scan was composed of either 100 or 200 RF echo signals for the 40 or 80 MHz transducer, respectively; each independent scan could yield a B-mode image if envelop detected. More RF signals were obtained at the higher center frequency because higher frequencies yield a weaker signal and consequently the BSC estimates at higher frequencies were somewhat noisier.
Table 1.
Transducer information and characteristics.
| Transducer center frequency (MHz) | −10 dB bandwidth (MHz) | Wavelength at the center frequency (μm) | F-number | Depth of field (mm) | Beam width (μm) | Acquisition step size (μm) |
|---|---|---|---|---|---|---|
| 40 | 26–65 | 37.5 | 3.0 | 2.4 | 112.5 | 60 |
| 80 | 49–105 | 18.8 | 3.0 | 1.2 | 56.4 | 30 |
Figure 4.
(a) An example of a B-mode image (b) that shows the selection of the ROIs extracted from a 40-MHz transducer acquisition. The location of transducer’s focus is indicated by the horizontal line at an axial distance of about 9.1 mm. In the ROI image, the lateral increments from one ROI to the next is 0.1118 mm (20% of the ROI lateral size), which corresponds to 1.8633 lateral pixel size. Because the lateral increment to pixel size ratio is a small noninteger, the ROI image does not have uniformLy located ROIs (the lateral increment of ROI can be 1 or 2 lateral pixel sizes), whereas the sizes of the ROIs are identical.
The BSCs were computed from the RF echo data using the method described in Chen et al. (1997). This method is designed to remove equipment dependent effects by dividing the power spectrum of the measured data by a reference spectrum. Reference signals were obtained using the specular reflection from Plexiglas placed at the transducer focus in degassed water. Plexiglas has a frequency-independent pressure reflection coefficient of 35% relative to 22 °C water. Cell pellet through-transmission attenuation estimates yielded values between 0.15 and 0.18 dB∕cm-MHz for CHO cell pellets with number densities of 1.3, 5 and 20 million cells∕mL (Mcells∕mL), attenuation values that were used to estimate BSCs.
To generate a BSC vs. frequency cell pellet estimate from a single transducer, (1) a BSC estimate is made for each ROI using an ensemble average of RF echo signals from that ROI, (2) these ROI BSCs from one of the 11 independent scans are averaged and then (3) the 11 BSCs are averaged.
The best fit to the concentric sphere model was performed by minimizing the sum of the squares of the difference between theoretical and experimental BSCs where the theoretical BSC was obtained from the concentric sphere model. A least-squares analysis was used to determine the parameters (r2,low, r2,high, r1, ρ1, ρ2, c1 and c2) that best agreed with the experimental response in the spectral domain. The problem of fitting multiple parameters was solved by the MATLAB nonlinear curve-fitting function “lsqcurvefit,” wherein the trust-region-reflective algorithm was used as the nonlinear data-fitting approach. Specifically, the boundary quantities were: r2,low=0 (low boundary), r2,low=5 μm (high boundary), r2,high=r2,low (low boundary), r2,high=5 μm+r2,low (high boundary), r1=r2,high (low boundary), r1=5 μm+r2,high (high boundary), ρ1=ρ2=0.8 g∕mL (low boundary), ρ1=ρ2=1.5 g∕mL (high boundary), c1=c2=1200 m∕s (low boundary), and c1=c2=2000 m∕s (high boundary). This procedure was applied for 3 cell pellets in the study, one for each number density. Signal analyses were performed using custom programs developed in MATLAB (The Mathworks Inc., Natick, Massachusetts, USA).
Biophantom evaluation
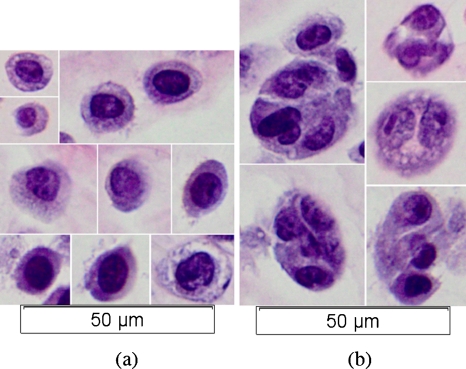
Immediately after scanning, the cell pellet was removed from the microcentrifuge tube, placed into a histology processing cassette and fixed by immersion in 10% neutral-buffered formalin (pH 7.2) for a minimum of 12 h for histopathologic processing. The pellet was then embedded in paraffin, mounted on glass slides and stained with hematoxylin and eosin (H&E) for routine microscopic (Olympus BX–51, Optical Analysis Corporation, Nashua, NH, USA) evaluation by a pathologist. Figure 5a shows a series of isolated cells. Concentric sphere geometry structure as well as cell and nuclear sizes are visible. Radii of the nuclei are between 3 and 5 μm and radii of cells are between 5 and 12 μm. But cells also form aggregates that have a radius ranging between 12 and 25 μm [Fig. 5b]. Because the general BSC expression is dependent on the radius of the scatterer (Insana and Hall, 1990), larger scatterers have a different backscattering response compared to smaller ones. The larger aggregates size and the nonconcentric sphere geometry of these aggregate structures will be at variance with BSC parameter estimations based on a single-cells concentric sphere geometry model.
Figure 5.
Optical microscope images (40×) of H&E stained CHO cells: (a) isolated cells, (b) clumped cells.
RESULTS AND DISCUSSION
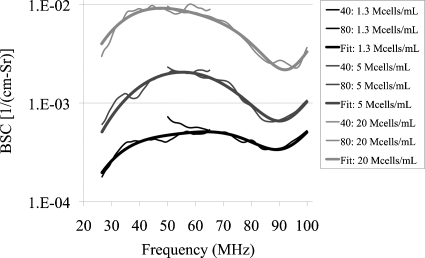
BSC estimates and best fit theoretical BSCs of the three number density cell pellets are shown in Fig. 6. The background medium was assumed to have an impedance Zo=1.5 Mrayl (ρo=1 g∕mL and co=1500 m∕s). High and low values of r2, the modeled nuclear radius, were determined because a uniform size distribution of the nucleus was assumed. For the other parameters (r1, ρ1, ρ2, c1 and c2), only one value was estimated from the least-squares analysis for each of the three number density CHO cell pellets (Table 2).
Figure 6.
Estimated BSC vs. frequency for CHO cell pellets of varying number densities of 1.3, 5 and 20 Mcells∕mL. Each estimated BSC is based on data acquired from 2 transducers: 40 MHz and 80 MHz. The thicker lines represent the fitted BSC relative to the concentric sphere model.
Table 2.
Summary of the estimated fit parameters given by the theoretical concentric sphere BSC calculations.
| Number density (Mcells∕mL) | Radius (μm) | Speed of sound (m∕s) | Density (g∕mL) | Impedance (Mrayl) | ||||
|---|---|---|---|---|---|---|---|---|
| Nucleus | Cell | Nucleus | Cytoplasm | Nucleus | Cytoplasm | Nucleus | Cytoplasm | |
| 1.3 | 0.04–4.83 | 7.19 | 1802 | 1952 | 0.80 | 0.85 | 1.44 | 1.66 |
| 5 | 0.26–5.26 | 6.03 | 1318 | 1837 | 1.21 | 0.88 | 1.60 | 1.61 |
| 20 | 1.74–5.86 | 7.32 | 1907 | 1810 | 0.84 | 0.90 | 1.60 | 1.63 |
Agreements of shape and magnitude between the theoretical and measured BSC demonstrate some consistency (Fig. 6). There is a consistent peak (crest) at about 55 MHz and a consistent peak (trough) at around 90 MHz for the three cell pellet concentrations. Minima and maxima BSCs are located at about the same frequencies. The magnitude of the BSC varies between 10−4 and 10−2 cm−1 Sr−1, suggesting that the cell pellets are considered weak scatterers. Further, BSC magnitudes are consistent with different number densities wherein it is noted that the BSC magnitude increases as the number density increases.
Estimated nuclear radii range between 0 and 6 μm, and cell radii range between 6 and 7 μm (Table 2). Size estimates agree well to those of CHO sizes (nuclear radii typically 2–4.6 μm and cell radii typically 5.7–8.3 μm). Estimated speed of sound and density of the nucleus are around 1800–1900 m∕s and 0.85 g∕mL (the nuclear impedance is around 1.55 Mrayl), and estimated speed of sound and density of the cytoplasm are around 1800–1900 m∕s and 0.85 g∕mL (the cytoplasm impedance is around 1.63 Mrayl).
These estimated parameter values are consistent with some of values from the literature. The estimated values of impedance of the nucleus and cytoplasm are close to the typical impedance values of tissues. The estimated speed of sound in both nucleus and cytoplasm agree with the values given by Bereiter-Hahn and Blasé (2004) for biological cells from 1600 to 1850 m∕s. The estimated speed of sound in the nucleus also agrees with the speed of sound in DNA (1830–2330 m∕s), Hakim et al., (1984), which makes sense because DNA is an important component of the nucleus. However, there is still debate in the literature on the speed of sound and density of the cytoplasm and nucleus. Taggart et al. (2007) evaluated acute myeloid leukemia cells, human epithelial kidney cells and their respective isolated nuclei, and reported that the speed of sound to be higher in whole cells (1522–1535 m∕s) than in isolated nuclei (1493–1514 m∕s) for all cases. Earlier, Baddour et al. (2005) had evaluated acute myeloid leukemia cells and deduced the density of the nucleus to be 1.43 g∕mL, greater than the bulk density of the whole cell of around 1.05 g∕mL. Our estimated values do not seem to agree well with these two studies. If those values from the two studies are in fact valid, then one explanation for the inconsistency between those values and our results might be that the BSC is not sensitive to the changes in speed of sound and nucleus. Nevertheless, further study of directly measuring the speed of sound and density in cytoplasm and nucleus is appreciated and needed for validating the two fluid concentric sphere model.
CONCLUSIONS
The backscatter coefficient from biological phantoms such as live cells is measurable and leads to consistent results. The comparison of the concentric sphere model with the experimental data from the cell samples shows remarkable agreements. The concentric sphere model appears as a new tool of providing quantitative information on cell structures and will tend to have a fundamental role in the classification of biological tissues.
ACKNOWLEDGMENTS
The authors would like to thank Saurabh Kukreti, Michael Kurowski, Matt Lee and Eugene Park from the University of Illinois at Urbana-Champaign for their assistance with data acquisitions and attenuation measurements. Appreciation for the high quality histopathology preparation is extended to Provena Medical Center Histology Laboratory. This work was supported by NIH Grant R01CA111289. Maxime Teisseire was also supported by École Centrale de Lille, Cité Scientifique, BP 48, 59651 Villeneuve d’Ascq Cedex, France.
References
- Baddour, R. E., Sherar, M. D., Hunt, J. W., Czarnota, G. J., and Kolios, M. C. (2005). “High-frequency ultrasound scattering from microspheres and single cells,” J. Acoust. Soc. Am. 117, 934–943. 10.1121/1.1830668 [DOI] [PubMed] [Google Scholar]
- Bereiter-Hahn, J., and Blasé, C. (2004). “Ultrasonic characterization of biological cells,” in Ultrasonic Non-Destructive Evaluation, edited by Kundu T. (CRC, Boca Raton, FL: ), Chap. 12, pp. 725–760. [Google Scholar]
- Chen, X., Phillips, D., Schwarz, K. Q., Mottley, J. G., and Parker, K. J. (1997). “The measurement of backscatter coefficient from a broadband pulse-echo system: A new formulation,” IEEE Trans. Ultrason. Ferroelectr. Freq. Control 44, 515–525. 10.1109/58.585136 [DOI] [PubMed] [Google Scholar]
- Faran, J. J., Jr. (1951). “Sound scattering by solid cylinders and spheres,” J. Acoust. Soc. Am. 23, 405–418. 10.1121/1.1906780 [DOI] [Google Scholar]
- Hakim, M. B., Lindsay, S. M., and Powell, J. (1984). “The speed of sound in DNA,” Biopolymers 23, 1185–1192. 10.1002/bip.360230704 [DOI] [PubMed] [Google Scholar]
- Insana, M. F., and Hall, T. J. (1990). “Parametric ultrasound imaging from backscatter coefficient measurements: Image formation and interpretation,” Ultrason. Imaging 12, 245–267. 10.1016/0161-7346(90)90002-F [DOI] [PubMed] [Google Scholar]
- Insana, M. F., Wagner, R. F., Brown, D. G., and Hall, T. J. (1990). “Describing small-scale structure in random media using pulse-echo ultrasound,” J. Acoust. Soc. Am. 87, 179–192. 10.1121/1.399283 [DOI] [PMC free article] [PubMed] [Google Scholar]
- Mamou, J., Oelze, M. L., O’Brien, W. D., Jr., and Zachary, J. F. (2006). “Perspective on biomedical quantitative ultrasound imaging,” IEEE Signal Process. Mag. 23, 112–116. 10.1109/MSP.2006.1628885 [DOI] [Google Scholar]
- Mamou, J., Oelze, M. L., O’Brien, W. D., Jr., and Zachary, J. F. (2008). “Extended three-dimensional impedance map methods for identifying ultrasonic scattering sites,” J. Acoust. Soc. Am. 123, 1195–1208. 10.1121/1.2822658 [DOI] [PMC free article] [PubMed] [Google Scholar]
- McNew, J., Lavarello, R., and O’Brien, W. D., Jr. (2009). “Sound scattering from two concentric fluid spheres,” J. Acoust. Soc. Am. 125, 1–4. 10.1121/1.3035901 [DOI] [PMC free article] [PubMed] [Google Scholar]
- Oelze, M. L. and O’Brien, W. D., Jr. (2006). “Application of three scattering models to characterization of solid tumors in mice,” Ultrason. Imaging 28, 83–96. [DOI] [PubMed] [Google Scholar]
- Taggart, L. R., Baddour, R. E., Giles, A., Czarnota, G. J., and Kolios, M. C. (2007). “Ultrasonic characterization of whole cells and isolated nuclei,” Ultrasound Med. Biol. 33, 389–401. 10.1016/j.ultrasmedbio.2006.07.037 [DOI] [PubMed] [Google Scholar]


