

Abstract
The neurochemical basis of dystonia is unknown. The purpose of this study was to assess the differences of the inhibitory neurotransmitter, GABA, in the sensorimotor cortex and the basal ganglia using MR Spectroscopy with optimized GABA sensitivity. 22 patients with focal hand dystonia and 22 healthy controls were studied. No significant differences in GABA were observed between groups in either the sensorimotor cortex or in the basal ganglia.
Introduction
Dystonia is characterized by various abnormalities of movement control with multiple clinically distinct forms1. Abnormalities of neurochemistry of the dystonias are poorly understood2. Some data indicate that Gamma Amino Butyric Acid (GABA) is an important agent in the pathogenesis of dystonia. In some animal models there is decreased GABA receptor binding or decreased parvalbumin-binding GABA neurons4. Physiologically, the application of bicuculine to the ventral premotor area of awake monkeys performing volitional tasks produces co-contraction that characterizes dystonia, while application of GABA produces improvement5, 6. Physiological studies have shown that patients with focal hand dystonia have reduced surround inhibition7, 8. A multi-voxel in vivo magnetic resonance spectroscopic (MRS) study of patients with focal hand dystonia indicated that GABA may be decreased in the motor cortex as well as in the basal ganglia9. Based on these findings we surmised that a pathophysiological mechanism of dystonia is in the altered surround inhibition 7, 8 mediated by GABAergic dysfunction that may lead to increased motor circuit excitability.
The basal ganglia have the richest array of neurotransmitters and receptors of any region of the brain10. These neurotransmitters include Glutamate, GABA, Acetylcholine, Glycine, 5-HT and various other neuromodulatory chemicals. The functional role and significance of these transmitter interactions with regard to different aspects of motor control and loss of control is far from being understood11. On the other hand, given that no structural or chemical abnormalities have so far been found, some authorities consider dystonia a neuro-functional disorder of micro-scale abnormalities of neural connectivity, plasticity and/or synaptic regulation1.
Complex clues of neurochemical implications in dystonia physiology exist. For instance, GABA-potentiating drugs, such as clonazepam and high doses of the GABAB receptor agonist baclofen, have been reported to exert beneficial effects in idiopathic dystonia15.
Although it is well known that Glutamate is the most abundant excitatory neurotransmitter in the brain16, that Glutamate and Glutamine are the main precursors of GABA17 has received scant attention. It is also noteworthy that despite the fact that all neurochemicals exist in a milieu and interact in the brain at structural and functional levels constantly, no systematic metabolite profiles have been studied in neurofunctional disorders such as dystonia.
Our goal was to study GABA levels in the primary sensorimotor cortex and in the basal ganglia, with the null hypothesis that patients with focal hand dystonia will have similar GABA levels in these locations compared to the healthy controls. On an exploratory basis, we also studied Glutamate/Glutamine levels in these selected brain regions, and carried out a metabolic snapshot of the dystonia brains for multiple neurotransmitters and metabolites all at once, thus obtaining the first 1H Magnetic Resonance spectroscopic (MRS) neuro-metabolomic data from patients with primary focal hand dystonia.
NMR
1H NMR spectroscopy deals with signals from carbon-bound, non-exchangeable protons18. The highest information density in a typical in vivo spectrum is found in the spectral region of 1–5 ppm, where the aliphatic protons of low molecular weight metabolites can be quantified with specificity. A detailed accounting of brain metabolites, their NMR properties and biochemical significance is reviewed elsewhere.18, 19.
GABA protons form a six-spin system: GABA C2 (2.28 ppm), C3 (1.89 ppm), and C4 (3.02 ppm) methylene protons19. All GABA signals are overlapped by more intense signals in proton spectra even when acquired at 3 T20. It is generally agreed that an accurate measurement of GABA in vivo is impossible at lower field strengths20, 18, as the routine detection and robust quantification of GABA in vivo are complicated by the presence of large co-resonant peaks, including Creatine (3.02 ppm), so-called macromolecule resonances (3.0 ppm) and homocarnosine, a dipeptide formed from GABA and histidine 19 that is specific for the C4 group of the GABA molecule. In addition, the C3 group is obscured by NAA and the C2 group by Glutamate and Glutamine. As a result, GABA is completely obscured at field strengths and spectral resolutions typical of human MRS, and requires various clever data processing methods even when spectra are obtained at 3T.21, 22
METHODS
We report data from two related single voxel MR spectroscopy studies. Both studies were approved by the institutional review board of the NINDS, and all subjects gave informed consent.
Experiment 1: Left sensorimotor cortex
Ten right-handed patients with primary task specific focal hand dystonia affecting the right hand and 10 healthy right-handed subjects were studied. The mean age ± SD of the patients was 54 ± 11 years with disease duration of 13 ± 5.6 years. All were being treated with botulinum neurotoxin type A for variable periods of time, as detailed in the table. All patients underwent MRS at the end of an injection cycle that varied between 12–14 weeks. The control group (mean ± SD age of 56 ± 12 years) was matched for age with the patient group. The mean BMF score of the patient population was 2.95 ± 1.25. The voxel of volume of interest was placed in such a way that the center of the voxel surrounded the contralateral hand knob (on the left hemisphere) in the primary sensorimotor cortex. Identification of the hand knob was carried out by using standard anatomical landmarks identified on a high-resolution anatomical image. Anatomical references were aided by the Atlas of Neuroanatomy 23. The M1 voxel size was (25 ×25 × 30 mm) containing a volume of 18.75 cm3. As an internal reference, we also obtained spectroscopic data from a voxel that was placed across the primary visual areas (V1). This volume had the same dimensions.
Experiment 2: basal ganglia
Twelve right-handed patients with primary task specific focal hand dystonia of the right hand and 12 healthy right-handed subjects participated. Mean ± SD age of the patients was 53 ±11 years with disease duration of 14 ± 3.5 years (range 5–16). All were being treated botulinum neurotoxin type A and underwent MRS at the end of an injection cycle of 12–18 weeks. The control group (mean ± SD age 56 ± 12 years) was matched for age with the patient group. The mean BMF score of the patient population was 3.25 ± 1.35.
In this experiment, the voxel of volume of interest was placed to encompass the contralateral (i.e., left) putamen. Identification of the putamen was carried out by using standard anatomical landmarks identified on a high-resolution anatomical image. Anatomical references were aided by the Atlas of Neuroanatomy23. This voxel contained a volume of 18.75 cm3, and had dimensions of 25 ×25 × 30 mm.
Both experiments were carried out on a 3 Tesla GE whole body scanner using a transmit and receive head coil (Medical Advances, Inc., Milwaukee). This scanner is equipped with a self-shielded gradient set (40 mT/m, slew rate 160 T/m/s). For both experiments in which we obtained edited spectra, a spectral width of 5000 Hz was acquired on 2048 points (only 1024 are processed, the rest is noise) under first order shimming and outer volume saturation, at TE of 68 ms. With a repetition time of 1.5 s, the total acquisition duration was 26.08 minutes per voxel for the edited spectra. For the short echo time (30–35 ms) unedited spectra the number of repetitions averaged were 32, and the acquisition time was 1.18 minutes per voxel. Both these spectra were acquired for each voxel.
We chose the voxel positions relative to the anterior and posterior commissure line, referring to standard anatomical landmarks identified on the high-resolution anatomical images compared with an anatomical atlas. First order shimming was performed with the manufacturer provided sequence, and resulted in a frequency width at half maximum (FWHM) of 11Hz for NAA. In the PRESS pulse sequence, the center frequency is around 256 Hz at 3T. It is placed between the Cho/Cre and NAA frequencies to reduce the shift of the NAA voxel relative to the prescribed voxel location.
GABA was measured using an interleaved point resolved spectroscopy (PRESS)-based J-editing method19, 24. The concentrations of GABA, choline, N-acetyl aspartate (NAA), and co-edited Glx (i.e., glutamate and glutamine) were expressed in mmol/L (mM) referenced to concentration of Creatine (Cre). The creatine referencing method has been used and validated25. Normalization with water produced higher SDs of measurements in our scanner. The spectroscopy data were processed in two steps. First, the unedited spectra were fitted for the amplitudes of Choline, Creatine, and NAA. Second, the GABA at 3.0 ppm and co-edited Glx-2 at around 3.8 ppm were fitted using position and line width information from the fit on the unedited spectra. The GABA signal was corrected for macromolecule contaminations26. At experimental conditions optimized for GABA editing, a small fraction of Glx-2 at 3.8 ppm and Glx-4 at 2.4 ppm were co-edited because of their J-couplings1 to the Glx-3 signal at 2.1 ppm. The clean co-edited Glx-2 signal was used for measurement of Glx, as its intensity is proportional to the total concentration of Glx. The GABA signal closest to the Glx-2 peaks resonates at 3.0 ppm.
In addition to the J-edited method for GABA and Glx, we present data from our exploratory acquisition of the short TE spectroscopy. This data set captures the common NMR visible spectra of the human brain. Data were analyzed with LCModel© 27, with a basis set that is supplied by the manufacturer of the scanner. The following 20 metabolites were included in the basis set: Alanine (Ala), aspartate (Asp), glycerophosphorylcholine (GPC), phosphorylcholine (PCho), Creatine (Cr), phosphocreatine (PCr), GABA, glucose (Glc), glutamine (Gln), Glu, GSH, myo-inositol (myo-Ins), lactate (Lac), N-acetylaspartate (NAA), N-acetylaspartylglutamate (NAAG), phosphorylethanolamine (PE), scyllo-inositol (scyllo-Ins), taurine (Tau), and macromolecules (MM). Criteria for selecting the reliable metabolite concentrations were based on the Cramer-Rao lower bounds (CRLB), which are estimates of the %SD of the fit for each metabolite28. Results with a CRLB <17% were included in the analysis. As such only the following metabolites were included in the statistical model: Cre, GPC, myo-Inositol, NAA, GPC+PCh, NAA+NAAG, Glu+Gln and some MM fractions.
Results are reported as the mean and standard deviation. In the analysis of GABA/Cre, we used an ANOVA model and post-hoc comparisons. In the exploratory analysis of metabolite profiles, to see the group differences we used a linear mixed effects model with an unknown covariance structure containing different covariance for any pair. As there were significant interactions for each of the two-voxel locations separately, we examined group differences per metabolite for each voxel by using two-sample t-tests corrected for multiple comparisons.
RESULTS
Figure 1 shows a typical set of GABA edited spectra. Assuming relative metabolite concentrations of the healthy brain, the signal observed near 3.02 ppm in vivo is dominated by GABA and can be reasonably fit by a doublet where every line is a combination of a Lorentzian and a Gaussian shape. The shape and location is calculated from the line shape from the fit to the Creatine, NAA and Choline in the unedited spectrum. Panel 1A is the intact subspectrum at echo time (TE) = 68 milliseconds. The editing pulse is placed at the resonance frequency of GABA-3 at 1.9 ppm. Panel 1B shows the outcome of the spectrum when the GABA editing pulse is applied. The trace in panel 1C shows the edited spectrum. The large NAA signal at 2.0 ppm is inverted as a result of the NAA peak in the unedited spectra being subtracted from the edited spectra. The editing pulse zeros out the NAA in the edited spectra so a negative NAA peak remains in the subtraction spectrum.
Figure 1.

A typical set of GABA edited spectra. Panel 1A is the intact subspectrum at echo time (TE) = 68 milliseconds. The editing pulse is placed at the resonance frequency of GABA-3 at 1.9 ppm as shown in Panel 1B. The outcome of the spectrum when the GABA editing pulse is applied is shown in the trace in panel 1C. The large NAA signal at 2.0 ppm is inverted as a result of the NAA peak in the unedited spectra being subtracted from the edited spectra. The editing pulse zeros out the NAA so a negative NAA peak remains after the subtraction.
There is an incidental detection of the Glx-2 signal at 3.8 ppm and the Glx-4 signal at 2.4 ppm in the edited spectrum, due to their J-coupling to Glx-3 at 2.1 ppm. The co-edited Glx-4 peak partially overlaps with the negative NAA signal. However, the Glx-2 signal at 3.8 ppm is cleanly co-edited, allowing simultaneous determination of Glx without GABA contamination. The edited GABA-4 signal is located at 3.0 ppm and was used for quantification of GABA concentration. The co-edited GABA-2 signal at 2.3 ppm was overwhelmingly overlapped by the residual Glx-4 signal at 2.4 ppm and the dominant NAA signal at 2.0 ppm. As seen on the trace, excellent water and outer volume suppression was achieved.
For edited spectra, we used the standard deviation of measures carried out locally. These provide a minimal standard deviation for peak amplitude determination. In edited spectra, the SD of NAA peak was 1–2%, whereas, for GABA, this was 9%. For unedited spectra that we report here, we used a 17% cutoff of the Cramer-Rao lower bounds29 for the metabolites.
We found no significant differences of GABA/Cre, or Glx/Cre, in either voxel. However, in the BG voxel, there was a statistically nonsignificant trend (p<0.059, Student’s t- test) of about 10% decrement of GABA/Cre in patients compared to controls. This trend was noticeable when individual spectra were considered. For example, for the GABA/Cre for contralateral BG was 3.84 ± 0.69 for patients whereas 4.29 ± 0.81 for the controls. For the ipsilateral (R) BG voxel, GABA/Cre was 3.12±1.56 for the patients and 3.86±0.99 for the controls. When data were pooled, the mean and SD of GABA/Cre in patients was 3.513 ± 0.259 whereas GABA/Cre for the controls was 4.082 ± 0.206 A similar trend in the opposite direction was noted when Glx/Cre was pooled. In patients with FHD, the pooled Glx/Cre was 7.171±2.10, whereas in controls the Glx/Cre was 5.944±0.97. A standard power analysis (StatMate; GraphPad Software®) choosing α = 0.05 and β = 0.2 (corresponding to a 5% probability of Type I error and 20% probability of Type II error) permits determination of the size of sample to detect a GABA/Cre change that could have been identified in this study. Based on the distribution of data with an estimated mean SD of 0.80 for GABA/Cre, we would have required approximately 80 volunteers in each group to obtain a significant result using an unpaired t-test. Currently the tests have <20% power. We also sought statistically significant correlations between disease duration and BMF scores with various metabolites that were measured in this study and found none. In addition, when we segmented each of the voxels into white matter and grey matter compartments, and correlated the neurochemical ratios to these, we found no associations.
Our exploratory analysis of metabolite data (Cre, GPC, myo-Inositol, NAA, GPC+PCh, NAA+NAAG, Glu+Gln and some MM (MM6) fractions that survived the CRLB cutoff) from the LCModel analysis failed to reveal any statistically significant differences between patients and controls for either locations of interest.
DISCUSSION
The aim of this study was to measure various NMR visible neurochemicals in vivo in patients with primary focal hand dystonia and compare these values to those from healthy controls. We were interested in the inhibitory neurotransmitter GABA in the two voxels that included the main neuronal substrates in the control of voluntary motor movements, namely the pre- and post- Rolandic hand area and the basal ganglia. These sites were selected on the basis of prior studies that had indicated pathological30, neurophysiological31 and neurochemical abnormalities in animal models4 of patients with focal hand dystonia. We wanted to replicate the findings of the only study that has so far reported on GABA levels in human primary focal hand dystonia9. In that study, authors had used a lower magnetic field that is now generally considered to be insufficient for measurement of GABA. In addition, they had used a multivoxel 2D acquisition method, which is also thought to have inferior sensitivity, and specificity especially for small molecules with multiple peaks and J-coupled protons19, 18. Due to these technical and theoretical limitations, it is possible that the earlier results were false positives.
Signals measured with MRS represent the pool of extracellular and intracellular GABA at a concentration of around 0.5 – 1.4 μm32 and Glutamate, about 5–10 mM33. Even though measuring neurochemicals at such low concentrations is difficult, performance of our edited PRESS sequence is comparable to results in the literature25. However, it should be noted that measurement of GABA is possibly hampered by the macromolecule resonances in the spectrum. Transverse relaxation times of macromolecules are, however, relatively short (24–40 ms)34, and the remaining MM resonance at TE of 68 ms is likely to be limited. Therefore, in the individual GABA spectrum of a J-edited PRESS acquisition at a TE of 68 ms, the contribution from the macromolecule signals is minimal as can be seen from an essentially at baseline. As a by-product of the editing sequence, we have also obtained data for Glutamate and Glutamine. Glutamate and Glutamine are not fully resolved from each other in vivo at 3T and are measured as a wide doublet.
With this MRS sequence optimized for GABA detection, we found no statistically significant changes in GABA (GABA/Cr) in both voxels that we studied when comparing patients with controls. This finding is contrary to a prior MRS study of patients with FHD, but fully agrees with the preliminary findings of another study by Meunier et al that used 16 patients with primary focal hand dystonia undergoing MRS, using technical parameters and analytical methods that were quite similar to ours35. Moreover, we did not find any differences between patients and controls for either location when we compared Glx ratios or a number of other common neuro-metabolites.
Our data indicate statistically nonsignificant trends towards reduced GABA/Cre and increased Glx/Cre ratios in patients with primary FHD. These trends are difficult to interpret given that they fall within the SD of the measurements (10%). However, given that the study was powered to detect a 30% difference between the means of the groups based on the previous study that is available in the literature, the possibility exists that the method was not sensitive enough to detect a true 10% difference that may actually exist in patients with FHD. The trend for reduced GABA in the basal ganglia is in the same direction as the previously reported result9. A main concern that may be raised against these arguments is the possibility that the individual variability of what can be described as the “dystonic circuitry” may mask differences in neurochemicals in pooled data. Another way to address this issue would be to compare the pre-symptomatic concentrations to the post symptomatic. At this time, given the limitations in clinical predictions, this is not possible. Further research with higher magnetic fields, better signal detection and line separation, including measurement of water and macromolecule relaxation times may be necessary to substantiate this finding. It is also worth considering the fact that difficult as it is to measure a neurochemical present in the brain at a 1 μM concentration in vivo, this must be especially difficult in conditions where one expects even smaller concentrations of that substance.
Figure 2.
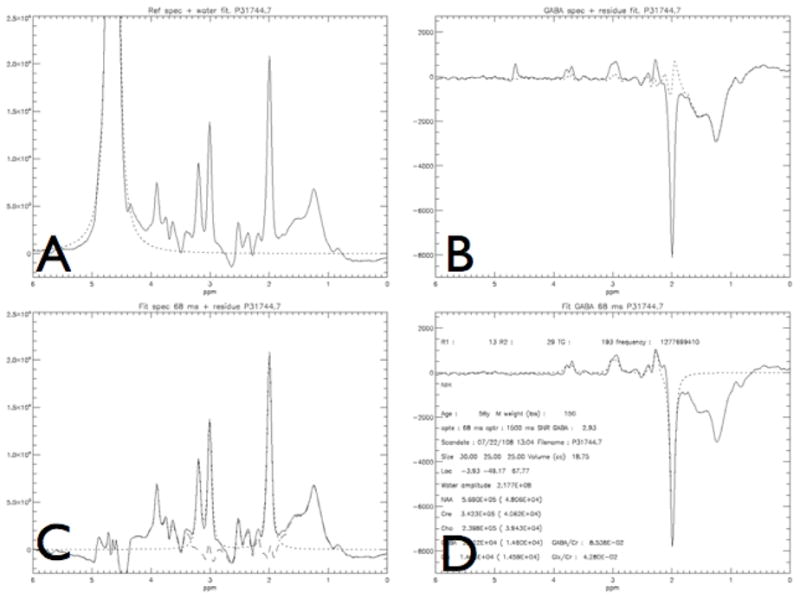
Model fitting of the spectra obtained from a patient with focal hand dystonia: Panels A–D depict different steps in the model fit as described in Methods section. Close approximation of the model and the data can be seen here clearly, as indicated by the small residual. Panel A depicts the output of the unedited spectrum with the large water peak, and the model fit to water, in order to remove the water peak. Once this is done panel C shows the standard MR spectrum without the editing pulse applied with the fit (dotted line) to Cho, Cre, and NAA and the residual (dot -stripe line). Panels B and D show the spectrum obtained with the editing pulse, after the subtraction from C, yielding the GABA and Glx peaks and the model fit with the residual (data -fit from panel D). Panel D is the final output with additional information, with the model the fit to GABA, Glx and NAA that were measured in arbitrary units which were later referenced to Cre for our statistical analysis.
Figure 3.

The voxel placement of the volume used for spectroscopy: 3A contralateral (Left) basal ganglia mostly containing the putamen, and 3B with the contralateral (Left) sensorimotor cortex.
Figure 4.
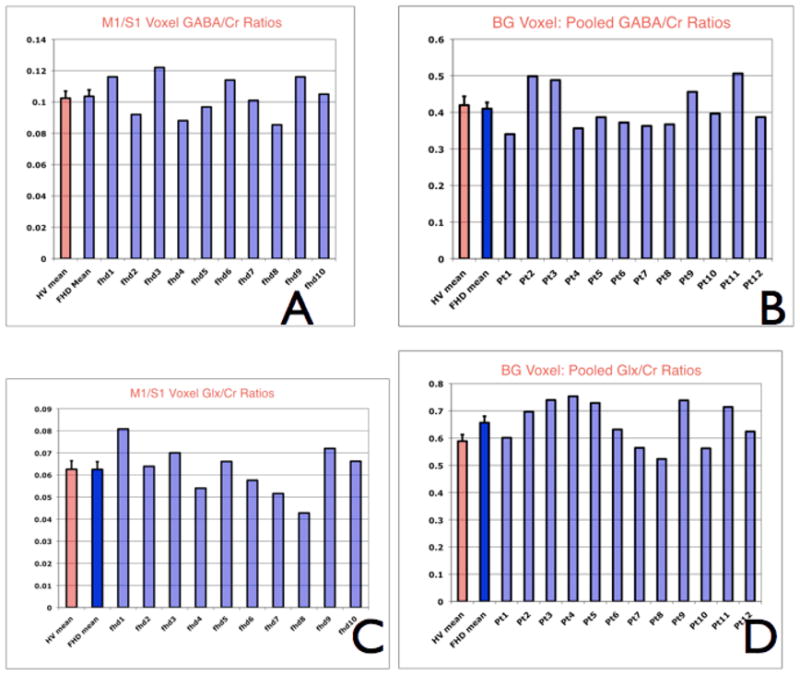
These graphs demonstrate individual metabolite ratios and the mean of the metabolite ratio from the healthy volunteers. Panel A and C are for the sensorimotor voxel GABA/Cre and Glx/Cre ratios. Panel B and D are for the basal ganglia pooled GABA/Cre and Glx/Cre ratios.
Table 1.
Patient demographics and clinical data for the sensorimotor cortex experiment. BFM is the Burke-Fahn-Marsden rating scale score; BoNT is botulinum neurotoxin.
| Patient | Age | Disease duration | BFM score | Time since last BoNT |
|---|---|---|---|---|
| 1 | 64 | 17 | 2 | >4y |
| 2 | 51 | 8 | 2 | 12 wks |
| 3 | 40 | 10 | 6 | 12 wks |
| 4 | 63 | 19 | 2 | > 3y |
| 5 | 28 | 3 | 3 | 16 wks |
| 6 | 46 | 4 | 3 | 12 wks |
| 7 | 60 | 18 | 6 | > 5 y |
| 8 | 58 | 17 | 6 | > 5 y |
| 9 | 57 | 16 | 6 | >1 y |
| 10 | 66 | 19 | 4 | >1 y |
| 11 | 47 | 14 | 3 | >3 y |
| 12 | 59 | 12 | 3 | > 6y |
Table 2.
Patient demographics and clinical data for the Basal Ganglia experiment. BFM is the Burke-Fahn-Marsden rating scale score; BoNT is botulinum neurotoxin.
| Patient | Age | Disease duration | BFM score | Time since last BoNT |
|---|---|---|---|---|
| 1 | 66 | 19 | 3 | 16 wks |
| 2 | 46 | 4 | 3 | 12 wks |
| 3 | 64 | 17 | 2 | > 4 y |
| 4 | 59 | 12 | 3 | 13 wks |
| 5 | 28 | 3 | 3 | 18 wks |
| 6 | 56 | 16 | 2 | > 4 y |
| 7 | 44 | 12 | 3 | > 20 wks |
| 8 | 63 | 19 | 2 | > 3y |
| 9 | 65 | 22 | 3 | > 2 y |
| 10 | 58 | 14 | 3 | > 12 wks |
| 11 | 47 | 14 | 3 | > 3 y |
| 12 | 57 | 16 | 2 | > 4 y |
Acknowledgments
Research Funding:
This work was carried out with intramural funding from the NIH- available through US federal government funds. None of the authors have received, or are expected to receive any other funding.
Alan Barnet helped us with the algorithm that we used for segmenting the voxels into white matter and grey matter compartments.
Documentation of Author Roles
Research project: A. Conception, B. Organization, C. Execution;
Statistical Analysis: A. Design, B. Execution, C. Review and Critique;
Manuscript: A. Writing of the first draft, B. Review and Critique;
Herath: 1A, 1B, 1C, 2A, 2B, 3A
Hallett: 1A, 1B, 2A, 2C, 3C
Gallea: 1B, 1C, 2A, 2C, 3C
Horovitz: 1B, 1C, 2A, 2C, 3C
Van der Veen: 1A, 1B, 2A, 2C, 3C
Financial Disclosures
Financial disclosure related to research covered in this article: all funding for the work submitted here are from the NINDS intramural budget. All authors are federal government employees, and have no potential conflicts of interests that relate to the research covered in the article
Full financial disclosure for the previous 36 months: Dr. Hallett reports: Consulting and Advisory Board Membership with honoraria: Neurotoxin Institute; Grants/Research: Funding from NIH, the US Army, Ariston Pharmaceuticals, Kinetics Foundation; Honoraria: University of Navarra, State of New York, University of Wisconsin, Massachusetts Medical Society, Parkinson and Aging Research Society, Columbia University; Intellectual Property Rights: H-coil; Royalties: Wiley-Blackwell, Oxford University Press, Lippincott, Wilkins and Williams, Cambridge University Press, Elsevier Publishers, Springer. All other authors herein report no conflicts of interests regardless of relationship to the current research in the article.
Footnotes
J coupling is the coupling between two nuclear spins due to the influence of bonding electrons on the magnetic field running between the two nuclei. It arises due to indirect interaction between the two nuclear spins, where the interaction is mediated by the electrons participating in the bond(s) connecting the nuclei.
Bibliography
- 1.Breakefield XO, Blood AJ, Li Y, Hallett M, Hanson PI, Standaert DG. The pathophysiological basis of dystonias. Nat Rev Neurosci. 2008;9(3):222–234. doi: 10.1038/nrn2337. [DOI] [PubMed] [Google Scholar]
- 2.Hallett M. Pathophysiology of dystonia. J Neural Transm Suppl. 2006;(70):485–488. doi: 10.1007/978-3-211-45295-0_72. [DOI] [PubMed] [Google Scholar]
- 3.Bhidayasiri R, Tarsy D. Treatment of dystonia. Expert review of neurotherapeutics. 2006;6(6):863–886. doi: 10.1586/14737175.6.6.863. [DOI] [PubMed] [Google Scholar]
- 4.Richter A, Löscher W. Pathology of idiopathic dystonia: findings from genetic animal models. Prog in Neurobiol. 1998;54(6):633–677. doi: 10.1016/s0301-0082(97)00089-0. [DOI] [PubMed] [Google Scholar]
- 5.Matsumura M, Sawaguchi T, Kubota K. GABAergic inhibition of neuronal activity in the primate motor and premotor cortex during voluntary movement. J Neurophysiol. 1992;68(3):692–702. doi: 10.1152/jn.1992.68.3.692. [DOI] [PubMed] [Google Scholar]
- 6.Matsumura M, Sawaguchi T, Oishi T, Ueki K, Kubota K. Behavioral deficits induced by local injection of bicuculline and muscimol into the primate motor and premotor cortex. J Neurophysiol. 1991;65(6):1542–1553. doi: 10.1152/jn.1991.65.6.1542. [DOI] [PubMed] [Google Scholar]
- 7.Sohn Y, Hallett M. Disturbed surround inhibition in focal hand dystonia. Ann Neurol. 2004;56(4):595–599. doi: 10.1002/ana.20270. [DOI] [PubMed] [Google Scholar]
- 8.Sohn Y, Hallett M. Surround inhibition in human motor system. Exp Brain Res. 2004;158(4):397–404. doi: 10.1007/s00221-004-1909-y. [DOI] [PubMed] [Google Scholar]
- 9.Levy LM, Hallett M. Impaired brain GABA in focal dystonia. Ann Neurol. 2002;51(1):93–101. [PubMed] [Google Scholar]
- 10.McGeer PL, McGeer EG. Neurotransmitters and their receptors in the basal ganglia. Adv Neurol. 1993;60:93–101. [PubMed] [Google Scholar]
- 11.Hauber W. Involvement of basal ganglia transmitter systems in movement initiation. Prog Neurobiol. 1998;56(5):507–540. doi: 10.1016/s0301-0082(98)00041-0. [DOI] [PubMed] [Google Scholar]
- 12.Klein C, Breakefield XO, Ozelius LJ. Genetics of primary dystonia. Semin Neurol. 1999;19(3):271–280. doi: 10.1055/s-2008-1040843. [DOI] [PubMed] [Google Scholar]
- 13.Nygaard TG. Dopa-responsive dystonia. Delineation of the clinical syndrome and clues to pathogenesis. Adv Neurol. 1993;60:577–585. [PubMed] [Google Scholar]
- 14.Greene P, Shale H, Fahn S. Experience with high dosages of anticholinergic and other drugs in the treatment of torsion dystonia. Adv Neurol. 1988;50:547–556. [PubMed] [Google Scholar]
- 15.Stacy M, editor. Handbook of Dystonia. Informa Healthcare; New York: 2006. pp. 1–440. [Google Scholar]
- 16.Fonnum F. Glutamate: a neurotransmitter in mammalian brain. J Neurochem. 1984;42(1):1–11. doi: 10.1111/j.1471-4159.1984.tb09689.x. [DOI] [PubMed] [Google Scholar]
- 17.Bak LK, Schousboe A, Waagepetersen HS. The glutamate/GABA-glutamine cycle: aspects of transport, neurotransmitter homeostasis and ammonia transfer. J Neurochem. 2006;98(3):641–653. doi: 10.1111/j.1471-4159.2006.03913.x. [DOI] [PubMed] [Google Scholar]
- 18.Govindaraju V, Young K, Maudsley AA. Proton NMR chemical shifts and coupling constants for brain metabolites. NMR Biomed. 2000;13(3):129–153. doi: 10.1002/1099-1492(200005)13:3<129::aid-nbm619>3.0.co;2-v. [DOI] [PubMed] [Google Scholar]
- 19.de Graaf RA. In Vivo NMR Spectroscopy: Principles and Techniques. Wiley-Interscience; New York: 2008. [Google Scholar]
- 20.Waddell KW, Avison MJ, Joers JM, Gore JC. A practical guide to robust detection of GABA in human brain by J-difference spectroscopy at 3 T using a standard volume coil. Mag Res Imaging. 2007;25(7):1032–1038. doi: 10.1016/j.mri.2006.11.026. [DOI] [PMC free article] [PubMed] [Google Scholar]
- 21.Choi I, Lee S, Shen J. Selective homonuclear Hartmann-Hahn transfer method for in vivo spectral editing in the human brain. Magn Res in Medicine. 2005;53(3):503–510. doi: 10.1002/mrm.20381. [DOI] [PubMed] [Google Scholar]
- 22.Trabesinger AH, Meier D, Boesiger P. In vivo 1H NMR spectroscopy of individual human brain metabolites at moderate field strengths. Mag Res Imaging. 2003 doi: 10.1016/j.mri.2003.08.029. [DOI] [PubMed] [Google Scholar]
- 23.Mai JK, Paxinos G, Voss T. Atlas of the Human Brain. 3. Academic Press; New York: 2007. [Google Scholar]
- 24.Costanzo D, Trojsi, Tosetti, Schirmer Proton MR spectroscopy of the brain at 3 T: an update. Eur Radiol. 2007;17(7):1651–62. doi: 10.1007/s00330-006-0546-1. [DOI] [PubMed] [Google Scholar]
- 25.Sanacora G, Mason GF, Rothman DL, et al. Reduced cortical gamma-aminobutyric acid levels in depressed patients determined by proton magnetic resonance spectroscopy. Arch Gen Psychiatry. 1999;56(11):1043–1047. doi: 10.1001/archpsyc.56.11.1043. [DOI] [PubMed] [Google Scholar]
- 26.Shen J, Rothman DL, Brown P. In vivo GABA editing using a novel doubly selective multiple quantum filter. Magnetic Resonance in Medicine. 2002;47(3):447–454. doi: 10.1002/mrm.10104. [DOI] [PubMed] [Google Scholar]
- 27.Provencher SW. Automatic quantitation of localized in vivo 1H spectra with LCModel. NMR Biomed. 2001;14(4):260–264. doi: 10.1002/nbm.698. [DOI] [PubMed] [Google Scholar]
- 28.Provencher SW. Estimation of metabolite concentrations from localized in vivo proton NMR spectra. Magnetic Resonance in Medicine. 1993;30(6):672–679. doi: 10.1002/mrm.1910300604. [DOI] [PubMed] [Google Scholar]
- 29.Ye JC, Bresler Y, Moulin P. Cramer-Rao bounds for parametric shape estimation in inverse problems. IEEE Trans Image Process. 2003;12(1):71–84. doi: 10.1109/TIP.2002.806249. [DOI] [PubMed] [Google Scholar]
- 30.Walker R, McNaught KSP, Perl D. Pathology of the Dystonias. In: Stasy MA, editor. handbook of Dystonias. New York: Informa Healthcare; 2007. pp. 65–94. [Google Scholar]
- 31.Shill H, Hallett M. Physiology of Primary Dystonia. In: Stacy MA, editor. The Handbook of Dystonias. New York: Informa Healthcare; 2007. pp. 54–65. [Google Scholar]
- 32.Chang L, Cloak CC, Ernst T. Magnetic resonance spectroscopy studies of GABA in neuropsychiatric disorders. J Clin Psychiatry. 2003;64 (Suppl 3):7–14. [PubMed] [Google Scholar]
- 33.van der Zeyden M, Oldenziel WH, Rea K, Cremers TI, Westerink BH. Microdialysis of GABA and glutamate: analysis, interpretation and comparison with microsensors. Pharmacol Biochem Behav. 2008;90(2):135–147. doi: 10.1016/j.pbb.2007.09.004. [DOI] [PubMed] [Google Scholar]
- 34.Behar KL, Rothman DL, Spencer DD, Petroff OA. Analysis of macromolecule resonances in 1H NMR spectra of human brain. Magn Reson Med. 1994;32(3):294–302. doi: 10.1002/mrm.1910320304. [DOI] [PubMed] [Google Scholar]
- 35.Meunier A, Valabregue R, Marjanska M, et al. Metabolic abnormalities in human primary dystonia: A Magnetic resonance spectroscopic study (Abstract) Movement Disorders. 2009;24(Supplement 1):S201. [Google Scholar]