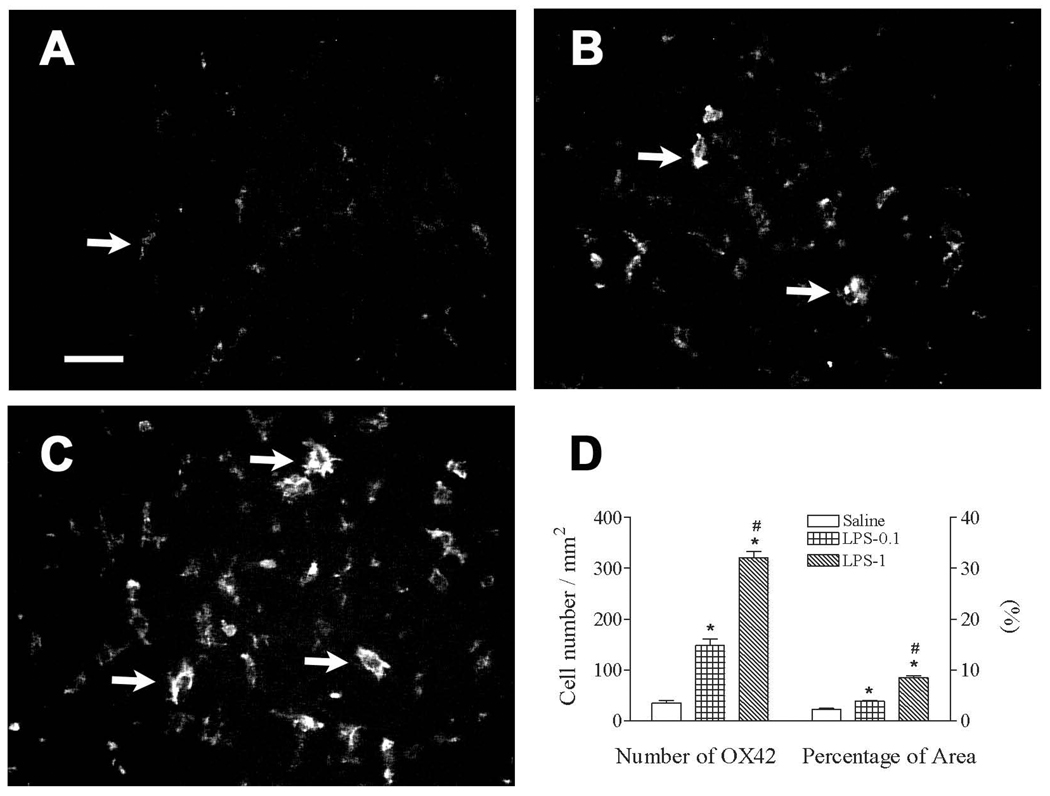
Figure 2.
Representative photomicrographs of OX42 staining in the cortex of rat brain 3 days (P8) after lipopolysaccharide (LPS) injection. LPS stimulated activation of microglia, as indicated by OX42 immunostaining (from a ramified shape to cells with an enlarged cell body and blunt processes) in the rat brain. Intracerebral injection of saline, LPS (0.1 mg/kg), or LPS (0.1 mg/kg) in P5 rats was performed as described in the methods. Most microglia were at resting status with a small rod shaped soma and ramified processes in the brain of the saline group (indicated by the arrow in A). Numerous activated microglia (indicated by arrows in B and C) with a round or elongated shaped cell body and blunt processes were observed in the rat brain 3 days after LPS (0.1 mg/kg) (B) or LPS (0.1 mg/kg) injection (C). The scale bar in A represents 50 µm for A, B, and C. Quantitation of the number of OX42+ cells and the percentage of the image area that contained OX42 staining (D) in the cortex was performed as described in the methods. The results are expressed as the mean ± SEM of 12 animals in each group, and were analyzed by one-way ANOVA. * P < 0.05 represents a significant difference in the LPS (0.1 mg/kg) or LPS (1 mg/kg) group compared with the saline group. # P < 0.05 represents a significant difference in the LPS (1 mg/kg) group compared with the LPS (0.1 mg/kg) group.

