

Abstract
Paraoxonase 1 (PON1) prevents oxidation of low density lipoproteins and inactivates toxic oxon derivatives of organophosphate pesticides (OPs). Over 250 SNPs have been previously identified in the PON1 gene, yet studies of PON1 genetic variation focus primarily on a few promoter SNPs (-108,-162) and coding SNPs (192, 55). We sequenced the PON1 gene in 30 subjects from a Mexican-American birth cohort and identified 94 polymorphisms with minor allele frequencies > 5%, including several novel variants (6 SNPs, 1 insertion, 2 deletions). Variants of the PON1 gene and 3 SNPs from PON2 and PON3 were genotyped in 700 children and mothers from the same cohort. PON1 phenotype was established using two substrate-specific assays: arylesterase (AREase) and paraoxonase (POase). Twelve PON1 and two PON2 polymorphisms were significantly associated with AREase activity, and 37 polymorphisms with POase activity, however only nine were not in strong linkage disequilibrium (LD) with either PON1-108 or PON1192 (r2>0.20), SNPs with known effects on PON1 quantity and substrate-specific activity. Single tagSNPs PON155 and PON1192 accounted for similar ranges of AREase variation compared to haplotypes comprised of multiple SNPs within their haplotype blocks. However, PON155 explained 11-16% of POase activity, while six SNPs in the same haplotype block explained 3-fold more variance (36-56%). Although LD structure in the PON cluster seems similar between Mexicans and Caucasians, allele frequencies for many polymorphisms differed strikingly. Functional effects of PON genetic variation related to susceptibility to OPs and oxidative stress also differed by age, and should be considered in protecting vulnerable subpopulations.
Keywords: functional genomics, oxidative stress, pesticides, indels, haplotype blocks, children
Introduction
Paraoxonase 1 (PON1) is considered a protective metabolic enzyme because it can detoxify the oxon derivatives of some organophosphate pesticides (OPs), which are known to be neurotoxic (Costa et al. 2005a; Li et al. 2003). More recently, PON1 research has intensified as multiple studies have established an antioxidant role of not only PON1 (MIM 168820), but additional members of the PON gene family cluster, PON2 (MIM 602447) and PON3 (MIM 602720)(Aviram and Rosenblat 2004; Horke et al. 2007; Li et al. 2003). We previously demonstrated wide inter-individual variability of PON1 phenotypes in mothers and children (Furlong et al. 2006). This variability may confer differential susceptibilities to OPs exposures and oxidative stress. While the physiological mechanisms linking PON1 and disease have not been clearly established, several epidemiological studies have reported associations between PON1 genotypes and enzyme activities and many diseases including cardiovascular disease (Bhattacharyya et al. 2008), Parkinson’s disease (Zintzaras and Hadjigeorgiou 2004), Alzeheimer’s disease (Erlich et al. 2006), and diabetes (Li et al. 2005).
Factors mediating PON1 expression and enzyme activity may play a key role in determining susceptibility to OP exposure and oxidative stress. Genetics appear to have the strongest influence on PON1 phenotype (Costa et al. 2005b; Deakin and James 2004). Three members of the PON gene cluster, PON1, PON2, and PON3 are adjacent to each other over a 120 kb region on the long arm of chromosome 7q21.3-22 and share approximately 65% homology at the amino acid level (Primo-Parmo et al. 1996). While all three PON enzymes exhibit antioxidant properties (Aviram and Rosenblat 2004), only PON1 is capable of metabolizing toxic oxon derivatives of OPs (Draganov et al. 2005). Studies have reported strong LD between polymorphisms in the PON2 and PON3 genes (Erlich et al. 2006; Landers et al. 2008) and some also suggest presence of LD between certain PON1 and PON3 SNPs (Landers et al. 2008; Sanghera et al. 2008). Few studies have examined the effect of PON2 and PON3 SNPs on PON1 phenotype, however Sanghera et al.(2008) have reported associations between several PON3 tagSNPs on PON1 activity.
Although over 250 polymorphisms in the PON1 gene exist, most studies focus primarily on just a few known functional SNPs (PON1-162, PON1-108, PON155, and PON1192). Promoter SNPs, PON1-162, and PON1-108, are strongly associated with PON1 levels although PON1-108 SNP has the largest impact (Brophy et al. 2001). PON1 levels for the PON1-108C allele are on average two-fold higher than for the PON1-108T allele (Deakin et al. 2003); in vivo studies suggest that this SNP may disrupt an Sp1 recognition sequence thereby affecting transcription (Deakin et al. 2003). PON55, a coding SNP, is also associated with PON1 levels however much of this effect has been attributed to its strong linkage disequilibrium with promoter SNPs (Brophy et al. 2001). The nonsynonomous coding SNP, PON1192, results in an amino acid substitution from glutamine (Q) to arginine (R), dramatically affecting substrate-specific catalytic efficiency. In vitro and in vivo studies have demonstrated that the PON1192R alloform can hydrolyze OP oxons chlorpyrifos-oxon and paraoxon more efficiently than the PON1192Q alloform, therefore conferring a greater degree of protection from OP exposures(Costa et al. 2003). Furthermore, structural studies using directed evolution suggest that amino acid residue Lys192 is likely part of the PON1 active site wall(Harel et al. 2004).
Several studies have demonstrated that PON1192 accounts for most of the variability of POase activity. For example, it explains 59% of POase activity among Caucasian and African-American adults(Bhattacharyya et al. 2008) and 48% of the variability in a Mexican-American population(Rainwater et al. 2009). We previously showed that five known SNPs explain less POase variability in Mexican-American newborns (49%) in comparison to their mothers (63% and 78% at the time of delivery and seven years later, respectively) (Huen et al. 2010). In contrast, the same five SNPs explain only 27% of AREase variability in newborns and even less in mothers at the time of delivery (12%); Chen et al. (2003) reported a similar trend in Caucasians, African-Americans, and Caribbean Hispanics. These data suggest that the impact of genetic polymorphisms on PON1 phenotype may differ by age. Furthermore, additional genetic variants as well as other factors may also influence AREase activity and therefore PON1 expression.
Studies of PON1 genotypes and phenotypes in different ethnic populations have revealed significant variation in both allele frequencies and PON1 activities. For example, the frequency of the PON1192Q allele, which is associated with slower catalytic efficiency towards some OPs (e.g. chlorpyrifos-oxon), has a high frequency in Caucasians (0.73), but a significantly lower frequency in Mexicans (0.48) and African-Americans (0.37)(Chen et al. 2003; Holland et al. 2006; Rojas-Garcia et al. 2005). Similarly, the PON1-108C allele associated with increased PON1 expression has a high frequency in African-Americans (0.85) and much lower frequency in Caucasians (0.38) (Chen et al. 2003; Holland et al. 2006; Rojas-Garcia et al. 2005). On the haplotype level, Koda et al. demonstrated that frequencies in the PON1 gene differed widely between African, European, and Japanese populations (2004). Furthermore, certain haplotypes were unique to specific populations. Chen et al. also demonstrated that the genetic contribution of five known SNPs (at positions -909,-162,-108, 55, and 192) to AREase activity differs between populations. In Caucasian newborns, they accounted for 70% of activity while in African-Americans and Caribbean Hispanics, they only explained 15 and 24%, respectively (2005).
The PON1 gene has been resequenced in several populations including Yoruba of Ibadan, Nigeria, Han Chinese, Japanese, Utah residents with Northern and Western European ancestry (CEPH), and African-Americans (based on data from HapMap: http://hapmap.ncbi.nlm.nih.gov; and Seattle SNPs databases: http://pga.gs.washington.edu). To our knowledge, no resequencing data and limited genotyping data is available in Mexican and other Hispanic populations. The current data demonstrating significant differences between populations suggest that there may be genetic variants unique to or more frequent in Mexican populations in comparison to other ethnic groups. Furthermore, the genetic contribution of certain polymorphisms to enzyme activity and expression may also differ between age groups. To further characterize genetic variation of PON1 as well as PON family cluster genes PON2 and PON3 in a Mexican-American birth cohort from California, we resequenced all three PON genes in 30 mothers and children, and then determined the functional significance of identified polymorphisms and haplotypes in over 200 mothers and 200 newborns. Since many studies focus primarily on coding SNPs PON1192 and PON155, we also examined how well these single SNPs characterize the variation of PON1 enzyme levels and substrate-specific activities in comparison to multiple SNPs from the same haplotype block.
Materials and Methods
Study subjects
The Center for Health Assessment in Mothers and Children of Salinas (CHAMACOS) is a longitudinal birth cohort of primarily Mexican-American families from the agricultural region Salinas Valley in Northern California (Eskenazi et al. 2003). Enrollment of 601 pregnant women took place from 1999-2000. Five hundred and thirty-one of the mothers were followed through the birth of a live infant. Mothers in the CHAMACOS cohort were primarily young (mean ± SD: 25.6 ± 5.3 years), Mexican-born, Spanish-speaking women. Many of them worked in agriculture (44%) and/or lived with farm workers at the time of enrollment (84%). Ethnicity of children and mothers was based on mothers’ self-report. For this analysis, we included only women and children who were of Hispanic origin, the majority of whom were Mexican (>90%). More than half the women in CHAMACOS came from three states in Mexico: Michoacan (23%), Guanajuato (21%), and Jalisco (11%). Although we did not analyze genotypes in fathers, questionnaire data revealed that among women of Hispanic origin in this study 96% of fathers were also of Hispanic origin (reported by mothers). Therefore, women and children included in this analysis were from a relatively homogeneous population. Study protocols were approved by the University of California, Berkeley human-subjects review committee. Written informed consent was obtained from all mothers.
Blood collection and processing
Blood specimens were collected from mothers at the hospital shortly before or after the time of delivery. Umbilical cord blood samples were collected by delivery room staff once the baby was safely delivered. Heparinized whole blood was collected in BD vacutainers® (Becton, Dickinson and Company, Franklin Lakes, NJ), centrifuged, divided into plasma, buffy coats and red blood cells, and stored at −80°C. Vacutainers without anticoagulant were used to collect serum and clot. DNA was isolated from blood clots as described previously(Holland et al. 2006).
Resequencing of the PON1 gene
Genomic DNA from subjects with a range of high and low PON1 activities was selected for resequencing. All exons (2393 bp), the majority of introns (21736 bp), and 5000 bp portions of the flanking regions up (including the 5’ regulatory region) and downstream (including the 3’ UTR region) of the PON1 gene were sequenced in 14 mothers and 16 unrelated children from the CHAMACOS cohort. All exons in PON2 (1653 bp) and PON3 (1074 bp) were also resequenced in these subjects. Resequencing was conducted by Polymorphic DNA Technologies Inc. (Alameda, CA). DNA was sequenced both in the forward and reverse directions.
Linkage Disequilibrium Plot of Resequencing Data and TagSNP selection
Haploview 4.1(Barrett et al. 2005) was used to create the LD plot containing PON1 SNPs (including 1000 bp up and downstream of the gene) with minor allele frequency (MAF) > 0.10 identified by resequencing of genomic DNA from 30 subjects. SNPs whose genotype distributions differed significantly from expected Hardy-Weinberg equilibrium (χ2 p-value < 0.05) were not plotted. The tagger function in Haploview was used to choose a minimal set of tagSNPs (n=40) that captured all alleles with a minimal r2 of 0.80. We chose to force inclusion of the four known functional SNPs: PON1-162, PON1-108, PON155, and PON1192.
Genotyping of PON genetic variants
Following resequencing of the entire PON1 gene and the exons of the PON2 and PON3 genes in 60 chromosomes, we genotyped a subset of SNPs as wells as insertions and deletions (indels) in a larger set of 361 mothers and 339 children. We genotyped a panel of polymorphisms including 33 tagSNPs chosen by tagger (including 5 PON1 SNPs genotyped for previous analyses(Holland et al. 2006), 2 PON2 coding SNPs, 2 PON3 SNPs, and 4 novel SNPs with MAF>0.05. Since little data on PON1 indels exist, we also genotyped 7 indels with MAF>0.05. As our tagger results were based on limited data from only 30 subjects, we chose to include additional SNPs from within regions of high LD to ensure adequate coverage. We excluded three SNPs with MAF <0.05 (rs1997230, rs1003504, and I1_Ins_A<C) and all further analyses were based on the remaining 44 SNPs with MAF>0.05.
Genotyping of the PON1-162, PON155, and PON1192 polymorphisms was performed using the Taqman real-time PCR method. Primers for the nucleotide sequence flanking the SNP, and probes specific for the SNP were custom-designed by Applied Biosystems, Inc. (Foster City, CA). PON1-108 was genotyped using a fluorogenic allele-specific genotyping assay (Amplifluor). The PON1-108 genotype required a two-part nested PCR strategy where the region surrounding the SNP was pre-amplified using non-allelic flanking primers before this amplicon was diluted and used as the template for the Amplifluor assay. All remaining SNPs and indels were genotyped using the multiplex platform iPlex (Sequenom, San Diego, CA). Random repeats and blanks were used as a quality assurance and control measure. Over 5% of samples were randomly repeated with a concordance rate of >99.9%. Genotype completion rate was 99.3%.
PON1 Enzyme Activity Assays
Of the 361 mothers and 339 children for whom we genotyped the panel of 44 PON polymorphisms, 250 mothers and 203 newborns had plasma specimens available for assessment of PON1 enzymatic activity. The arylesterase (AREase) assay, which measures the rate of hydrolysis of phenyl acetate, is considered a marker of PON1 quantity. Several studies have reported a high correlation between Western Blot and ELISA methods using PON1 antibodies and AREase activity(r > 0.85) (Connelly et al. 2008; Kujiraoka et al. 2000). The paraoxonase (POase) assay, which reflects both enzyme quantity and catalytic efficiency, measures the rate of hydrolysis of paraoxon (PO), the oxon derivative of the OP pesticide parathion.
PON1 substrate-specific assays were performed as described previously (Huen et al. 2009). Briefly, levels of AREase and POase activity were determined using a Molecular Devices SpectraMax®PLUS Microplate Spectrophotometer. After the addition of 20 μL (1:80 dilution) of plasma to 200 μL of a 3.26 mM phenyl acetate solution (9 mM Tris-HCL pH 8.0 0.9 mM CaCl2), the rate of formation of phenol was monitored every 15 seconds for 2 minutes (270 nm, ambient temperature) for measurement of AREase activity. For POase activity determination, the rate of formation of p-nitrophenol was measured after the addition of 20 μL (1:10 dilution) of plasma to 200μL of 1.2 mM paraoxon (2 M NaCl 0.1 M Tris-HCL pH 8.5 2.0 mM CaCl2) every 15 seconds for two minutes (405 nm, 37°C).
Statistical Analysis
Assuming a binomial distribution for the likelihood of finding polymorphic sites, our a priori power calculations revealed that resequencing of 60 chromosomes (from 30 subjects) would yield with 95% confidence all polymorphisms occurring with 5% frequency or higher. We also calculated the power to detect associations between SNPs and PON1 activity using a codominant model. We employed a conservative Bonferonni-adjusted significance value of 0.0009 (adjusting for 54 SNPs) and determined that in a population of 250 mothers, there was 80% power to detect of difference of 223 U/L in POase activity for SNPs with a MAF of 0.5. In SNPs with a MAF of 0.2, there was 80% power to detect of difference of 302 U/L in POase activity.
Although additional factors such as nutrition and alcohol and tobacco consumption(Costa et al. 2005b; Deakin and James 2004) also influence PON1 activity, genetics have been shown to play a much more significant role. Using univariate regression models, we determined whether variables such as OP exposure (urinary dialkylphosphate metabolites), alcohol, and tobacco consumption, and some sociodemographic factors were also associated with PON1 activity in our CHAMACOS subjects. Out of the potential confounders tested, only the number of years that the mother lived in the United States, which was previously shown to be correlated with differences in nutrition in the CHAMACOS cohort (Harley et al. 2005), was negatively associated with AREase and POase activity in newborns (p=0.04 and p=0.02, respectively). However, in this paper we focused on the effects of genotypes, age, and pregnancy on PON1 activity; inclusion of the length of time lived in the United States in statistical models did not significantly change the relationship between the main variables of interest (genetic polymorphisms) and PON1 enzymatic activities (data not shown).
Gendist software was used to calculate the Nei’s genetic distance based on allele frequencies in our Mexican CHAMACOS subjects from Salinas Valley, Hap Map Mexicans from Los Angeles and Seattle SNPs Caucasians (http://www.psc.edu/general/software/packages/phylip/manual/gendist.html). We used a chi squared test to compare allele frequencies between mothers and children and also to compare allele frequencies from sequencing to those calculated from genotyping data.
To determine the functional significance of the 44 polymorphisms in our genotyping panel, we used PLINK 1.06(Purcell et al. 2007) to perform single marker association tests. The false discovery rate (FDR) method of Benjamini and Hochberg (1995) was used to adjust for multiple testing. To determine whether SNPs significantly associated with AREase or POase activity further improved the variance explained by the five well-characterized SNPs (at positions -162,-108, 55, and 192), we calculated the difference between coefficients of determination (R2) for the full model including the SNP in question and the 5 known SNPs in comparison to a restricted models containing just the 5 known SNPs in STATA 10.0 (College Station, TX). A post-estimation Wald test was then performed to examine whether the fit of the full model was significantly better than the restricted model containing only the 4 well-known SNPs. PLINK was also used to compare the proportion of variance explained by functional SNPs versus multiple SNPs from the haplotype block within which they reside. The coefficient of determination (R2) of the regression model containing the single functional SNP (PON155 or PON1192) was calculated for both AREase and POase activity in mothers and children. Similarly, regression models (conditional haplotype-based testing) using inferred haplotypes comprised of multiple SNPs from either haplotype block 1 or 2 were performed for both AREase and POase activity.
Results
Identification of genetic variants in the PON gene cluster
In the PON1 gene, we identified 126 SNPs, 4 insertions, and 8 deletions in CHAMACOS mothers and children. The distribution of polymorphisms (including SNPs, insertions, and deletions) throughout the gene and approximate frequencies are shown in Figure 1. We did not observe any significant differences in allele frequencies of these genetic variants in mothers compared to children (p≫0.05, χ2 test). Only 15 genetic variants were located in exons while the majority of them (70%) were found in intronic regions. Of the PON1 polymorphisms identified in the Mexican-American CHAMACOS subjects, 26 SNPs, 2 insertions, and 2 deletions have not been reported in the current build (130) of the dbSNP database (http://www.ncbi.nlm.nih.gov/projects/SNP). In PON2, we observed two known nonsynonomous SNPs in exons 5 and 9 (A148G, rs12026; and S311C, rs7493) with MAF =23% and also two novel polymorphisms in exon nine: a rare (MAF=2%) SNP and a three base pair insertion (MAF=7%). In PON3 exons, we found only two SNPs. Both were common (MAF= 23 and 40% for rs13226149 and rs1053275, respectively) and had been previously described in other populations.
Figure 1. Distribution of PON1 genetic variants.

PON1, which has been mapped to the long arm of chromosome 7q21.3, was resequenced in 30 Mexican-American subjects (14 mothers and 16 unrelated children). The figure shows the distribution of SNPs identified throughout the PON1 gene (introns, exons, and 5’ and 3’ UTR regions). Numbers in the top row represent the number of SNPs with minor allele frequencies (MAFs) greater than 10% within each labeled region. Numbers in the middle row represent the number of SNPs with MAFs from 5-10% and those in the bottom row are for SNPs with MAF<5%. Overall, 12 indels and 126 SNPs were identified. The majority of the polymorphisms (n=86) had MAFs >10 %.
SNPs with a minor allele frequency greater than 20% in Mexican-American subjects from Northern California (Salinas Valley) are presented in Table I. Allele frequencies calculated from sequencing DNA from 30 subjects were not significantly different from those determined by subsequent genotyping (in parentheses in Table I) DNA from over 700 subjects after adjusting for multiple comparisons (chi-squared test). Using aggregate allele frequency data, we found that the calculated Nei’s genetic distance (D) between Salinas Mexicans and HapMap Mexicans from Los Angeles was shorter (0.1) than the distance between Salinas Mexicans and Seattle SNPs Caucasians (0.3). The allele frequencies for most (but not all) of the SNPs present in subjects were similar in range to those reported in Mexicans from Los Angeles, California, in the Hap Map 3 genotyping database(The International HapMap Consortium 2003). For instance, for the coding SNP PON1192, the frequency of the C allele (which results in the amino acid arginine, R) was 47% and 52% in Salinas Mexicans and Los Angeles Mexicans, respectively. In contrast, for many SNPs, the allele frequencies were quite different in Salinas Mexicans compared to Caucasians in the Seattle SNPs database. For example, 13 SNPs with less than 10% MAF in Caucasians (Seattle SNPs) had frequencies ≥20% in Salinas Mexicans. There were also a few SNPs whose frequencies were more comparable to those reported in Caucasians than Hap Map Mexicans (i.e. rs2299261 and rs2074351).
Table I.
PON1 SNPs in Mexican-American Mothers and Children (MAF≥20%)
| RS | Position (Chromosome) | Genomic Context or Predicted Function | Major Allele / Minor Allele | HWE | MAF in Salinas Mexicansa | Frequency in HapMap Mexicans (LosAngeles)b | Frequency in Seattle SNPs Caucasiansb |
|---|---|---|---|---|---|---|---|
| rs854572 | 94792632 | promoter (-909) | G/C | 1.00 | 48 (46) | 56 | 32 |
| rs854571 | 94792555 | promoter | C/T | 0.94 | 41 | 37 | 22 |
| rs705381 | 94791885 | promoter (-162) | C/T | 0.84 | 28 (20) | 16 | 18 |
| rs705379 | 94791831 | promoter (-108) | A/G | 0.68 | 45 (45) | 41 | |
| rs854570 | 94790628 | intron | A/C | 0.59 | 36 (42) | 43 | 24 |
| rs2237583 | 94788113 | intron | C/T | 0.42 | 30 (36) | 40 | 36 |
| rs854569 | 94787991 | intron | G/T | 0.86 | 38 (37) | 36 | 17 |
| rs2299262 | 94787864 | intron | C/T | 1.00 | 37 | 52 | 43 |
| rs854568 | 94787737 | intron | A/G | 1.00 | 40 | 33 | 17 |
| rs2299261 | 94787599 | intron | A/G | 1.00 | 25 | 13 | 37 |
| rs2049649 | 94787265 | intron | A/G | 0.02 | 47 (40) | 62 | 28 |
| rs3917490 | 94786777 | intron | T/C | 0.12 | 35 | 22 | 48 |
| rs854565 | 94786280 | intron | G/A | 0.82 | 25 | 22 | 20 |
| rs854564 | 94786118 | intron | T/G | 0.82 | 25 | 20 | |
| rs3917493 | 94785964 | intron | T/C | 0.61 | 20 | 2 | |
| rs854563 | 94785945 | intron | G/A | 0.02 | 27 (17) | 50 | |
| rs854562 | 94785905 | intron | C/T | 0.17 | 27 | 41 | |
| rs2074351 | 94785735 | intron | G/A | 0.64 | 27 (32) | 38 | 28 |
| rs854561 | 94784953 | intron | C/T | 0.13 | 27 (18) | 17 | 50 |
| rs28699500 | 94784842 | intron | A/G | 0.72 | 27 | ||
| rs705378 | 94784507 | intron | G/T | 0.05 | 28 | 17 | 48 |
| rs3917498 | 94784191 | intron | G/T | 0.42 | 47 | 61 | 30 |
| rs854560 | 94784020 | coding L55M | A/T | 0.05 | 28 (18) | 50 | |
| rs854559 | 94783808 | intron | G/A | 0.05 | 28 | 50 | |
| rs2301711 | 94783595 | intron | T/C | 0.61 | 20 | 20 | 2 |
| rs3917503 | 94783389 | intron | C/T | 0.42 | 47 (48) | 30 | |
| rs854558 | 94783310 | intron | C/T | 0.82 | 25 (31) | 20 | |
| rs854557 | 94783151 | intron | T/G | 0.05 | 28 | 50 | |
| rs854556 | 94782859 | intron | C/T | 0.05 | 28 | 50 | |
| rs2299259 | 94781333 | intron | G/A | 0.60 | 28 | 28 | |
| rs3917515 | 94780019 | intron | G/A | 0.61 | 20 | 2 | |
| rs3917518 | 94779717 | intron | C/A | 0.20 | 22 (18) | 2 | |
| rs3917521 | 94779351 | intron | G/A | 0.64 | 27 (27) | 28 | 13 |
| rs1157745 | 94778974 | intron | G/T | 0.08 | 47 | 17 | |
| rs3917527 | 94778194 | intron | T/C | 0.61 | 20 | 20 | 3 |
| rs3917529 | 94778171 | intron | A/G | 0.12 | 47 | 15 | |
| rs3917532 | 94778055 | intron | A/T | 0.12 | 47 | 9 | |
| rs3917533 | 94777766 | intron | G/A | 0.64 | 27 | 13 | |
| rs3917534 | 94777733 | intron | T/C | 0.12 | 47 | 17 | |
| rs2057681 | 94776193 | intron | A/G | 0.12 | 47 (49) | 53 | 18 |
| rs2158155 | 94776112 | intron | G/A | 0.61 | 20 | 2 | |
| rs3917538 | 94775829 | intron | G/A | 0.00 | 38 | 28 | 16 |
| rs3917541 | 94775560 | intron | G/A | 0.61 | 20 | 2 | |
| rs662 | 94775382 | coding Q192R | T/C | 0.12 | 47 (49) | 52 | 17 |
| rs3917542 | 94774628 | intron | C/T | 0.64 | 27 (27) | 28 | 13 |
| rs2269829 | 94774065 | intron | A/G | 0.09 | 43 | 48 | 15 |
| rs3917548 | 94773841 | intron | A/G | 0.61 | 20 | 20 | 2 |
| rs2237582 | 94772136 | intron | A/G | 0.12 | 47 | 17 | |
| rs3917556 | 94771125 | intron | T/C | 0.51 | 20 | 2 | |
| rs3917558 | 94770840 | intron | T/C | 0.20 | 22 | 4 | |
| rs7792044 | 94769207 | intron | T/C | 0.84 | 22 | ||
| rs854555 | 94768327 | intron | C/A | 1.00 | 45 | 51 | 16 |
| rs3917572 | 94767126 | intron | A/G | 0.80 | 22 | 2 | |
| rs854553 | 94766682 | intron | G/A | 0.66 | 39 | 13 | |
| rs854552 | 94765860 | utr-3 | T/C | 0.12 | 35 (36) | 37 | 13 |
| rs3735590 | 94765431 | utr-3 | G/A | 0.00 | 32 | 22 | 2 |
| rs854549 | 94764521 | utr-3 | C/A | 0.46 | 25 (17) | 39 | |
| rs10241881 | 94764042 | utr-3 | G/A | 0.80 | 22 |
Allele frequencies from sequencing in 60 chromosomes. Additionally, allele frequencies from genotyping in 339 children and 361 mothers are in parentheses
Frequencies are for the minor allele in Salinas Mexicans. Frequencies for HapMap Mexicans were from genotyping of 90 individuals of Mexican Ancestry in Los Angeles, CA. Frequencies for Seattle SNPs Caucasians were from genotyping of 60 CEPH individuals.
Indels identified in our cohort are summarized in Table II. Frequencies ranged from 3-34% for insertions and 7-30% for deletions. Although some of the indels have been previously reported in dbSNP, their population frequencies were only described in Caucasians for 5 of the 12 indels identified and no frequencies were available in Mexican or Hispanic populations. All insertions were located in introns as were all but two of the deletions. Insertions ranged from 1-4 base pairs in length and deletions ranged from 1-9 base pairs.
Table II.
Insertions and Deletions Identified in Mexican-American Mothers and Children
| RS | Position (Chromosome) | Genomic Context or Predicted Function | Major Allele/ Minor Allele | Frequency in Salinas Mexicans (Sequencing Data)a | MAF in Salinas Mexicans (Genotyping Data)b | MAF in Seattle SNPs Caucasiansc |
|---|---|---|---|---|---|---|
| Insertions | ||||||
| I1_Ins_Ad | 94787415 | intron | -/A | 3 | 0 | |
| I1_Ins_TTTd | 94786494 | intron | -/TTT | 13 | ||
| rs34459620 | 94786494 | intron | -/TTTT | 20 | ||
| rs3917539 | 94775633 | intron | -/AA | 34 | 47 | 19 |
| Deletions | ||||||
| FUTR_Del_ATGd | 94794927 | utr-5 | ATG/- | 7 | 22 | |
| rs3917506 | 94782120 | intron | A/- | 10 | 30 | 28 |
| rs3917525 | 94778416 | intron | G/- | 10 | 28 | 13 |
| rs3917549 | 94773136 | intron | A/- | 23 | 13 | |
| rs3917562 | 94770601 | intron | TGCT/- | 10 | 33 | 10 |
| rs59551306 | 94769370 | intron | AAAAAAAAC/- | 11 | ||
| I8_Del_ACd | 94766492 | intron | AC/- | 7 | ||
| rs3832528 | 94765277 | utr-3 | CTTT/- | 30 |
Frequency of indels from resequencing of 60 chromosomes. For identification of individuals with double deletions and does not differentiate between those with one or two copies of an insertion. Thus frequency here represents the numbers of individuals with double deletion genotypes (for deletions) or at least one insertion (for insertions).
Minor allele frequency (MAF) is shown for genotyping data in Salinas Mexicans.
DNA from 23 CEPH (Cohort of Utah residents with Western and European ancestry) were sequenced.
Unknown insertions and deletions are named first for location (I-intron, E-exon, FUTR-5’ UTR), type of polymorphism (Ins-insertion, Del-deletion), and then the base pair changes.
Linkage Disequilibrium Patterns in Salinas Mexicans
The linkage disequilibrium (LD) structure in 60 chromosomes of Salinas Mexican-Americans is shown graphically in Figure 2. The LD plot in this figure includes all SNPs (1000 base pairs up and downstream of PON1) with MAF > 10% whose genotype distributions did not deviate significantly from Hardy-Weinberg equilibrium. Using the confidence interval definition of Gabriel et al. (2002), we found 3 haplotype blocks in the PON1 gene for our cohort. Block 1 (5 kb) included the nonsynomous SNP PON155 (rs854560). Haplotype block 2 (5 kb) included the main coding SNP PON1192 (rs662)and haplotype block 3 spans the 3’ UTR region. Overall, the LD plot demonstrates the existence of several smaller regions of strong LD separated by regions of high recombination rather than one large nonrecombinant block spanning the entire PON1 gene region. The SNPs in the promoter region were also in high LD with each other although this small block did not meet the definitions of a haplotype block using the Gabriel et al. (2002) algorithm.
Figure 2. LD Plot of PON1 in Mexican-American mothers and children.
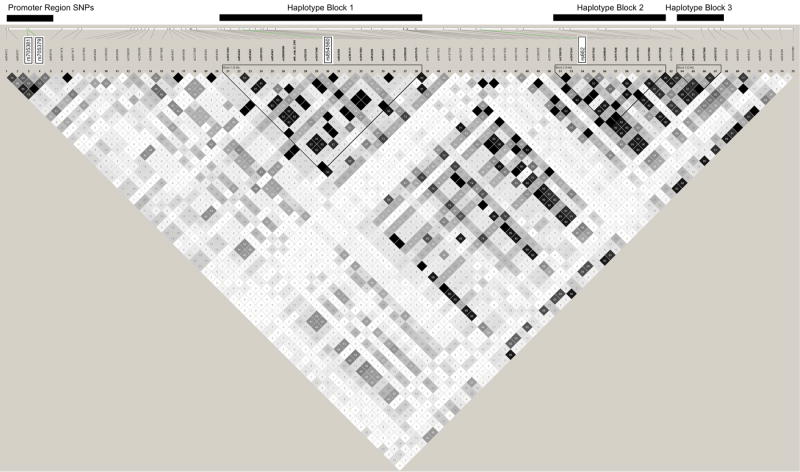
This figure is a schematic of the LD structure of PON1 in a Mexican population from Salinas Valley, California. It includes SNPs with minor allele frequencies greater than 10% from introns, exons, and within regions 1000 base pairs up and downstream of the PON1 gene. Only SNPs whose genotype distributions did not differ significantly from Hardy-Weinberg equilibrium were included (n= 72 SNPs). Known promoter SNPs PON1-108 and PON1-162, and coding SNPs PON155 and PON1192 are labeled in green. The numbers in the squares represent the correlation between SNPs (r2). Squares are white if SNP pairs are not correlated (r2=0), black if they are completely correlated (r2=1), and grey if 0 < r2 <1. Using the confidence intervals definition of haplotype blocks(Gabriel et al. 2002), we identified three haplotype blocks in PON1: one containing the PON155 SNP (Block 1), one containing the PON1192 SNP (Block 2), and one near the 3’ UTR region (Block 3).
Functional Activity of PON1 SNPs
Following resequencing of the PON cluster genes, we further genotyped 48 PON polymorphisms in 361 mothers and 339 children, 44 of which had MAFs >0.05. Minor allele frequencies are included in parentheses in Table I. In newborns, seven SNPs were associated with AREase activity after adjusting for multiple comparisons (Table III). The promoter SNP PON1-108, along with two SNPs in high LD with it (PON1-909 and rs854570), were strongly associated with AREase activity and the PON1-108 SNP had the most noticeable impact (β=-8.8 U/mL and R2=0.12). The coding SNP PON155, along with three SNPs in high LD with it (rs854463, rs854561, and rs854549), was also associated with AREase activity (β=-10.4 U/mL and R2=0.10).
Table III.
Association of PON Polymorphisms with AREase and POase Activity in Newborns (n=203) and Mothers (n=250)
| Newborn AREase | Mother AREase | Newborn POase | Mother POase | ||||||||||
|---|---|---|---|---|---|---|---|---|---|---|---|---|---|
| SNP | Position | BETA | R2 | P-VALUEa | BETA | R2 | P-VALUEa | BETA | R2 | P-VALUEa | BETA | R2 | P-VALUEa |
| FUTR_Del_ATGf | 94794927 | 4.0 | 0.02 | 0.16 | 15.5 | 0.04 | 0.02 | 26.3 | 0.01 | 0.20 | -1.4 | 0.00 | 0.98 |
| rs854572c | 94792632 | -7.7 | 0.09 | 1.69E-04 | -19.6 | 0.09 | 4.69E-05 | -82.9 | 0.11 | 4.04E-06 | -387.1 | 0.17 | 2.51E-11 |
| rs705379 | 94791831 | -8.8 | 0.12 | 1.62E-05 | -21.7 | 0.12 | 6.97E-07 | -88.3 | 0.14 | 2.19E-07 | -402.1 | 0.20 | 3.43E-13 |
| rs854570bc | 94790628 | 7.0 | 0.07 | 7.85E-04 | 11.9 | 0.03 | 0.03 | 88.3 | 0.13 | 6.74E-07 | 241.5 | 0.06 | 1.20E-04 |
| I1_SNP_G>Cf | 94790264 | 3.8 | 0.00 | 0.53 | 15.8 | 0.01 | 0.18 | 73.0 | 0.02 | 0.06 | 446.3 | 0.04 | 1.14E-03 |
| rs3917477 | 94789902 | 2.1 | 0.00 | 0.56 | 0.8 | 0.00 | 0.91 | 104.9 | 0.11 | 4.48E-06 | 436.0 | 0.13 | 5.67E-09 |
| I1_SNP_A>Cf | 94788215 | 2.8 | 0.00 | 0.57 | 9.9 | 0.01 | 0.31 | 101.8 | 0.05 | 1.87E-03 | 469.5 | 0.08 | 1.64E-05 |
| rs2237583c | 94788113 | 0.6 | 0.00 | 0.87 | -9.8 | 0.02 | 0.06 | -36.6 | 0.02 | 0.04 | -226.2 | 0.06 | 9.69E-05 |
| rs854569c | 94787991 | 1.9 | 0.00 | 0.53 | 4.4 | 0.00 | 0.43 | 74.3 | 0.08 | 6.85E-05 | 303.2 | 0.10 | 4.85E-07 |
| rs2049649d | 94787265 | -2.2 | 0.01 | 0.39 | 5.3 | 0.01 | 0.30 | -31.9 | 0.02 | 0.05 | -142.6 | 0.03 | 0.01 |
| rs854566b | 94786685 | 1.0 | 0.00 | 0.87 | 7.2 | 0.00 | 0.45 | -59.4 | 0.02 | 0.04 | -327.7 | 0.04 | 1.31E-03 |
| rs854563d | 94785945 | -10.5 | 0.10 | 5.60E-05 | -2.3 | 0.00 | 0.75 | -101.0 | 0.10 | 7.59E-06 | -450.8 | 0.17 | 7.21E-11 |
| rs2074351e | 94785735 | 1.6 | 0.00 | 0.57 | -0.5 | 0.00 | 0.91 | 56.5 | 0.05 | 2.57E-03 | 416.9 | 0.18 | 1.31E-11 |
| rs854561d | 94784953 | -10.5 | 0.10 | 5.60E-05 | -3.0 | 0.00 | 0.69 | -102.3 | 0.11 | 6.34E-06 | -438.2 | 0.16 | 1.71E-10 |
| rs62467349 | 94784396 | 5.4 | 0.02 | 0.11 | 10.6 | 0.01 | 0.18 | 97.6 | 0.09 | 3.58E-05 | 540.9 | 0.16 | 1.63E-10 |
| rs854560 | 94784020 | -10.4 | 0.10 | 5.60E-05 | -2.9 | 0.00 | 0.69 | -102.2 | 0.11 | 5.38E-06 | -453.2 | 0.16 | 1.63E-10 |
| rs3917503ed | 94783389 | -2.3 | 0.01 | 0.39 | 0.6 | 0.00 | 0.91 | -121.5 | 0.28 | 7.18E-15 | -612.1 | 0.51 | 6.31E-38 |
| rs854558e | 94783310 | 4.0 | 0.02 | 0.11 | 3.9 | 0.00 | 0.55 | -71.4 | 0.09 | 5.45E-05 | -482.9 | 0.22 | 3.25E-14 |
| rs3917506e | 94782120 | 0.8 | 0.00 | 0.84 | -1.8 | 0.00 | 0.78 | 48.6 | 0.03 | 0.01 | 408.9 | 0.16 | 1.63E-10 |
| rs3917518e | 94779717 | 1.8 | 0.00 | 0.57 | -2.3 | 0.00 | 0.75 | 110.7 | 0.14 | 1.56E-07 | 479.9 | 0.18 | 1.28E-11 |
| rs3917521e | 94779351 | 0.2 | 0.00 | 0.96 | -8.3 | 0.01 | 0.18 | 68.1 | 0.06 | 4.81E-04 | 478.2 | 0.21 | 1.97E-13 |
| rs3917525e | 94778416 | 0.3 | 0.00 | 0.95 | -8.1 | 0.01 | 0.18 | 69.7 | 0.07 | 3.84E-04 | 473.1 | 0.21 | 1.63E-13 |
| rs3917528 | 94778176 | -3.8 | 0.01 | 0.28 | -20.8 | 0.05 | 2.60E-03 | 3.3 | 0.00 | 0.93 | 166.1 | 0.02 | 0.05 |
| rs2299255 | 94776722 | 5.5 | 0.03 | 0.10 | 10.0 | 0.01 | 0.18 | 108.0 | 0.10 | 1.22E-05 | 565.8 | 0.18 | 1.28E-11 |
| rs2057681e | 94776193 | 1.4 | 0.00 | 0.57 | -7.9 | 0.02 | 0.12 | 128.3 | 0.31 | 1.33E-16 | 657.3 | 0.57 | 5.17E-45 |
| rs3917539e | 94775633 | 1.3 | 0.00 | 0.58 | -8.9 | 0.02 | 0.08 | 126.1 | 0.29 | 2.84E-15 | 640.4 | 0.55 | 1.12E-42 |
| rs3917541e | 94775560 | 2.3 | 0.01 | 0.53 | -2.3 | 0.00 | 0.75 | 118.6 | 0.16 | 8.94E-08 | 490.1 | 0.19 | 1.14E-11 |
| rs662 | 94775382 | 1.7 | 0.00 | 0.53 | -4.9 | 0.01 | 0.31 | 131.8 | 0.32 | 1.73E-17 | 682.9 | 0.60 | 3.70E-49 |
| rs3917542e | 94774628 | 0.2 | 0.00 | 0.96 | -8.1 | 0.01 | 0.18 | 68.5 | 0.07 | 4.81E-04 | 473.1 | 0.21 | 1.63E-13 |
| rs3917549ce | 94773136 | 3.7 | 0.02 | 0.14 | 2.5 | 0.00 | 0.69 | 145.9 | 0.36 | 1.98E-19 | 593.2 | 0.47 | 1.02E-34 |
| rs3917550 | 94772509 | 4.7 | 0.02 | 0.20 | 10.3 | 0.01 | 0.18 | 106.0 | 0.10 | 1.65E-05 | 577.7 | 0.19 | 3.03E-12 |
| rs3917562e | 94770601 | 0.1 | 0.00 | 0.97 | -13.9 | 0.05 | 4.20E-03 | 77.5 | 0.11 | 5.38E-06 | 379.4 | 0.18 | 1.22E-11 |
| rs854552ce | 94765860 | 2.8 | 0.01 | 0.28 | 7.0 | 0.01 | 0.18 | 78.3 | 0.11 | 5.38E-06 | 510.3 | 0.29 | 5.11E-19 |
| rs854551 | 94765613 | 3.2 | 0.01 | 0.43 | 14.5 | 0.02 | 0.11 | 18.5 | 0.00 | 0.50 | 320.1 | 0.05 | 1.14E-03 |
| rs854550 | 94765178 | 3.0 | 0.01 | 0.39 | 18.0 | 0.03 | 0.02 | 0.3 | 0.00 | 0.99 | 324.3 | 0.06 | 2.91E-04 |
| rs854549d | 94764521 | -6.7 | 0.04 | 0.03 | 1.1 | 0.00 | 0.90 | -75.3 | 0.06 | 1.24E-03 | -352.0 | 0.10 | 9.54E-07 |
| rs17773605 | 94762474 | -2.1 | 0.00 | 0.57 | -23.3 | 0.06 | 0.00 | 1.1 | 0.00 | 0.99 | 71.8 | 0.00 | 0.43 |
| rs854547e | 94761792 | 0.5 | 0.00 | 0.87 | -5.1 | 0.01 | 0.31 | 63.1 | 0.08 | 1.29E-04 | 489.4 | 0.30 | 2.59E-20 |
| rs854544e | 94761327 | -0.5 | 0.00 | 0.90 | -4.4 | 0.00 | 0.40 | 53.3 | 0.05 | 2.31E-03 | 457.7 | 0.28 | 1.27E-18 |
| rs13226149 | 94863536 | 3.1 | 0.01 | 0.28 | 17.3 | 0.05 | 4.20E-03 | 23.0 | 0.01 | 0.26 | 77.0 | 0.00 | 0.31 |
| rs2072200 | 94864096 | 0.1 | 0.00 | 0.97 | -11.6 | 0.03 | 0.02 | 16.8 | 0.01 | 0.32 | 20.4 | 0.00 | 0.74 |
| rs12026 | 94878952 | 3.2 | 0.01 | 0.28 | 16.3 | 0.04 | 0.01 | 11.4 | 0.00 | 0.61 | 86.1 | 0.01 | 0.25 |
| rs7493 | 94872711 | 3.5 | 0.01 | 0.27 | 18.3 | 0.05 | 2.60E-03 | 9.3 | 0.00 | 0.68 | 95.2 | 0.01 | 0.22 |
Adjusted for multiple comparisons using FDR method by Benjamini and Hochberg
LD (measured by r2) >0.2 with rs705381, PON1-162
LD (measured by r2) >0.2 with rs705379, PON1-108
LD (measured by r2) >0.2 with rs854560, PON155
LD (measured by r2) >0.2 with rs662, PON1192
Unknown insertions, deletions, and SNPs are named first for location (I-intron, E-exon, FUTR-5’ UTR), type of polymorphism (Ins-insertion, Del-deletion, SNP), and then the base pair changes.
In CHAMACOS mothers, there was a similar influence of promoter SNPs on AREase activity (Table III). However, the PON155 coding SNP and the two SNPs in high LD with it were no longer associated with AREase activity. Several variants not highly correlated to PON1-108 or PON1192, including a deletion in the 5’ UTR (FUTR_Del_ATG), one intronic SNP (rs3917328), one 3’ UTR SNP (rs854550), one SNP located in the 3’ UTR region of the nearby gene PPP1R9A (rs17773605), one PON3 SNP, and two PON2 SNPs were significantly associated with AREase activity. SNPs rs3917328, rs854550, and rs17773605 are predicted microRNA (miRNA) binding sites(Xu and Taylor 2009), suggesting a possible mechanism by which these SNPs could affect gene expression(Borel and Antonarakis 2008).
In CHAMACOS newborns, the majority of SNPs with noticeable effect on AREase activity were also significantly associated with POase activity, which was anticipated since enzyme quantity also affects POase activity (Table III). The coding SNP PON1192 was strongly associated with POase activity and explained 32% of POase variation. The single base pair deletion located in intron 7 (rs3917549) accounted for slightly more variance than PON1192 (36%). This is likely due to its LD with both PON1192 and PON1-108 SNPs. Four intronic SNPs (rs3917477, I1_SNP_A>C, rs62467349, rs2299255) not highly correlated (R2<0.20) with the known functional PON1 SNPs (PON1192, PON1-108, PON1-162 and PON155) were significantly associated with POase activity in newborns.
Similar to newborns, most of the SNPs associated with AREase activity were also affecting POase activity in CHAMACOS mothers. PON1192 explained almost 2-fold more POase variation in mothers (60%) compared to newborns (32%). In addition to the same four intronic SNPs that were associated with POase activity in newborns (rs3917477, I1_SNP_A>C, rs62467349, rs2299255), two more intronic SNPs (I1_SNP_G>C, rs3917528), and two SNPs in the 3’ UTR region (rs854551 and rs854550) were also associated with POase activity in mothers. As mentioned earlier, rs854550, which significantly affected AREase activity in mothers but not newborns, is a putative miRNA binding site (Xu and Taylor 2009). Using regression analysis, we found that including the intronic SNP rs3917550 into the model containing four known functional PON1 SNPs (PON1-162, PON1-108, PON155, PON1192), modestly (1.3%) but significantly improved assessment of functional significance of genetic variation on POase activity (p=0.02, Wald test). Similarly, inclusion of either rs62467349, rs854550, or rs2299255 (all intronic SNPs) also yielded models that explained slightly more (0.2-0.7%) POase variance than the four functional SNPs alone (p<0.05, Wald test).
Comparison of Phenotypic Effects of Single SNPs versus Their Haplotype Blocks
The majority of genetic studies involving PON1 primarily focus on known functional SNPs, particularly nonsynonomous coding SNPs PON155 and PON1192. We sought to determine whether using these single SNPs in association studies with molecular phenotype adequately captures the variation of the entire haplotype blocks within which they reside. We performed regression modeling to calculate the variance of AREase and POase explained by single functional SNPs (PON155 and PON1192) and inferred haplotypes comprising multiple SNPs within the same haplotype block (1or 2). The results are presented in Table IV. In both newborns and mothers, inferred haplotypes containing the six SNPs in haplotype block 1 explained only 2-3% more of the variance of AREase activity than the PON155 SNP alone. In contrast, they explained 3-fold more POase variation (36-56%) than PON155 SNP alone (11-16%). This three-fold difference was likely driven by the strong correlation between two SNPs in this haplotype block (rs3917503 and rs854558) with PON1192, a main determinant of POase activity.
Table IV.
Proportion of variance explained for AREase and POase activity by single PON1 tagSNPs and their haplotype blocks
| Newborns(n=203) |
Mothers (n=250) |
|||
|---|---|---|---|---|
| AREase R2 | POase R2 | AREase R2 | POase R2 | |
| rs854560, PON155 | 0.10 | 0.11 | <0.005 | 0.16 |
| Haplotype Block1a | 0.13 | 0.36 | 0.02 | 0.56 |
| rs662, PON1192 | <0.005 | 0.32 | 0.01 | 0.60 |
| Haplotype Block 2b | 0.02 | 0.36 | 0.07 | 0.62 |
Haplotype Block 1 included the following SNPs: rs854563, rs2074351, rs854561, rs62467349, rs3917503, and rs854558
Haplotype Block 2 included the following SNPs: rs3917541, rs3917542, rs3917549, and rs3917550
In CHAMACOS newborns, the haplotype block 2 SNPs explained an additional 4% of POase variation compared to PON1192 (32%) alone. In mothers, where the PON1192 SNP explains almost two-fold more POase activity variation (60%), the haplotype block 2 SNPs accounted for a similar amount of variation (62%).
Discussion
In this study, we resequenced PON cluster genes PON1, PON2, and PON3 in 16 children and 14 mothers of Mexican ancestry living in Salinas Valley, California, and identified over 90 genetic variants, including indels, which have not been previously explored, and also some novel SNPs. Many of these variants had significantly different allele frequencies in comparison to Caucasions despite an overall similar haplotype structure within the PON gene cluster. Several PON variants in CHAMACOS mothers and children, not in strong LD with main PON1 SNPs (R2<0.20), including a newly identified deletion in the 5’ UTR, were found to be associated with AREase and POase activity that are predictive of susceptibility to OPs and oxidative stress. Multiple polymorphisms provided a modest improvement of the assessment of functional significance for PON levels and substrate-specific activities in comparison to the haplotype tagSNPs. Functional effects of PON genetic variation also differed by age, and should be considered in protecting vulnerable subpopulations.
Overall, the distribution and location of haplotype blocks was similar in CHAMACOS Mexican-Americans from Salinas Valley, CA and Caucasians (HapMap data) with several regions of strong LD separated by regions of high recombination. In the CEPH population, Jarvik et al (2003) described four nonrecombinant regions – one at the promoter region, one near the PON155 SNP, one encompassing the PON1192 SNP, and one at the 3’ UTR region. Likewise, in Salinas Mexicans, we observed high LD in the promoter region and identified haplotype blocks surrounding the two nonsynonomous coding SNPs (blocks 1 and 2) and the 3’ UTR region (block 3). While the LD structure in Salinas mothers and children appears similar to that found in Caucasians, we did observe one important difference between the two; in Mexicans, many SNPs in haplotype blocks 2 and 3 were highly correlated with each other (across blocks) whereas these two blocks were more distinct with low LD between SNPs in CEPH subjects.
Although differences in LD structure between ethnic groups were modest, allele frequencies for some SNPs varied more noticeably. Several studies have previously demonstrated that the genotype distributions of the four main functional PON1 SNPs (192, 55, -108, -162) vary widely across ethnic groups (Chen et al. 2003; Rojas-Garcia et al. 2005). Here, we found allele frequencies of other PON1 polymorphisms in our population were also quite different from other studied groups. For instance, 12 SNPs with MAF less than 5% in Caucasians had much higher frequencies (20% or higher) in Mexicans. These potentially important and common SNPs could easily be overlooked in other studies if they are rare in well-characterized populations. Our data may aid study design in future PON genetic association studies in Mexican and other Latino populations, providing more detailed data on LD structure and further informing tagSNP selection.
Indels are the second most frequent type of polymorphism in the genome, and have been associated with human diseases (Kondrashov and Rogozin 2004; Sun et al. 2007; Zoghbi and Orr 2000). Despite their potential relevance, few PON1 indels have been functionally characterized. We observed four insertions and eight deletions in the PON1 gene, four of which were novel. Furthermore, four deletions and one insertion were significantly associated with either AREase or POase activity. Since several of them were also correlated with the coding SNP PON155, it is not clear whether these associations are due to the indels themselves or to their LD with PON155. Future studies should include additional types of sequence variations like indels because they are common genetic variants with likely functional significance.
Genetic association studies often focus on coding SNPs, particularly nonsynonomous SNPs resulting in amino acid changes because they are likely to be functional. However, recent studies suggest that SNPs in other regions of the genome, including introns and 3’UTR regions may also have functional consequences. Intronic SNPs can affect splicing elements thereby influencing transcription and gene expression(Le Hir et al. 2003). In our study, we identified several intronic SNPs which were associated with AREase and POase activity. Splicing is one potential mechanism explaining their impact on PON1 phenotype. MicroRNA, which is involved in post translational regulation of gene expression, binds to sequences in the 3’UTR region(Borel and Antonarakis 2008). Several studies have shown SNPs in these miRNA binding sites can mediate regulation of gene expression(Abelson et al. 2005; Sethupathy et al. 2007). In our study, we identified several SNPs in the 3’UTR that are predicted miRNA binding sites and were associated with AREase activity. Future studies employing reporter silencing assays may help to establish whether these SNPs affect gene regulation through miRNA-mediated mechanisms.
Since the LD structure of PON1 comprises 4 haplotype blocks in Caucasians, Jarvik et al.(2003) previously suggested that most of PON1 variation could be captured using just the two promoter SNPs PON1-108 and PON1-162 and the two coding SNPs PON155 and PON1192. Indeed many studies, including our own, have examined effects of these SNPs (and also PON1-909). In this study, we extended our analyses to include SNPs and indels spanning the entire PON gene cluster and identified several additional genetic variants associated with AREase and POase activity. However, in combination with the four known functional SNPs, they still only explain a small percentage of additional phenotypic variation. Particularly with AREase activity, other factors including genetic variants in other genes, environmental exposure or epigenetic modification may also influence PON1 expression. We also found that similar to previous studies showing differences in the percent variation explained by the same SNPs in newborns and mothers(Chen et al. 2003; Holland et al. 2006), the relative contribution of some SNPs to PON1 phenotype was different in these age groups. For instance, the 3’ UTR SNP (rs854551) was not significantly associated to POase activity in newborns, yet was strongly associated with POase activity in mothers (p=1.14 × 10⁻³). These data suggest that the role of specific genetic variants is not static and at different ages or physiological conditions (at the time of delivery), their relative influence on PON1 phenotype may change.
In conclusion, we sequenced PON family genes in a cohort of Mexican-American children and mothers from Salinas Valley, CA, and identified several novel SNPs, and indels including several SNPs in introns and the 3’UTR, some of which were independently associated with PON1 phenotype. Allele frequencies of many of the SNPs were quite different in our Mexican-Americans in comparison to Caucasians. Additionally, the relative genetic contribution of PON1 SNPs toward molecular phenotype (enzyme activity) differed between mothers and their children. These functional effects of PON variation should be considered in protecting vulnerable subpopulations from OPs and other inducers of oxidative stress. Ethnic differences in the frequency and distribution of susceptible genotypes should also be taken into account in genetic association studies of PON.
Figure 3. Box plots of AREase and POase activities in newborns and mothers.
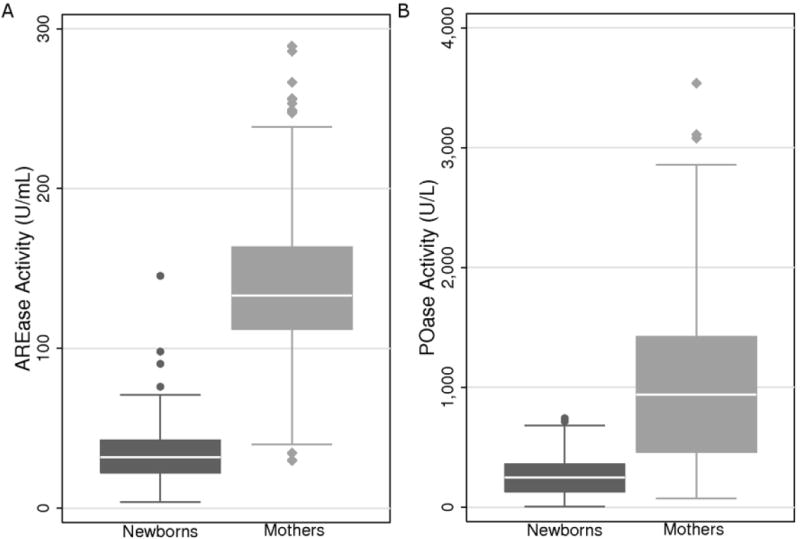
(A) AREase activity (U/mL) was on average 4-fold lower in newborns (n=203) than mothers (n=250). (B) POase activity (U/L) was also on average 4-fold lower in newborns than mothers. Activity ranged from 7.42-742.8 U/L in newborns and from 75.2-3537.7 U/L in mothers.
Acknowledgments
We gratefully acknowledge CHAMACOS staff, community partners, and especially the CHAMACOS participants. We appreciate the helpful discussions and comments from Drs. Asa Bradman and Kim Harley.
Funding: This work was supported by grants from the U.S. Environmental Protection Agency (R826886, R82670901) and the National Institute of Environmental Health Science (R01ESO12503-03, PO1 ES009605). The contents of this paper are solely the responsibility of the authors and do not necessarily represent the official views of the NIEHS and the EPA.
Footnotes
Conflict of Interest Statement: The authors declare they have no competing financial interests.
References
- Abelson JF, Kwan KY, O’Roak BJ, Baek DY, Stillman AA, Morgan TM, Mathews CA, Pauls DL, Rasin MR, Gunel M, et al. Sequence variants in SLITRK1 are associated with Tourette’s syndrome. Science. 2005;310(5746):317–20. doi: 10.1126/science.1116502. [DOI] [PubMed] [Google Scholar]
- Aviram M, Rosenblat M. Paraoxonases 1, 2, and 3, oxidative stress, and macrophage foam cell formation during atherosclerosis development. Free Radic Biol Med. 2004;37(9):1304–16. doi: 10.1016/j.freeradbiomed.2004.06.030. [DOI] [PubMed] [Google Scholar]
- Barrett JC, Fry B, Maller J, Daly MJ. Haploview: analysis and visualization of LD and haplotype maps. Bioinformatics. 2005;21(2):263–5. doi: 10.1093/bioinformatics/bth457. [DOI] [PubMed] [Google Scholar]
- Benjamini Y, Hochberg Y. Controlling the False Discovery Rate: A Practical and Powerful Approach to Multiple Testing. Journal of the Royal Statistical Society Series B (Methodological) 1995;57(1):289–300. [Google Scholar]
- Bhattacharyya T, Nicholls SJ, Topol EJ, Zhang R, Yang X, Schmitt D, Fu X, Shao M, Brennan DM, Ellis SG, et al. Relationship of paraoxonase 1 (PON1) gene polymorphisms and functional activity with systemic oxidative stress and cardiovascular risk. Jama. 2008;299(11):1265–76. doi: 10.1001/jama.299.11.1265. [DOI] [PMC free article] [PubMed] [Google Scholar]
- Borel C, Antonarakis SE. Functional genetic variation of human miRNAs and phenotypic consequences. Mamm Genome. 2008;19(7-8):503–9. doi: 10.1007/s00335-008-9137-6. [DOI] [PubMed] [Google Scholar]
- Brophy VH, Jampsa RL, Clendenning JB, McKinstry LA, Jarvik GP, Furlong CE. Effects of 5’ regulatory-region polymorphisms on paraoxonase-gene (PON1) expression. Am J Hum Genet. 2001;68(6):1428–36. doi: 10.1086/320600. [DOI] [PMC free article] [PubMed] [Google Scholar]
- Chen J, Chan W, Wallenstein S, Berkowitz G, Wetmur JG. Haplotype-phenotype relationships of paraoxonase-1. Cancer Epidemiol Biomarkers Prev. 2005;14(3):731–4. doi: 10.1158/1055-9965.EPI-04-0538. [DOI] [PubMed] [Google Scholar]
- Chen J, Kumar M, Chan W, Berkowitz G, Wetmur JG. Increased influence of genetic variation on PON1 activity in neonates. Environ Health Perspect. 2003;111(11):1403–9. doi: 10.1289/ehp.6105. [DOI] [PMC free article] [PubMed] [Google Scholar]
- Connelly PW, Maguire GF, Picardo CM, Teiber JF, Draganov D. Development of an immunoblot assay with infrared fluorescence to quantify paraoxonase 1 in serum and plasma. J Lipid Res. 2008;49(1):245–50. doi: 10.1194/jlr.D700022-JLR200. [DOI] [PubMed] [Google Scholar]
- Costa LG, Cole TB, Vitalone A, Furlong CE. Measurement of paraoxonase (PON1) status as a potential biomarker of susceptibility to organophosphate toxicity. Clin Chim Acta. 2005a;352(1-2):37–47. doi: 10.1016/j.cccn.2004.09.019. [DOI] [PubMed] [Google Scholar]
- Costa LG, Richter RJ, Li WF, Cole T, Guizzetti M, Furlong CE. Paraoxonase (PON 1) as a biomarker of susceptibility for organophosphate toxicity. Biomarkers. 2003;8(1):1–12. doi: 10.1080/13547500210148315. [DOI] [PubMed] [Google Scholar]
- Costa LG, Vitalone A, Cole TB, Furlong CE. Modulation of paraoxonase (PON1) activity. Biochem Pharmacol. 2005b;69(4):541–50. doi: 10.1016/j.bcp.2004.08.027. [DOI] [PubMed] [Google Scholar]
- Deakin S, Leviev I, Brulhart-Meynet MC, James RW. Paraoxonase-1 promoter haplotypes and serum paraoxonase: a predominant role for polymorphic position - 107, implicating the Sp1 transcription factor. Biochem J. 2003;372(Pt 2):643–9. doi: 10.1042/BJ20021670. [DOI] [PMC free article] [PubMed] [Google Scholar]
- Deakin SP, James RW. Genetic and environmental factors modulating serum concentrations and activities of the antioxidant enzyme paraoxonase-1. Clin Sci (Lond) 2004;107(5):435–47. doi: 10.1042/CS20040187. [DOI] [PubMed] [Google Scholar]
- Draganov DI, Teiber JF, Speelman A, Osawa Y, Sunahara R, La Du BN. Human paraoxonases (PON1, PON2, and PON3) are lactonases with overlapping and distinct substrate specificities. J Lipid Res. 2005;46(6):1239–47. doi: 10.1194/jlr.M400511-JLR200. [DOI] [PubMed] [Google Scholar]
- Erlich PM, Lunetta KL, Cupples LA, Huyck M, Green RC, Baldwin CT, Farrer LA. Polymorphisms in the PON gene cluster are associated with Alzheimer disease. Hum Mol Genet. 2006;15(1):77–85. doi: 10.1093/hmg/ddi428. [DOI] [PubMed] [Google Scholar]
- Eskenazi B, Bradman A, Gladstone E, Jaramillo S, Birch K, Holland N. CHAMACOS, a longitudinal birth cohort study: lessons from the fields. J Childrens Healt. 2003;1:3–27. [Google Scholar]
- Furlong CE, Holland N, Richter RJ, Bradman A, Ho A, Eskenazi B. PON1 status of farmworker mothers and children as a predictor of organophosphate sensitivity. Pharmacogenet Genomics. 2006;16(3):183–90. doi: 10.1097/01.fpc.0000189796.21770.d3. [DOI] [PubMed] [Google Scholar]
- Gabriel SB, Schaffner SF, Nguyen H, Moore JM, Roy J, Blumenstiel B, Higgins J, DeFelice M, Lochner A, Faggart M, et al. The structure of haplotype blocks in the human genome. Science. 2002;296(5576):2225–9. doi: 10.1126/science.1069424. [DOI] [PubMed] [Google Scholar]
- Harel M, Aharoni A, Gaidukov L, Brumshtein B, Khersonsky O, Meged R, Dvir H, Ravelli RB, McCarthy A, Toker L, et al. Structure and evolution of the serum paraoxonase family of detoxifying and anti-atherosclerotic enzymes. Nat Struct Mol Biol. 2004;11(5):412–9. doi: 10.1038/nsmb767. [DOI] [PubMed] [Google Scholar]
- Harley K, Eskenazi B, Block G. The association of time in the US and diet during pregnancy in low-income women of Mexican descent. Paediatr Perinat Epidemiol. 2005;19(2):125–34. doi: 10.1111/j.1365-3016.2005.00640.x. [DOI] [PMC free article] [PubMed] [Google Scholar]
- Holland N, Furlong C, Bastaki M, Richter R, Bradman A, Huen K, Beckman K, Eskenazi B. Paraoxonase polymorphisms, haplotypes, and enzyme activity in Latino mothers and newborns. Environ Health Perspect. 2006;114(7):985–91. doi: 10.1289/ehp.8540. [DOI] [PMC free article] [PubMed] [Google Scholar]
- Horke S, Witte I, Wilgenbus P, Kruger M, Strand D, Forstermann U. Paraoxonase-2 reduces oxidative stress in vascular cells and decreases endoplasmic reticulum stress-induced caspase activation. Circulation. 2007;115(15):2055–64. doi: 10.1161/CIRCULATIONAHA.106.681700. [DOI] [PubMed] [Google Scholar]
- Huen K, Harley K, Bradman A, Eskenazi B, Holland N. Longitudinal Changes in PON1 Enzymatic Activities in Mexican-American Mothers and Children with Different Genotypes and Haplotypes. Toxicol Appl Pharmacol. 2010 doi: 10.1016/j.taap.2009.12.031. In Press. [DOI] [PMC free article] [PubMed] [Google Scholar]
- Huen K, Richter R, Furlong C, Eskenazi B, Holland N. Validation of PON1 enzyme activity assays for longitudinal studies. Clin Chim Acta. 2009;402(1-2):67–74. doi: 10.1016/j.cca.2008.12.019. [DOI] [PMC free article] [PubMed] [Google Scholar]
- Jarvik GP, Hatsukami TS, Carlson C, Richter RJ, Jampsa R, Brophy VH, Margolin S, Rieder M, Nickerson D, Schellenberg GD, et al. Paraoxonase activity, but not haplotype utilizing the linkage disequilibrium structure, predicts vascular disease. Arterioscler Thromb Vasc Biol. 2003;23(8):1465–71. doi: 10.1161/01.ATV.0000081635.96290.D3. [DOI] [PubMed] [Google Scholar]
- Koda Y, Tachida H, Soejima M, Takenaka O, Kimura H. Population differences in DNA sequence variation and linkage disequilibrium at the PON1 gene. Ann Hum Genet. 2004;68(Pt 2):110–9. doi: 10.1046/j.1529-8817.2003.00077.x. [DOI] [PubMed] [Google Scholar]
- Kondrashov AS, Rogozin IB. Context of deletions and insertions in human coding sequences. Hum Mutat. 2004;23(2):177–85. doi: 10.1002/humu.10312. [DOI] [PubMed] [Google Scholar]
- Kujiraoka T, Oka T, Ishihara M, Egashira T, Fujioka T, Saito E, Saito S, Miller NE, Hattori H. A sandwich enzyme-linked immunosorbent assay for human serum paraoxonase concentration. J Lipid Res. 2000;41(8):1358–63. [PubMed] [Google Scholar]
- Landers JE, Shi L, Cho TJ, Glass JD, Shaw CE, Leigh PN, Diekstra F, Polak M, Rodriguez-Leyva I, Niemann S, et al. A common haplotype within the PON1 promoter region is associated with sporadic ALS. Amyotroph Lateral Scler. 2008;9(5):306–14. doi: 10.1080/17482960802233177. [DOI] [PMC free article] [PubMed] [Google Scholar]
- Le Hir H, Nott A, Moore MJ. How introns influence and enhance eukaryotic gene expression. Trends Biochem Sci. 2003;28(4):215–20. doi: 10.1016/S0968-0004(03)00052-5. [DOI] [PubMed] [Google Scholar]
- Li HL, Liu DP, Liang CC. Paraoxonase gene polymorphisms, oxidative stress, and diseases. J Mol Med. 2003;81(12):766–79. doi: 10.1007/s00109-003-0481-4. [DOI] [PubMed] [Google Scholar]
- Li J, Wang X, Huo Y, Niu T, Chen C, Zhu G, Huang Y, Chen D, Xu X. PON1 polymorphism, diabetes mellitus, obesity, and risk of myocardial infarction: Modifying effect of diabetes mellitus and obesity on the association between PON1 polymorphism and myocardial infarction. Genet Med. 2005;7(1):58–63. doi: 10.1097/01.gim.0000151152.78092.ca. [DOI] [PubMed] [Google Scholar]
- Primo-Parmo SL, Sorenson RC, Teiber J, La Du BN. The human serum paraoxonase/arylesterase gene (PON1) is one member of a multigene family. Genomics. 1996;33(3):498–507. doi: 10.1006/geno.1996.0225. [DOI] [PubMed] [Google Scholar]
- Purcell S, Neale B, Todd-Brown K, Thomas L, Ferreira MA, Bender D, Maller J, Sklar P, de Bakker PI, Daly MJ, et al. PLINK: a tool set for whole-genome association and population-based linkage analyses. Am J Hum Genet. 2007;81(3):559–75. doi: 10.1086/519795. [DOI] [PMC free article] [PubMed] [Google Scholar]
- Rainwater DL, Rutherford S, Dyer TD, Rainwater ED, Cole SA, Vandeberg JL, Almasy L, Blangero J, Maccluer JW, Mahaney MC. Determinants of variation in human serum paraoxonase activity. Heredity. 2009;102(2):147–54. doi: 10.1038/hdy.2008.110. [DOI] [PMC free article] [PubMed] [Google Scholar]
- Rojas-Garcia AE, Solis-Heredia MJ, Pina-Guzman B, Vega L, Lopez-Carrillo L, Quintanilla-Vega B. Genetic polymorphisms and activity of PON1 in a Mexican population. Toxicol Appl Pharmacol. 2005;205(3):282–9. doi: 10.1016/j.taap.2004.10.015. [DOI] [PubMed] [Google Scholar]
- Sanghera DK, Manzi S, Minster RL, Shaw P, Kao A, Bontempo F, Kamboh MI. Genetic variation in the paraoxonase-3 (PON3) gene is associated with serum PON1 activity. Ann Hum Genet. 2008;72(Pt 1):72–81. doi: 10.1111/j.1469-1809.2007.00400.x. [DOI] [PubMed] [Google Scholar]
- Sethupathy P, Borel C, Gagnebin M, Grant GR, Deutsch S, Elton TS, Hatzigeorgiou AG, Antonarakis SE. Human microRNA-155 on chromosome 21 differentially interacts with its polymorphic target in the AGTR1 3’ untranslated region: a mechanism for functional single-nucleotide polymorphisms related to phenotypes. Am J Hum Genet. 2007;81(2):405–13. doi: 10.1086/519979. [DOI] [PMC free article] [PubMed] [Google Scholar]
- Sun T, Gao Y, Tan W, Ma S, Shi Y, Yao J, Guo Y, Yang M, Zhang X, Zhang Q, et al. A six-nucleotide insertion-deletion polymorphism in the CASP8 promoter is associated with susceptibility to multiple cancers. Nat Genet. 2007;39(5):605–13. doi: 10.1038/ng2030. [DOI] [PubMed] [Google Scholar]
- The International HapMap Consortium. The International HapMap Project. Nature. 2003;426(6968):789–96. doi: 10.1038/nature02168. [DOI] [PubMed] [Google Scholar]
- Xu Z, Taylor JA. SNPinfo: integrating GWAS and candidate gene information into functional SNP selection for genetic association studies. Nucleic Acids Res. 2009;37(Web Server issue):W600–5. doi: 10.1093/nar/gkp290. [DOI] [PMC free article] [PubMed] [Google Scholar]
- Zintzaras E, Hadjigeorgiou GM. Association of paraoxonase 1 gene polymorphisms with risk of Parkinson’s disease: a meta-analysis. J Hum Genet. 2004;49(9):474–81. doi: 10.1007/s10038-004-0176-x. [DOI] [PubMed] [Google Scholar]
- Zoghbi HY, Orr HT. Glutamine repeats and neurodegeneration. Annu Rev Neurosci. 2000;23:217–47. doi: 10.1146/annurev.neuro.23.1.217. [DOI] [PubMed] [Google Scholar]