Abstract
In this review, we will bring the reader up to date with recent advances in the use of galvanic replacement reactions to engineer highly tunable nanostructures for a variety of applications. We will begin by discussing the variety of templates that have been used for such reactions and how the structural details (e.g., shape, size, and defects, among others) have interesting effects on the ultimate product, beyond serving as a simple site for deposition. This will be followed by a discussion of how we can manipulate the processes of alloying and dealloying to produce novel structures and how the type of precursor affects the final properties. Finally, the interesting optical properties of these materials and some innovative applications in areas of biomedical engineering and catalysis will be discussed, completing our overview of the state of the art in galvanic replacement.
Keywords: Nanomaterials, Galvanic Replacement, Localized Surface Plasmon Resonance, Alloy, Nanocage
1. Introduction
Metallic nanostructures have been extensively studied in recent years for applications in catalysis [1-4], plasmonics [5-8], sensing [9-13], and biomedicine [14-18]. In order to further enhance the performance of these materials, there has been a strong effort in developing new methods for precisely engineering the structures and properties of these systems [2, 19]. Of the many techniques that have been demonstrated, galvanic replacement is particularly interesting due to its high tunability and the possibility to study the intricacies of alloying and dealloying in metallic nanostructures [20, 21]. Galvanic replacement occurs spontaneously when atoms of a metal reacts with ions of another metal having a higher electrochemical potential in a solution phase. The metal atoms are oxidized and dissolved into the solution, while the metal ions are reduced and plated on the surface of the metal template. This simple reaction can be used with a wide variety of metal templates and salt precursors and is limited by little more than the requirement of an appropriate difference in the electrochemical potentials between the two metals. Based on fundamental chemistry, this reaction provides a straightforward and versatile route to a broad range of simple and complex structures including hollow nanocrystals, alloyed nanostructures with controllable elemental compositions, and nanoparticles with tunable optical properties [20, 21].
The most important factor in controlling the morphology of the final structure in a galvanic replacement reaction is the shape or morphology of the starting template [22]. As the newly formed metal atoms will deposit on the surface of the template, the final structure should closely resemble the original template. In a typical galvanic replacement reaction, the final structure is a hollow shell with a shape similar to that of the template and slightly larger dimensions [22]. Yet as with many areas, some of the most interesting observations come from the exceptions. In the first part of this review article, we will discuss the galvanic replacement reaction with a number of different types of templates, and highlight some of the engineering strategies that have come out of these comparisons.
The alloying and dealloying processes involved in a galvanic replacement reaction also have a strong impact on both the structures and properties of the final products [20, 21]. After a brief introduction to relevant processes such as atomic diffusion, we will discuss some of the ways in which these processes affect the morphology and properties of nanostructures synthesized using this approach. We will also discuss the effect that the choice of a salt precursor has on the evolution of a galvanic replacement reaction, as different morphologies have been observed when switching between a Au(III) salt and a Au(I) salt.
Finally, we will discuss some of the interesting optical properties and promising applications of structures fabricated using the galvanic replacement method. Due to the interaction between the plasmons of the inner and outer surfaces of a hollow structure, it is simple and convenient to tune the localized surface plasmon resonance (LSPR) peaks into the near-infrared (NIR) region for nanoparticles synthesized using the galvanic replacement reaction [23, 24]. Structures with strong optical absorption in this region are ideal for a number of biomedical applications, as NIR light can penetrate significantly deeper into soft tissue than visible light [14-18, 25-27]. Particles with thin walls can also show more sensitivity to their dielectric environment, an ideal property for sensing applications [24, 28, 29]. Though it is also possible to create hollow nanostructures with some of these properties by depositing small metal particles on the surface of a dissolvable template, this method is often limited by the difficulty of creating smooth, continuous shells with controllable thicknesses below 10 nm [30, 31]. The resulting shells are typically less robust than those synthesized with the galvanic replacement reaction due to their polycrystallinity, and in some cases require additional synthetic steps, such as dissolution of the template [32].
In addition to biomedical applications, alloyed nanomaterials such as those generated with a galvanic replacement reaction also show great promise for catalysis -- it has been shown that bimetallic nanostructures can be superior to their individual components for certain catalytic applications [4, 33-36]. Galvanic replacement offers a simple and controllable way to produce multi-component nanostructures with enhanced porosity and surface area, and is thus well-suited for such applications [37-39]. Furthermore, some reports have shown enhanced catalytic capabilities with hollow nanoparticles, likely due to the high surface areas. For example, Pd nanoshells were shown to retain their catalytic ability for multiple cycles, unlike their solid counterparts, for organic reactions such as Suzuki coupling [40, 41].
2. Template Effects
2.1 Galvanic Replacement between Ag Nanocubes and HAuCl4
A galvanic replacement reaction can be split into two half reactions, the oxidation/dissolution of a metal at the anode, and the reduction/deposition of the ions of a second metal at the cathode. For this reaction to occur, it is critical that the electrochemical potential of the metal ions is higher than that of the solid metal. The relevant equations for a typical reaction between Au and Ag are shown below:
Half Reactions:
| (1) |
| (2) |
Combined Reaction:
| (3) |
The electrochemical potentials of a number of commonly used metals are shown in Table 1. Note that the potentials listed here are for ideal reactions at 25 °C and 1 atm, and that the elevated temperature of this reaction (100 °C), the presence of Cl- ions, and other non-standard conditions can all affect the actual potentials [42,43].
Table 1.
Electrochemical potentials of relevant species relative to the standard hydrogen electrode (SHE)
| Half Reaction | E°/V vs SHEa |
|---|---|
| Ag+ + e- → Ag | 0.80 |
| Au3+ + 3e- → Au | 1.50 |
| Au+ + e- → Au | 1.69 |
| Pd2+ + 2e- → Pd | 0.95 |
| Pt2+ + 2e- → Pt | 1.18 |
For ideal reactions at 25 °C and 1 atm. Elevated temperatures, the presence of ions such as Cl- ions, and other non-standard conditions can all affect the actual potentials [42].
In recent years, the synthesis of solid metal nanocrystals having a wide variety of shapes and sizes has been achieved through careful control of the reaction conditions such as temperature, the concentrations of trace ions, and surfactant choice [19]. Many of these nanocrystals can be used as templates for galvanic replacement reactions, making it possible to use this technique to synthesize hollow nanostructures with well-defined and controllable sizes and shapes. A typical example can be found in the reaction between Ag nanocubes and HAuCl4. This reaction is typically performed in boiling water to prevent the precipitation of AgCl onto the surface of the template [44]. Figure 1 shows a schematic illustration and scanning electron microscopy (SEM) images of the morphological transformations at different stages of this reaction (i.e., after the titration with different volumes of HAuCl4) for a sample of Ag nanocubes ∼100 nm in edge length [22]. Figure 1B shows SEM image of the starting template of solid Ag nanocubes. The inset shows an electron diffraction pattern obtained with the beam perpendicular to the surface of a nanocube. The square pattern indicates that the cube was bound by {100} facets.
Figure 1.
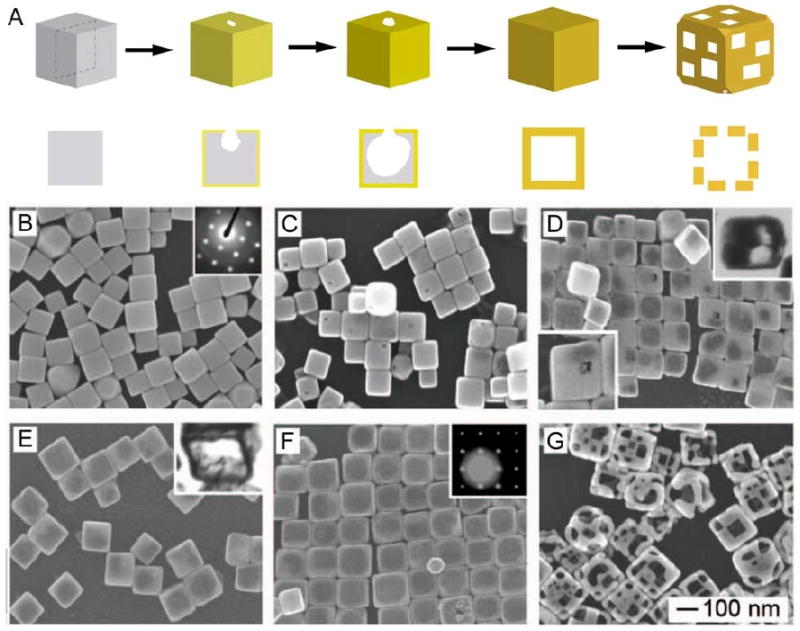
(A) Schematic illustrating the major morphological and structural changes involved in the galvanic replacement reaction between a sharp Ag nanocube and HAuCl4. The cross-sectional views correspond to the plane along the dashed lines. (B) SEM image of the sacrificial templates, Ag nanocubes; and (C-G) SEM images for the hollow nanostructures obtained from sequential stages of the galvanic replacement reaction. Insets of (D) and (E) are microtomed TEM samples showing the hollow interior, and insets of (B) and (F) are the electron diffraction patterns for the corresponding nanostructures. The 100 nm scale bar applies to all SEM images. Reproduced with permission from [22], Copyright 2004 American Chemical Society.
When HAuCl4 was added, a small pit formed on the surface of the nanocube, likely at a defect site (Figure 1C) [45]. As the titration was continued, this pit expanded into the interior of the nanocube and the resulting structure became increasingly hollow as more Ag was dissolved. Simultaneously, Au atoms plated on the surface of the nanocube, protecting the outer surface of Ag from oxidation. A small increase in size (10-20% of the initial cube size) was observed as the reaction progressed, indicating that the Au atoms were deposited on the outer surface [22]. The conductive nature of the particle allows for electrons generated at the anode to move freely to the cathode where Au3+ ions are reduced and deposited. Figure 1D shows the product after enough HAuCl4 had been added to partially hollow out the Ag nanocube. The inset shows a microtomed transmission electron microscopy (TEM) image of a single particle, clearly showing the enlarged void inside the particle.
Eventually, this void expanded to fill the entire particle, resulting in a hollow shell with a shape similar to the original template, typically referred to as a nanobox (Figure 1E). A TEM image of a microtomed sample from this stage is shown in the inset of Figure 1E, showing the thin walled, hollow nanostructure. Notably, the pore in the surface had closed due to volume diffusion, surface diffusion, and/or dissolution and deposition [22, 46]. At this stage, the walls were composed of an Au-Ag alloy. Due to the close match in lattice constant and the high rate of interdiffusion between Au and Ag at 100 °C, an alloy quickly formed as the Au was deposited. The details of alloying and dealloying processes will be discussed more thoroughly in Section 3.
As additional HAuCl4 was added, Ag was selectively removed from the alloyed walls, as no pure Ag remained. Due to the 3:1 stoichiometric ratio between Ag and Au, many vacancies were generated during this process. In order to incorporate these vacancies, the nanobox was forced to reconstruct into a structure with a lower surface area [22]. The sharp corners of the cubic box became truncated through the creation of triangular {111} facets at each corner, as shown in Figure 1F. As the dealloying process continued and additional voids were generated, they coalesced into pores on the surface, transforming the nanobox into a nanocage (Figure 1G). Note that the term nanocage is not shape specific, and can be applied to hollow and porous particles of other morphologies as well. If this reaction was continued even further, the pores became so large that the structure began to fall apart, resulting in Au nanoparticles with irregular shapes. The gradual replacement of Ag with Au allows for the creation of nanostructures with specific compositional ratios, an important ability given the strong effect that alloy composition has been shown to play in catalytic ability.
It is also important to mention that the final product retained the single crystalline nature of the initial nanocube due to the epitaxial relationship between the Ag nanocube and the Au shell that was deposited. This is evident in the diffraction pattern taken from a single Au nanobox, shown in the inset of Figure 1F. The square pattern of spots indicates that the nanobox was bound by single-crystal {100} facets, just like the solid Ag nanocube. The face-centered cubic (fcc) lattice constants of Au and Ag are almost identical, 4.08 and 4.09 Å, respectively, so the diffraction pattern was not expected to change after the incorporation of Au.
2.2 Nanocages with Controlled Pores
When more than one type of facets are present on the surface of the initial Ag nanocubes, it is possible to synthesize Au nanocages with controlled pores at the corners [47]. In Figure 2, 42-nm Ag nanocubes with truncated corners were used as the starting template, with six {100} facets and 8 {111} facets (truncation may also result in the presence of some {110} facets). Instead of forming pores randomly across the surface as seen with sharp nanocubes, both the initial pitting and the final pore formation occurred selectively on the {111} facets at the corners instead of on the {100} side faces, as illustrated in the schematic in Figure 2A. Figure 2B shows SEM and TEM (inset) images of the truncated Ag nanocubes used as a starting material. These cubes were generated through early quenching of a large-scale sulfide mediated polyol synthesis of Ag nanocubes, as the sharpening of the corners is the last stage of the growth process [48]. It is also possible to truncate the corners of sharp Ag nanocubes through an aging process in a dilute solution of hydrochloric acid in ethylene glycol (EG) [49].
Figure 2.
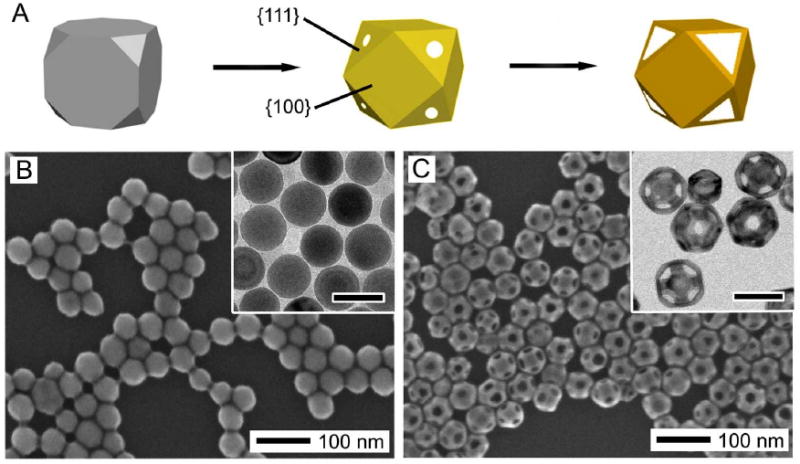
(A) Schematic showing the morphological changes during the different stages of the galvanic replacement reaction with a truncated Ag nanocube (or cuboctahedron). Pores formed selectively on the {111} facets instead of the {100} facets. Reproduced with permission from [20], Copyright 2008 American Chemical Society. (B) SEM (with TEM inset) of truncated Ag nanocubes. (C) SEM (with TEM inset) of Au nanocages synthesized from the Ag nanocubes in (B). Due to the highly truncated nature, some cages are oriented with a [111] orientation instead of a [100] orientation, recognizable by the hexagonal cross section. Inset scale bars are 50 nm for both images.
After the galvanic replacement reaction (Figure 2B), the pores in the wall were found at all eight corners and were uniform in size and shape, ideal for drug delivery applications which will be described in Section 6.1.2. Due to the highly truncated nature, some of the nanocages were oriented perpendicular to the [111] direction instead of the [100] direction, and appear with a hexagonal cross-section. The facet selectivity is consistent with our observations of preferential binding of poly(vinyl pyrrolidone) (PVP) to {100} facets of Ag over {111} facets [50]. This preference has been exploited in a number of syntheses of {100} capped Ag nanostructures, including the starting material of Ag nanocubes [51-54]. Due to the lower binding strength in the {111} regions (or desorbing due to the low concentration of PVP in the reaction solution), it should be easier for the HAuCl4 to react in the corner regions.
2.3 Facet-Selective Deposition with Single-Crystal Ag Spheres
With both of the structures discussed so far, the overall morphology of the initial template was preserved throughout the reaction due to the formation of a thin shell of Au during the initial stages. However, if small, 24-nm Ag spheres were used as the template, the particles underwent a morphological transformation into octahedrons [55]. This process is depicted in Figure 3. Though approximated as a sphere, the initial Ag particles are more accurately described as cuboctahedrons, with a mix of {100} and {111} facets. As described above, the pitting of the galvanic replacement reaction occurred on the {111} facets, while the deposition of Au occurred on the {100} facets and the edges of the structure. Due to the small size of these particles, this uneven growth rate was significant enough to cause a transformation from a cuboctahedral shape to an octahedron-like structure. The transformation of cube and cuboctahedron into octahedron has been previously reported for Ag nanostructures, due to preferential overgrowth of Ag on the {100} facets [56, 57]. A similar shape transformation has also been reported for the galvanic replacement reaction between 11-nm Ag spheres and AuCl3 in o-dichlorobenzene with oleylamine as a surfactant [58].
Figure 3.
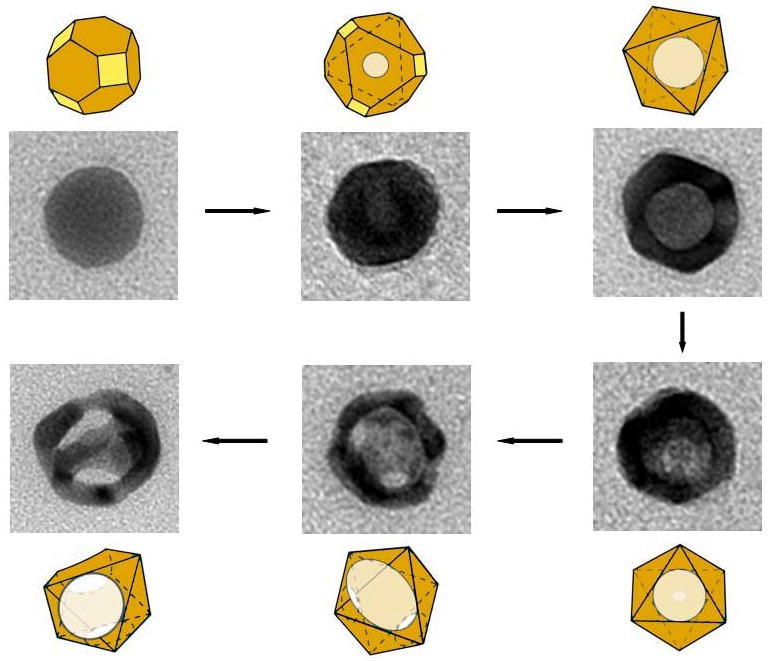
Schematics and TEM images showing the different stages of a galvanic replacement reaction between HAuCl4 and 24-nm Ag spheres. Yellow and orange colors indicate {110} and {111} facets, respectively. Reproduced with permission from [55], Copyright 2008 American Chemical Society.
The initial pitting in the reaction began on a {111} facet, which then expanded to create a hollow void in the center of the particle. As this occurred, Au was added to the {100} facets, resulting in an intermediate stage of a hollow octahedron. As the reaction progressed further, more pores began to develop due to dealloying, which coalesced into large openings on the surface of the nanocrystal. The final product was either a highly porous octahedron or a ring-like structure if many pores coalesced together. Interestingly, despite the small size, it was possible to tune the SPR wavelength of these nanostructures to 790 nm, within the NIR window ideal for biomedical applications, making it possible to study the effect of a wide range of sizes of Au nanocages with similar optical properties.
2.4 Polycrystalline Starting Materials
Though highly faceted nanostructures allow for more specific control of the porosity of the resulting materials, the galvanic replacement reaction is not limited to single-crystal substrates and can be used with a number of different types of materials. The simplest case is the reaction with roughly spherical Ag nanoparticles that can be synthesized using a number of different straightforward methods, making this reaction accessible to groups without extensive nanoparticle synthesis expertise and possible to perform with commercially available starting materials [59-62]. Despite the slightly non-uniform morphology, the interesting optical properties of these materials and compositional tunability are mostly preserved from the reaction with Ag nanocubes, though some broadening of the LSPR peaks is expected [59]. A detailed protocol for the galvanic replacement reaction can be found in ref. 23 for interested groups.
The different stages of the reaction between Ag nanoparticles and HAuCl4 are presented in Figure 4. The initial Ag nanoparticles were roughly spherical and some twin planes are visible as the suspension was a mixture of single crystals and twinned particles (Figure 4A). The morphological changes were very similar to those reported for Ag nanocubes above. As HAuCl4 was titrated into the suspension, Ag was dissolved from the interior and Ag and Au interdiffused, resulting in Au-Ag alloyed nanoshells (Figure 4C). As the reaction was continued further, the Ag was dealloyed from the walls, leaving behind a porous nanocage (Figure 4E). If an excess of HAuCl4 was introduced, the nanocages eventually fell apart, leaving behind irregular Au nanoparticles (Figure 4F).
Figure 4.
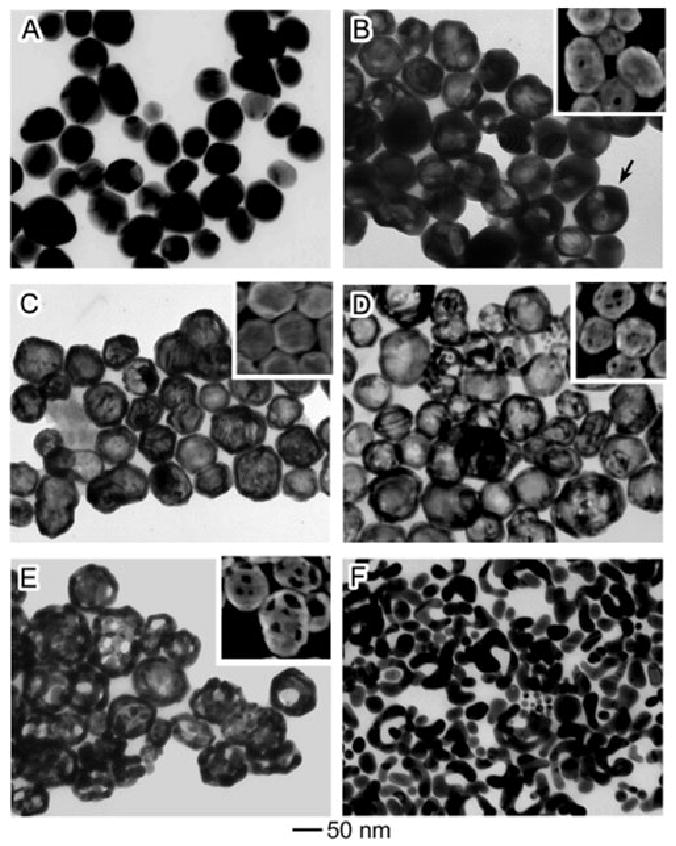
TEM images (SEM insets) of different stages of the reaction between polycrystalline Ag quasi-spheres and increasing amounts of HAuCl4. Reproduced with permission from [22], Copyright 2004 American Chemical Society.
2.5 Hollow Au-Ag Nanotubes
It is also possible to use this method to generate hollow nanotubes with diameters of ∼100 nm and lengths of several microns [22, 63]. Figure 5 shows the different stages of the reaction between Ag nanowires and HAuCl4. The wires used in this reaction had five twin-planes along the length of the wire together with a pentagonal cross section (see the inset of Figure 5A). The sides of the wires were capped with {100} facets protected with PVP, much like the sides of the Ag nanocubes presented in Figure 1. Due to the extended dimension of the nanowires, pitting began in a few different locations along the length of the wire. The gradual hollowing out of the wire was initiated from these pits and can be seen in Figure 5B. Once the non-alloyed Ag was removed, the product was a thin, continuous sheath or nanotube (Figure 5C). As with previously described structures, further addition of HAuCl4 at this stage resulted in pore formation (Figure 5E). Notably, despite the large size of the initial template, in the final stage Au nanoparticles of small sizes were also generated, as seen with the Au nanocages in previously discussed morphologies.
Figure 5.
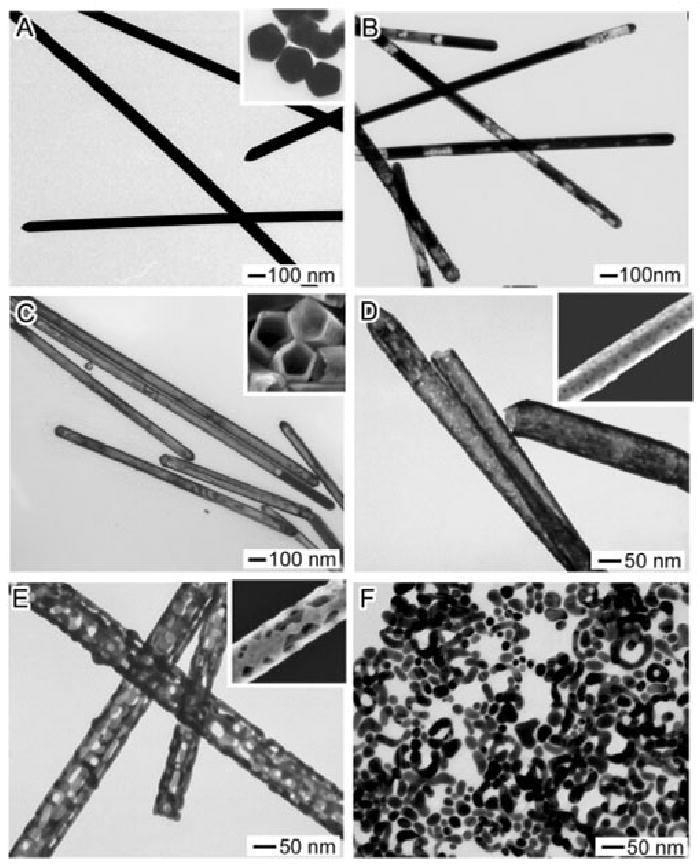
TEM images of different stages of the reaction between 5-fold twinned Ag nanowires and increasing amounts of HAuCl4. Insets: (A) TEM showing the pentagonal cross section of the wires, (C-E) SEM images of the respective products. Reproduced with permission from [22], Copyright 2004 American Chemical Society.
2.6 Multi-Walled Structures
It is also possible to use the galvanic replacement reaction to create structures with multiple walls [64]. Three such structures are depicted in Figure 6: nanorattles, multi-walled nanoshells, and multi-walled nanotubes. Nanorattles are hollow shells containing a movable solid core. To synthesize these structures, a thin layer of pure Ag was coated on the surface of a Au-Ag alloyed particle via electroless plating. When the galvanic replacement was performed, the pure Ag was oxidized, resulting in a Au-Ag shell around the Au-Ag solid core, separated by a thin gap. The size of the spacing between the core and the shell could be adjusted by changing the amount of Ag being plated. Interestingly, TEM results suggested that many of the cores were free to move around the interior of the particle. Few of the particles shown in Figure 6D had the core in the center of the particle. When TEM grids were dried at a tilting angle of 70° relative to the horizontal, 40% of the cores were located on one side of the particle while 21% were on the opposite side. Without tilting, there was almost no difference between the two (30% vs 27%). These observations suggest that gravity had an influence on the final location of the cores during the drying process.
Figure 6.
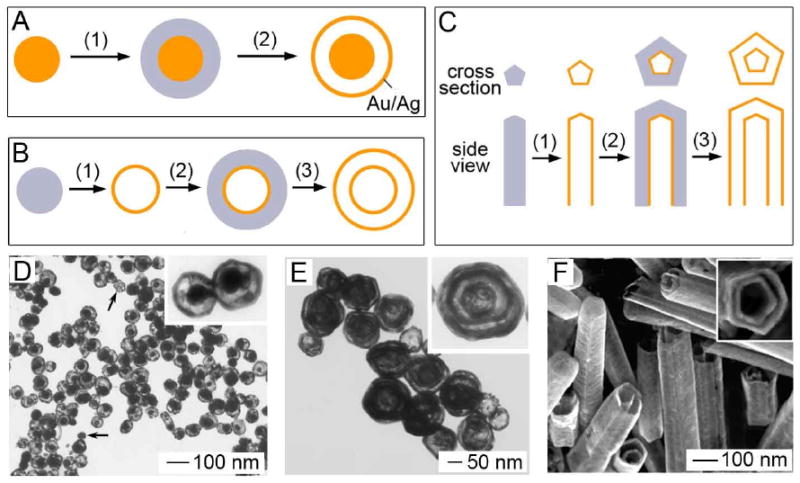
Schematics illustrating procedure for fabricating (A) nanorattles, (B) multi-walled nanoshells (i.e., Matrioshka), and (C) multi-walled nanotubes composed of Au/Ag alloys. (D) TEM images of nanorattles that were prepared by reacting HAuCl4 solution with Ag-coated Au/Ag colloids. (E) TEM image of multiple-walled nanoshells of Au/Ag alloy. Reproduced with permission from [64], Copyright 2004 American Chemical Society. (F) SEM image of double-walled nanotubes of Au/Ag alloy. Reproduced with permission from [130], Copyright 2004 Wiley-VCH.
This general strategy can also be used to prepare structures with more than two walls. Figure 6E shows a three-walled nanoshell created by alternating between galvanic replacement with HAuCl4 and electroless plating of Ag. These structures can also be referred to as nano-Matrioshka and are interesting to study for their optical properties due to interactions between the different shells. Finally, this technique can also be applied to Ag nanowires to create multi-walled nanotubes (Figure 6F). When subjected to strong sonication, some of these tubes broke into pieces, allowing the pentagonal cross section of both layers to be seen, which was preserved from the original Ag wires (inset of Figure 6F).
2.7 Hollow Au-Ag Octahedrons Containing Gold Nanorods
Additional growth on the surface of faceted nanocrystals does not always lead to uniform coatings, especially when the thickness of the deposited metal extends beyond a few nm. The relative surface energies (γ) of the common facets of an fcc metal are typically described by γ{110} > γ{100} > γ{111} [65]. As a result, these facets will have different reactivity, which can lead to uneven growth rates and a complete change to the morphology. A number of groups have taken advantage of these differences to generate both new geometries of a single metal [56, 57] or a variety of bimetallic structures with carefully control of overgrowth reactions [4, 66,67].
It is possible to combine this versatile technique with galvanic replacement to generate increasingly complex structures [68]. Figure 7 shows one such example, in which the hollow Au-Ag octahedron contained a Au nanorod in the interior. The initial Au nanorods were capped by a mixture of {100} and {110} facets and are shown in Figure 7B. After Ag deposition, most of the particles transformed into Au@Ag octahedrons capped by {111} facets, with a few other geometries such as decahedrons also present. A TEM image of the product at this stage is shown in Figure 7C and an SEM image is shown in Figure 7D. When this core-shell particle was titrated with HAuCl4, the octahedral geometry was maintained, resulting in a hollow Au-Ag octahedron containing a Au nanorod (Figure 7E). As with a number of the reactions discussed so far (e.g., nanocages and multi-walled structures), this reaction can also be performed with Pd and Pt, allowing for a combination of the interesting optical properties generated with galvanic replacement and the catalytic properties of these valuable metals [38, 64, 69]. The details of the differences in the reaction with these two metals will be described in more detail in Section 3.
Figure 7.
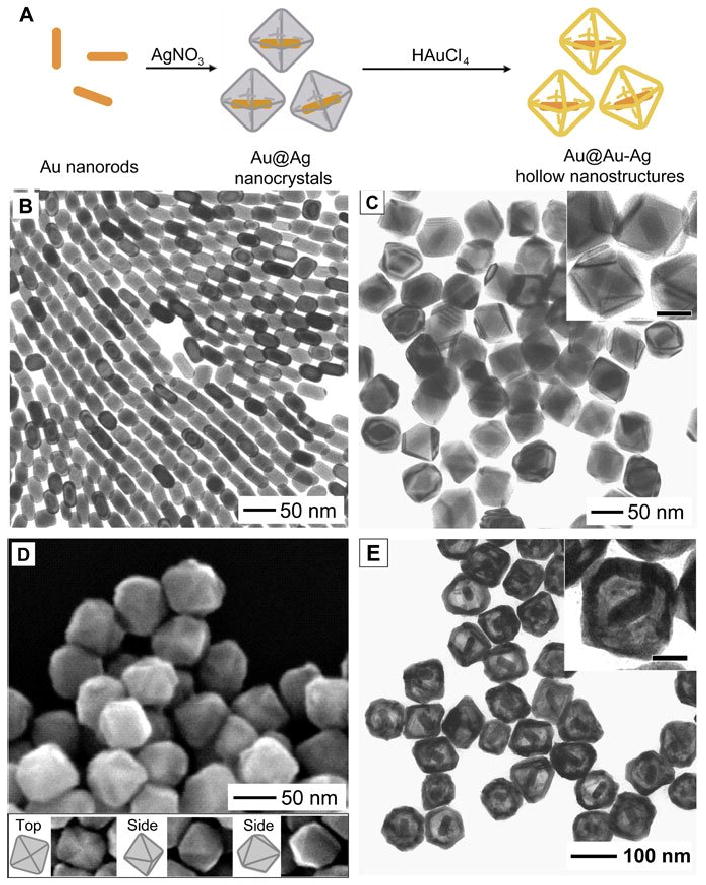
Schematic (A) and different stages (B-E) of the synthesis of Au-Ag octahedral containing Au nanorods: (B) TEM of Au nanorods, (C) TEM of Au@Ag nanocrystals, (D) SEM of Au@Ag nanocrystals, (E) TEM of Au@Ag nanocrystals after the galvanic replacement reaction. Inset scale bars are 30 nm. Reproduced with permission from [68], Copyright 2009 Wiley-VCH.
2.8 Galvanic Replacement with Small Multiply-Twinned Particles in Organic Media
Studying the galvanic replacement reaction between HAuCl4 and small multiply-twinned Ag particles (MTPs) in chloroform has provided a number of insights into this versatile technique [70]. In addition to the increased variety of surface coatings available, metal nanocrystals suspended in organic media may be more desirable for catalytic applications and creating optical coatings with spray deposition [71, 72].
The 11- and 14-nm MTPs used in the study were a mixture of decahedrons and icosahedrons. In the ideal case, these structures would be capped entirely by {111} facets, but slight truncation suggests that some {100} and (110} facets were present as well. Unlike the reaction with the larger, mostly single-crystal structures described above, a complete shell of Au was not formed during the replacement reaction. Instead, after the initial pitting, the particles were transformed immediately into either nanorings or nanocages. A mixture of these two morphologies was seen for both the 11- and 14-nm particles, though the relatively percentage of nanorings was higher with the 11-nm particles. TEM images and the proposed mechanisms for the reactions with icosahedrons and decahedrons are shown in Figure 8. From the locations of initial pores, it appears that pitting was initiated on the {111} facets, not the many grain boundaries and defects present in these multiply twinned structures. Though it has been demonstrated that replacement reactions should start from high-energy defect sites [45], studies of Ag catalysts have also shown that significant amounts of oxygen species can be dissolved on grain boundary defects and the adjacent defect planes [73-76]. Millar and co-workers suggested that the Ag in these regions would consequently be oxidized and develop a positive charge, forming a barrier to replacement reaction in these regions [73]. However, the high number of vacancies and boundary defects in these multiply twinned structures likely promote rapid alloy formation, which could contribute to the ring-like structures observed in this system (in comparison with the hollow shells observed in other systems) [70, 77].
Figure 8.
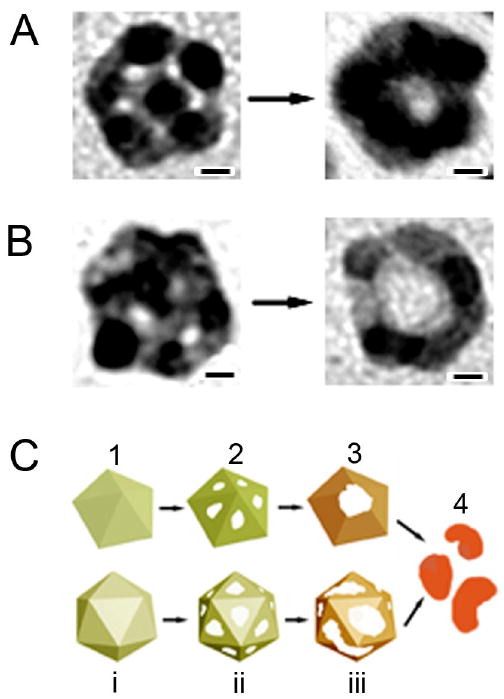
Morphological evolution for Ag MTPs with (A) decahedral and (B) icosahedral structures during the galvanic replacement reaction. (C) Proposed mechanisms to account for the formation of hollow structures from oleylamine-capped Ag MTPs. Scale bars in (A) and (B) are 2 nm. Reproduced with permission from [70], Copyright 2007 American Chemical Society.
The rapid evolution into nanocages and nanorings is also likely influenced by the small sizes of the template particles [70, 77]. Studies of 10-nm Cu and Au nanostructures found that alloying of these two metals occurred in less than 30 s [78]. Studies of the galvanic replacement reaction with triangular Ag plates have also shown that dimensions of greater than 20 nm were required for complete shell formation, in plates thinner than this a triangular nanoring was formed instead [79]. Interestingly, despite the very small final size of ∼15 nm (for the 14-nm Ag MTPs), it was possible to tune the LSPR wavelength to 740 nm, a region desirable for biomedical applications before the particle collapsed into irregular solid particles with an LSPR peak around ∼520 nm.
Studying this reaction in chloroform also provided useful insights about the effect of organic-phase capping ligands. The best results were obtained when the particles were conjugated with oleylamine (described above). If this ligand was replaced with oleic acid or tri-n-octylphosphine oxide (TOPO), the replacement reaction did not occur. The final product was a non-uniform mixture of particles with less than 5% having a hollow structure. This difference was attributed to the stronger binding of these two ligands. Excess oleylamine added to the solution also played an important role. These molecules helped solubilize the AgCl that forms during the reaction through the formation of a AgCl(R-NH2)n complex. Without an excess amount of oleylamine in the reaction system, large AgCl clumps formed, disrupting the template-based reaction.
2.9 Synthesis of Tadpole-like Structures from Pd Nanorods
So far, all the galvanic replacement reactions discussed have resulted in hollow structures. While this is the case for the majority of reactions, when Pd nanorods were reacted with HAuCl4, the final morphology was a solid tadpole-like structure with a Pd tail and an Au head [80]. As this unusual localized deposition of Au was not observed when the same reaction was performed with Pd nanoparticles; the rod shape of the initial template is thought to be a key part of the mechanism. This attribution is further supported by the reports of other groups who observed a tadpole-like morphology when reacting Co nanorods with Au precursors [81]. The small size of the Pd nanorods may also plays a role, as this system behaves very differently than the larger Ag wires in Section 2.5.
The initial Pd nanorods were capped by both {100} and {111} facets, and had dimensions of 4.0 ± 0.3 nm in width and of 17.4 ± 2.4 nm in length. A schematic of the reaction is shown in Figure 9 and a TEM image of the initial Pd rods is shown in Figure 10A. As HAuCl4 was gradually titrated into the suspension, Pd was dissolved from the entire surface of the rod and Au began to deposit at either end of the nanorod (Figure 10B). The selective deposition can be attributed to electron-electron repulsion forcing the electrons generated during Pd oxidation to be pushed to either end of the rod, where Au3+ ions were reduced.
Figure 9.
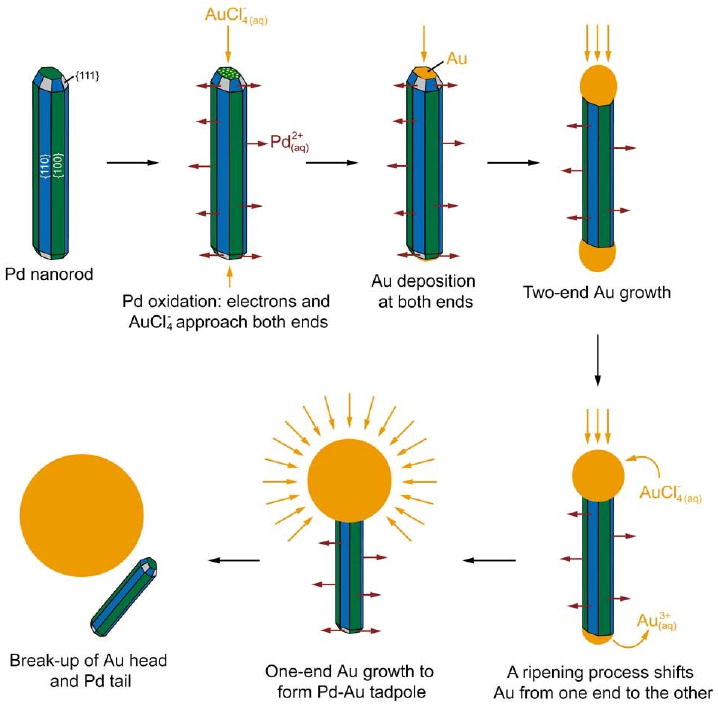
Schematic illustrating the different stages of a galvanic replacement reaction between a Pd nanorod and HAuCl4. Reproduced with permission from [80], Copyright 2007 American Chemical Society.
Figure 10.
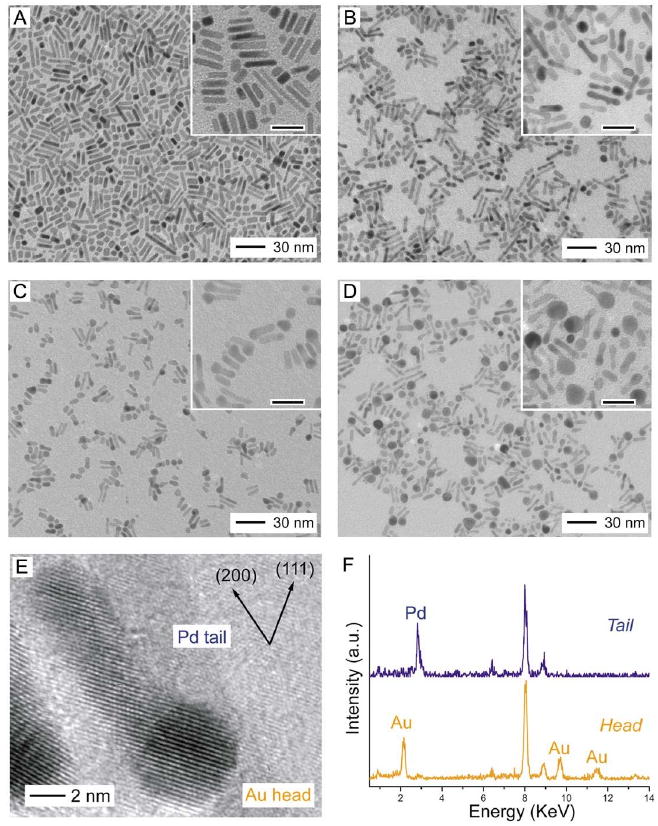
TEM images of (A) Pd nanorods and (B-D) samples that were obtained by titrating Pd nanorods with increasing volumes of HAuCl4 solution. The scale bars in the insets correspond to 20 nm. (E) HRTEM image recorded along [110] for the Pd-Au tadpoles shown in (C). (F) The EDS spectra for the Pd tail and the Au head. Reproduced with permission from [80], Copyright 2007 American Chemical Society.
As the reaction continued, the appearance of Au at the tips switched from occurring on both ends to occurring on one end selectively (Figure 10C). This change can be attributed to Ostwald ripening, which would be enhanced by the conductivity of the rod. The Au heads continued to increase in size and eventually started to fall off the Pd tails (Figure 10D). At this point in the reaction, the dimensions of the Pd tails were reduced in all dimensions (to 2.9 ± 0.4 nm in width and 11.6 ± 2.5 nm in length), suggesting that Pd was dissolved from all faces of the nanorod.
High-resolution TEM (HRTEM) analysis shown in Figure 10E confirmed that the Au grew epitaxially on the surface of the Pd rod, due to the small lattice mismatch between the two metals (4%). Scanning TEM (STEM) and energy-dispersive spectroscopy (EDS) were also employed to analyze the composition of the head and the tail, shown in Figure 10F. The tail contained less than 10% Au, while the head contained more than 90% Au. The small amount of Au in the tail was likely in the form of a protective layer on the surface of the nanorod, as the Pd rod was not completely consumed even when an excess of HAuCl4 was added.
Later studies by Teng et al. with polycrystalline Pd nanowires of similar size also found a degree of spherical particle formation at the tips during the reaction with HAuCl4 [82]. Unlike the result with the single-crystal nanorods reported here, the final product consisted of a non-random alloy with an Au rich core and a Pd rich shell. This distribution of atoms was attributed to the higher rate of interdiffusion caused by a high concentration of defect sites/vacancies and the stronger binding of the alkylamine surfactant to Pd [82], demonstrating the importance of both surfactant choice and defect sites in controlling the galvanic replacement reaction.
3. Alloying and Dealloying Effects
To explain and control the final morphology and properties of the resulting structures, it is critical to understand the alloying and dealloying processes involved in the galvanic replacement reaction. As ions of one metal are reduced and deposited onto the substrate of a different metal in the early stages of the reaction, interdiffusion across the interface leads to alloy formation. This process is described by Fick's second law of diffusion, and the relevant solution is:
| (4) |
where D is the interdiffusion coefficient and C is the atomic fraction of the deposited metal as a function of the distance from the interface (x) and time (t). The interdiffusion coefficient (D) depends strongly on temperature, and elevated temperatures increase the rate of diffusion [83]. According to calculations based on Equation 4, at 100 °C (the typical temperature for the reactions presented herein), Ag diffusing into Au can create an alloy layer with up to 10% Ag after only 20 s [21]. Small particle sizes and the presence of defects and twin planes can also enhance the interdiffusion rate, as has been demonstrated in a number of systems [70, 77, 78, 82]. For example, studies of the rate of alloying of Au@Ag core-shell particles of different sizes have shown enhanced rates of interdiffusion for particles with cores smaller than ∼5 nm with varying thicknesses of Ag shells (at room temperature) [77]. This increased value of D was attributed to a greater number of vacancies through theoretical calculations [77]. As the walls of Au-Ag nanoboxes (and related structures) are <10 nm thick, the size dependence of alloying likely contributes to rapid alloy formation in most of the structures described above as well.
Alternately, dealloying interactions play a key role in the final stages of the reaction, when the component with the lower electrochemical potential is selectively removed from the alloyed walls. At this stage a large number of vacancies are generated, which coalesce into pores in the walls of the nanostructures. The dealloying process has been studied and reported in a number of publications, often for the removal of the less electrochemically active species with a separate etchant, such as nitric acid [42, 43, 84-90]. In this section we will describe a few different ways that alloying and dealloying processes can effect the final morphology: post-reaction wet etching with Fe(NO3)3, using Pd and Pt precursors, and adjusting the order of addition in multi-metal titrations.
3.1 Selective Dealloying with Ferric Nitrate
During a typical galvanic replacement reaction, the etching of Ag and the deposition of Au are tightly linked – one cannot occur without the other. However, by introducing a wet etchant such as ferric nitrate, it is possible to remove Ag without additional deposition of Au [84, 85, 91]. This allows for even greater control of the wall thickness, composition, and the resulting optical properties of the alloyed nanostructures. By generating extremely thin walls, it is also possible to shift the LSPR peak of the nanocages to 1200 nm or longer while still maintaining a compact size of ∼50 nm [91].
A schematic and TEM images (with SEM in the insets) of the product at different stages are presented in Figure 11. The initial Ag cubes with an edge length of 50 nm are shown in Figure 11A. In the first step, a small amount of HAuCl4 was titrated into the suspension to create a thin Au layer on the surface (Figure 11B). Next, as a small amount of Fe(NO3)3 solution was added into a suspension of these early stage nanoboxes, the Ag remaining in the interior was dissolved, producing a thin-walled nanobox (Figure 11C). The walls of the nanobox at this stage were highly porous due to the large number of vacancies generated as the Ag was removed from the alloyed walls.
Figure 11.
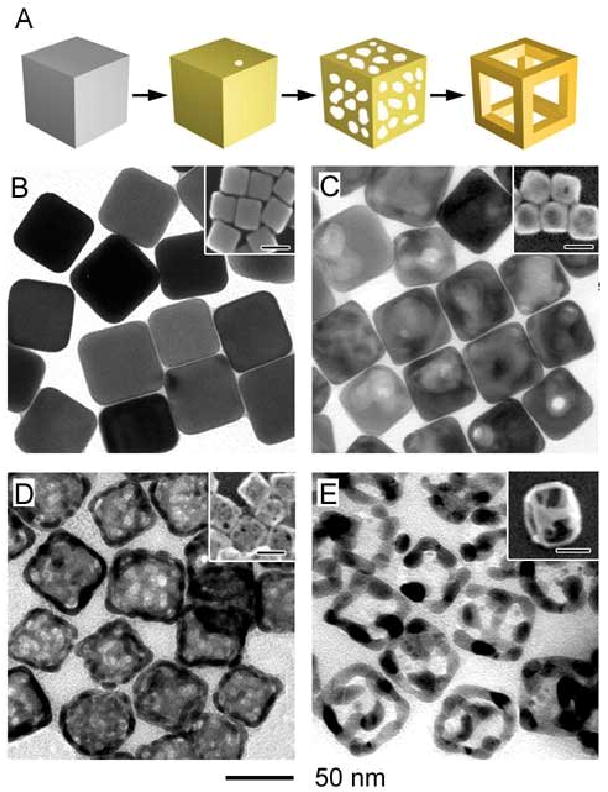
(A) Schematic summarizing the synthesis of cubic Au nanoframes by first titrating Ag nanocubes (B) with HAuCl4 to form Au-Ag nanoboxes (C), and then etching with ferric nitrate to form thin-walled nanoboxes (D) and cubic nanoframes (E). Inset scale bars are 50 nm. Reproduced with permission from [90], Copyright 2007 American Chemical Society.
As increasing amounts of Fe(NO3)3 were added, the morphology changed from a thin-walled nanobox to a nanoframe (Figure 11D). The inset of Figure 11D shows a 45° tilted SEM image, making the frame morphology more clear. This transition can be attributed to {100} facets being more susceptible to etching. As the Ag atoms on the faces are removed, the Au atoms can diffuse along the surface to the edges. This migration could be seen as increase in wall thickness when measured by TEM, despite the clear appearance of thinning and eventually empty side faces under SEM. At the final stage, the structure was 100% Au as all the Ag had been removed.
3.2 Galvanic Replacement with Pd and Pt Precursors
The importance of alloying and dealloying for Au and Ag to the morphology and properties of resultant nanocages becomes increasingly clear when this system is compared with the same reaction performed with Na2PdCl4 and Na2PtCl4 [69]. The electrochemical potentials for these species are listed in Table 1. Figure 12A shows the result of titrating 50-nm Ag nanocubes with Na2PtCl4. The replacement reaction occurred and a hollow structure was generated at the later stages of the reaction, but the surface was covered in bumps due to the lack of miscibility between Pt and Ag at the reaction temperature (100 °C). When Na2PdCl4 was used instead, the surface was smooth, but it was impossible to continue the reaction beyond the nanobox stage – pores never formed on the sides or at corners (Figure 12B) [69]. The early stopping of the reaction indicates that the Na2PdCl4 is unable to dealloy the Pd-Ag walls that formed in the early stage of the reaction. It has been noted in theoretical studies that Au and Pd can be stabilized when alloyed into an Ag matrix (and vice versa), and will consequently require higher potentials to be removed from the alloy than would be required to be oxidized as a pure metal [42, 43]. Given the small magnitude of the difference between the Pd and Ag potentials, the ability of Na2PdCl4 to oxidize the pure Ag in the core but not dealloy Ag in the Pd-Ag alloy walls can reasonably be attributed to this type of stabilization. In both these systems, the range of LSPR tuning was also limited as compared to titrations of Ag cubes of the same size with HAuCl4. The Pt nanocages could be tuned to 670 nm (at which point they fell apart due to the polycrystalline walls) and the Pd nanocages could be tuned to 730 nm (when dealloying would typically begin), while Au nanocages of the same size can be tuned to 900 nm and beyond.
Figure 12.
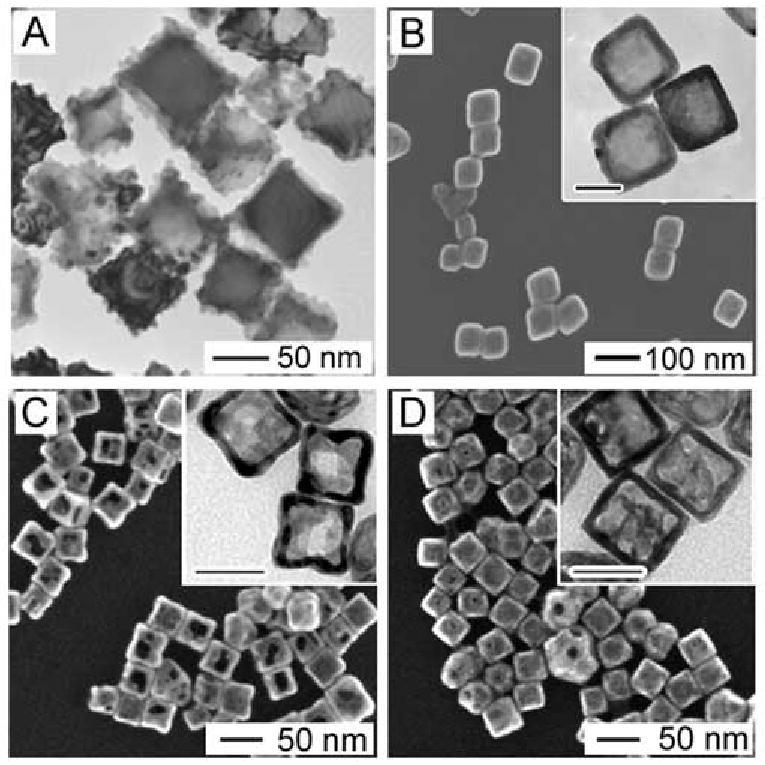
(A) TEM of Pt/Ag nanoboxes from the galvanic replacement reaction between Ag nanocubes and Na2PtCl4 solution. (B) SEM and TEM (inset) of Pd/Ag nanoboxes from the galvanic replacement reaction between Ag nanocubes and Na2PdCl4 solution. (C, D) SEM and TEM (inset) of Ag/Au/Pd nanocages from the galvanic replacement reaction between Ag nanocubes and (C) Na2PdCl4 solution, followed by HAuCl4 solution, and (D) HAuCl4 solution, followed by Na2PdCl4 solution. Inset scale bars are 40 nm. Reproduced with permission from [38], Copyright 2008 Wiley-VCH.
3.3 Effect of Order of Addition
When successive titrations with Au and Pd were performed in order to create nanocages incorporating more than two metals, the order of addition played a critical role in determining the final properties due to the differing dealloying abilities of the two precursors [38]. If Pd was titrated before Au, large pores developed, whereas if Au was titrated before Pd the final product had solid walls, shown in Figure 12, C and D, respectively. The results from these titrations are summarized in a schematic in Figure 13. The effect of order of addition can be explained with a mechanism similar to that discussed for the Pd-Ag system above. The Au3+/Au pair has a much higher electrochemical potential than the Pd2+/Pd pair, and consequently even if small increases in the dissolution potential occur due to alloying, Ag can still be removed through reaction with HAuCl4. On the other hand, Pd is unable to remove Ag due to its weaker dealloying ability. The difference between the two systems also appeared in the composition and optical properties of the resulting materials. When Pd was titrated first, the final product had a higher Pd loading and a further red-shifted LSPR peak.
Figure 13.
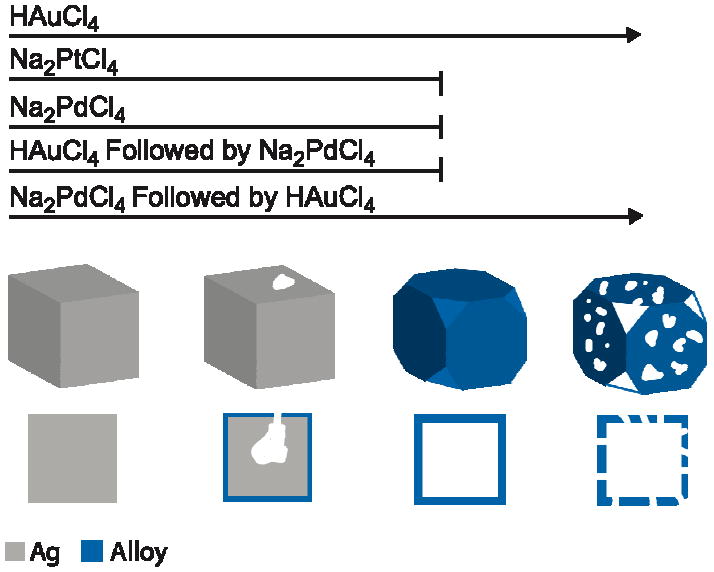
Schematic illustration of the morphological changes for Ag nanocubes during the refluxing with Na2PdCl4, NaPt2Cl4, and HAuCl4. When only Na2PdCl4 or Na2PtCl4 was added, a hollow nanobox was produced (though with a roughened surface for the Na2PtCl4). When only HAuCl4 was added, the reaction could continue further by dealloying the nanobox to produce a nanocage. If more than one precursor was added, the order of addition had a strong effect. For example, if HAuCl4 was added before Na2PdCl4, the morphology changes stopped at the box stage unless enough HAuCl4 was added to introduce pores before adding Na2PdCl4. If Na2PdCl4 was added before HAuCl4, the nanobox continued dealloying to form a nanocage as the final product. Reproduced with permission from [38], Copyright 2008 Wiley-VCH.
4. Precursor Effects: The Case of Au(I)
We have also investigated the reaction between AuCl2- and Ag nanocubes to examine the effect that stoichiometric ratio plays in controlling the galvanic replacement. A schematic and SEM and TEM images of the progression of this reaction are shown in Figure 14 [92, 93]. Due to the different oxidation states of Au, only one Ag atom is removed for every Au atom that is generated, resulting in striking differences in the final morphology.
Figure 14.
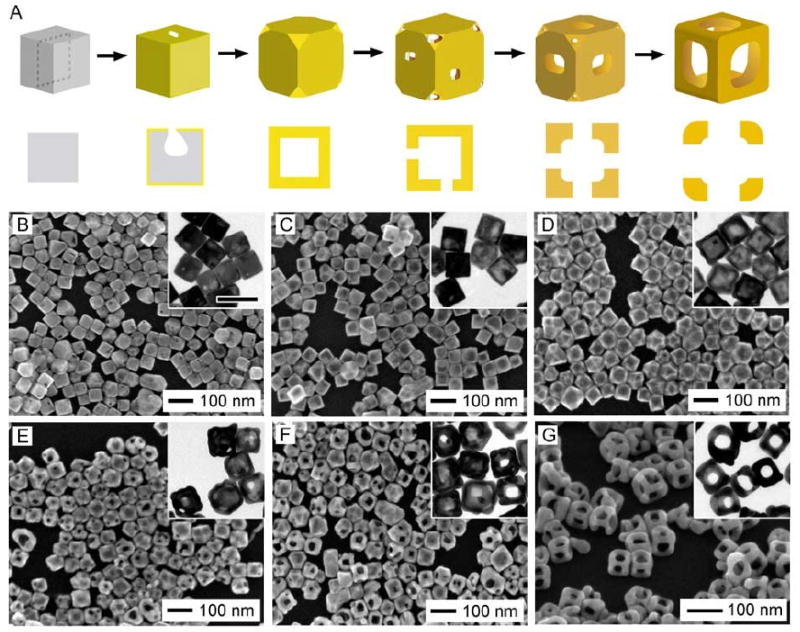
(A) Schematic diagram and (B-G) SEM images with TEM insets showing different stages of the galvanic replacement reaction between Ag nanocubes and different volumes of AuCl2-. The scale bar below the images applies to all SEM images. The scale bar in the inset of (B) represents 100 nm and applies to all TEM insets. Reproduced with permission from [93], Copyright 2008 Wiley-VCH.
This reaction was performed in a saturated NaCl solution to solubilize the precursor, AuCl, though this had the added advantage of also solubilizing the AgCl byproduct as AgCl2-. In the early stages of the reaction, the primary difference between the Au(I) and the Au(III) systems was the early disappearance of the pinhole, due to the larger amount of Au generated for the same amount of Ag being dissolved (Figure 1C). This means that the remaining Ag must diffuse through the walls of the nanobox in order to be oxidized. Difference in rates of diffusion between two metals at an interface has been shown previously to form voids in a process known as the Kirkendall effect [94]. If the inner material diffuses out faster than the outer material diffuses inward, voids will form and coalesce into a pore. This effect has been shown to produce hollow nanostructures in a number of systems [95-99]. Though it is possible this effect plays somewhat of a role in the late stages of the Au(I) reaction due to the early closing of the pinhole, the selective dissolution of the interior of the template during the early stages appears to be the primary mechanism for the formation hollow interiors in both the Au(I) and Au(III) systems. Instead of the consolidation of a number of small voids or the initial formation of a hollow layer in between the core and shell of a particle typically cited with the Kirkendall effect, a single void is observed to expand from one side of the cube to the other [92, 96, 99, 100] (see the TEM insets in Figure 1D or Figure 14C).
One of the notable features of the reaction with Au(I) is the thicker walls of the nanocages when compared to the Au(III) system, as shown in the schematic in Figure 14A. In the later stages of the reaction, these thicker walls helped support the formation of robust nanoframes, with greater mechanical stability than those reported from ferric nitrate etching. The evolution of the nanoframe morphology can be seen in Figure 14, E-G. In the first step, small pores formed on both the side and corner faces of the nanocage (Figure 14E). As more AuCl2- was added, the pores on the sides were enlarged and the pores on the corners began to close (Figure 14F); this process would continue until large pores dominated the side of each nanostructure, creating a nanoframe (Figure 14G). Small, extended regions were visible at the corner of each nanoframe, suggesting that the pores at the corner closed due to movement of Au atoms to the more stable {111} facet or possibly overgrowth of this facet due to the larger amount of Au being generated, as has been observed in the Pt system [101].
Based on these observations, it is clear that different precursors are ideal for different applications. When tuning the LSPR peak into the NIR region, the Au(III) precursor is ideal as thin walls are necessary for absorption in this region. For single particle studies of the effect of morphology on optical properties, Au(I) is preferable as it generates robust frames.
5. Optical Properties: Localized Surface Plasmon Resonance
One of the most useful features of nanostructures synthesized with a galvanic replacement reaction is the highly tunable optical properties that result from the tunable shift in the ratio between the inner and outer particle diameters (i.e., the wall thickness) [24]. The origin of these properties is a phenomenon known as LSPR [102, 103]. When a metal is irradiated with light, the delocalized electrons collectively oscillate relative to the lattice of positive nuclei. This coherent oscillation is known as a plasmon, a quantized quasi-particle analogous to a photon. For bulk metals extending infinitely in all three dimensions, the plasma frequency (ωp) is described by:
where N is the number density of conduction electrons, ε0 is the dielectric constant of a vacuum, e is the charge of an electron and me is effective mass of an electron. When this plasmon couples with a photon, it creates a new quasi-particle known as a plasmon polariton, which can propagate along a metal-dielectric interface. The plasmons on the surface are the most relevant, as light cannot penetrate very deep into a metal surface (<50 nm for Ag and Au). This interaction has been exploited to create waveguiding structures with metallic nanowires [5, 7]. However, for the primarily “0D” nanoparticles discussed herein, the plasma oscillation will be highly localized and non-propagating due to the small dimensions of the particle relative to the electromagnetic field. The resulting phenomenon is known as “localized surface plasmon resonance” or LSPR, where resonance refers to the fact that the strongest plasmons occur when the plasma frequency is close to that of the incident light, creating a resonance condition due to constructive interference. A diagram for LSPR is shown in Figure 15 for a generic metal nanosphere.
Figure 15.
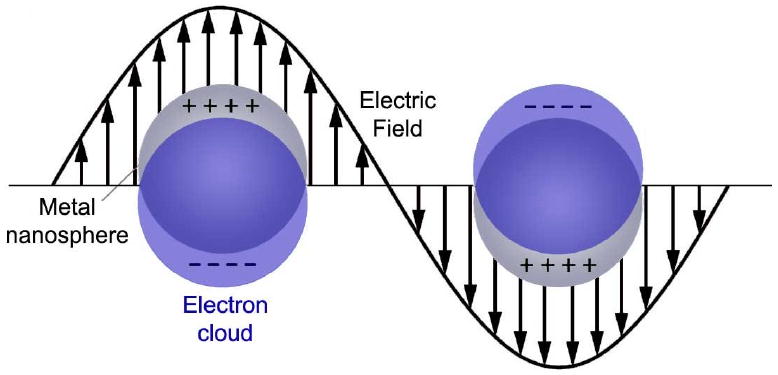
Schematic illustration of localized surface plasmon resonance (LSPR) showing the oscillation of delocalized electrons in the presence of an electromagnetic wave.
Incoming light at the LSPR wavelength can interact with the nanoparticle through two different processes: absorption and scattering. Absorbed light is converted into phonons, or heat, and is desirable for photothermal applications, whereas scattered light is re-radiated at the same wavelength, useful for some imaging applications [16]. The relative contributions of these two processes can be determined using theoretical calculations. For spheres, this can be calculated using exact solutions to Maxwell's equations, as demonstrated by Mie in 1908 [104]. For more complex particles, the method of choice is typically the discrete dipole approximation (DDA), which approximates structures as an array of dipoles that interact with both the incoming light and each other [105]. As a rough approximation, for small structures (e.g., <50 nm) the absorption cross section will be larger than the scattering cross section, while for larger structures (e.g., >100 nm), the inverse will be true.
The precise position of the LSPR peak depends on a number of factors, including the specific geometry of the nanoparticle and the local dielectric environment [102, 106]. Shape-controlled synthesis of metal nanocrystals has proven to be a versatile route to tune the LSPR peak position across the visible spectrum and into the NIR region [19, 107-109]. For solid particles, the aspect ratio, overall size, and sharpness of the features are the major determining factors of peak position and near-field distributions [106-111]. For example, by simply truncating the corners of a nanocube, the wavelength will be blue-shifted by 50-150 nm depending on the size of the initial cube [110]. Despite these significant shifts, it is still non-trivial to red-shift the LSPR of solid nanoparticles into the NIR region. Though extensive work has been performed with Au nanorods, whose LSPR can be shifted into the NIR region through careful control of the aspect ratio, more versatile methods to create nanostructures with NIR resonances are desirable due to the great interest in structures with absorption in this region for biomedical applications [25, 26, 109, 112].
Galvanic replacement allows for straightforward tuning of the LSPR peak of nanostructures across the visible region and into the NIR due to the coupling between the surface plasmons of the inner and outer surfaces [16, 20, 21, 24, 113]. This interaction is analogous to the combining of two orbitals in molecular orbital theory, and generates a symmetric (“bonding”) plasmon and an anti-symmetric (“anti-bonding”) plasmon [113]. The symmetric plasmon with a lower energy interacts with the incident light, and determines the location of the LSPR peak. As the wall thickness of a nanostructure is decreased, the interaction between the two surface plasmons increases, resulting in increased splitting between the symmetric and anti-symmetric plasmons. This lowers the energy of the symmetric plasmon, resulting in a red-shift of the LSPR. Through this mechanism, very small changes in wall thickness can have a significant effect on the optical properties, allowing for facile tuning into the NIR region. Figure 16 shows the LSPR properties of 50-nm cubic Ag nanocubes after different amounts of HAuCl4 solution had been added. As the volume increased, the walls became thinner (due to the removal of Ag as described in Figure 1) and the peak red-shifted through the visible and into the NIR region.
Figure 16.
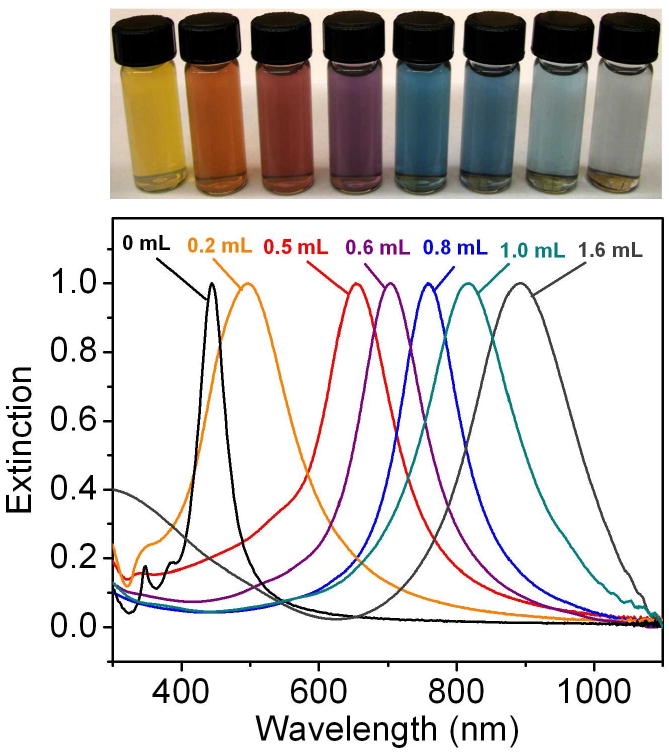
(Top panel) vials containing Au nanocages prepared by reacting 5 mL of a 0.2 nM Ag nanocube (edge length ∼40 nm) suspension with different volumes of a 0.1 mM HAuCl4 solution. (Lower panel) the corresponding UV-visible spectra of Ag nanocubes and Au nanocages. Reproduced with permission from [23], Copyright 2008 Nature Publishing Group.
6. Applications
6.1 Biomedical Applications
Many types of nanostructures are being investigated for biological applications due to the broad range of properties present in this interesting size regime [114, 115]. In addition to being able to engineer the intrinsic properties like optical absorption and magnetism, it is possible to engineer the interaction between the nanomaterials and their biological surroundings through control of the size and surface properties [114-119]. Particles in the right size regime have been shown to accumulate with higher concentrations in tumors than healthy tissue due to the enhanced permeability and retention (EPR) effect, also known as passive targeting. This effect can be enhanced by coating the surface of the nanostructure with polyethylene glycol (PEG), which retards recognition of the particles by the liver, extending the circulation time so more particles have time to accumulate at the tumor site [116-118]. Furthermore, if biologically recognized molecules or antibodies are attached to the surface of a nanostructure (e.g., through the gold-thiolate linkage), it is possible to bind selectively to over-expressed receptors on the surface of cancer cells, a process known as active targeting [114, 115, 119]. The combination of these two effects has made nanomaterials a promising platform for highly targeted therapeutics, hopefully replacing current techniques that affect the body broadly and which lead to harsh side effects.
Gold nanostructures are particularly interesting because of the high biocompatibility of the metal, the well-known gold-thiolate chemistry that allows for simple, straightforward surface modification, and the strong optical properties from LSPR [120]. Gold nanostructures with an LSPR peak in the NIR region, such as Au nanocages, are particularly desirable due to the low absorption from blood and water and low scattering from the tissue in this region [25, 26]. Gold nanocages also have the added advantages of a small size (e.g., 30-50 nm like those shown in Figure 2), high absorption cross section, and a hollow interior, making them ideal for applications such as photothermal treatment and drug delivery, which will be described below [20]. Gold nanocages are also promising contrast enhancers in optical imaging modalities; interested readers can find more information about such applications in refs. 15, 27, and 121.
6.1.1 Photothermal Transducers
Irradiation of gold nanocages with a NIR laser has been shown to cause strong heat generation, destroy cells in vitro, and cause a significant decrease in metabolic activity and increase in cellular damage in tumors after in vivo injection [122-124]. The amount of heat generated depends on three primary factors: the concentration of nanocages, the laser power, and the irradiation time [124]. The effects of these variables are listed in Table 2 and depicted graphically in Figure 17. Panel A shows the change in temperature with time for different concentrations of nanocages after irradiation with a continuous wave (CW) diode laser at 1 W/cm2. Panel B shows the same comparison, but with a laser power of 0.5 W/cm2. In both cases, only a small increase in temperature of 2-3 °C was seen with the control sample of water, whereas increases of 5-10 °C were seen with the lowest concentration of nanocages tested, 109 particles/mL. This temperature difference (ΔT) is enough to increase the temperature in an in vivo system from 37 °C to well over 42 °C, where denaturing of important biomolecules and cell death can begin to occur. With higher particle concentrations, such as 1012 particles/mL, the temperature increase was even more pronounced, with a plateau developing around a ΔT of 44 °C after 2.5 min for the more concentrated samples at 1.0 W/cm2. With a lower laser power of 0.5 W/cm2, the temperature change was more gradual, and did not plateau in the 10 min of data collection. Though gold nanostructures can melt and lose their morphology and optical properties after irradiation with a pulsed laser due to the intense bursts of power, with this diode laser system no such loss of properties occurred.
Table 2.
Temperature increase (ΔT) for aqueous suspension of Au nanocages upon irradiation by the diode laser for 10 min
| Power Density (W/cm2) |
Nanocage Concentration (Particles/mL) | |||
|---|---|---|---|---|
| 0 | 109 | 1010 | 1011 | |
| 1 | 3.5 °C | 10.2 °C | 34.9 °C | 43.9 °C |
| 0.5 | 2.3 °C | 6.1 °C | 23.7 °C | 34.5 °C |
Figure 17.
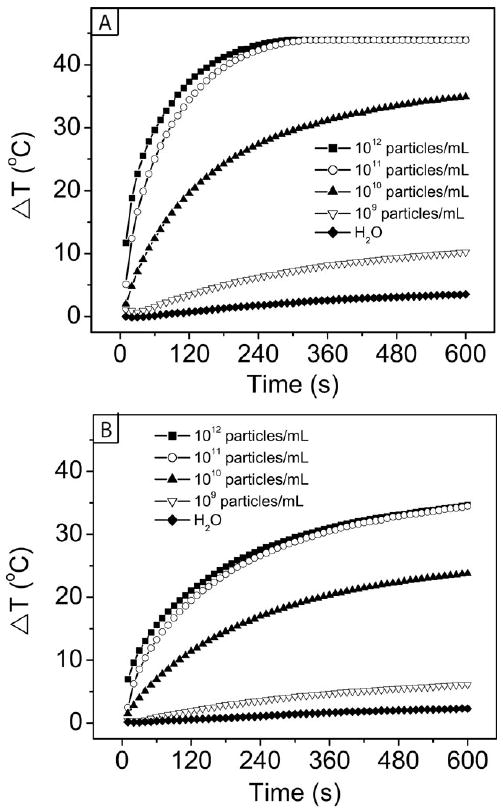
Plot of temperature increase with time from the photothermal effect with different concentrations of Au nanocages at two different laser powers: (A) 1.0 W/cm2 and (B) 0.5 W/cm2. Reproduced with permission from [124], Copyright 2010 Wiley-VCH.
6.1.2 Drug Delivery
Gold nanocages can also be used to deliver other types of therapeutic payloads. There is great interest in creating drug delivery methods with specific release profiles [114, 115, 125, 126]. By coating with a thermosensitive polymer, it is possible to open and close the pores on an Au nanocage in a controllable manner, allowing the interior to serve as a drug delivery vessel [127]. To allow for greater uniformity of the pore size, truncated nanocages like those shown in Figure 2 are typically used for these studies [47]. A schematic of the general process is shown in Figure 18A.
Figure 18.
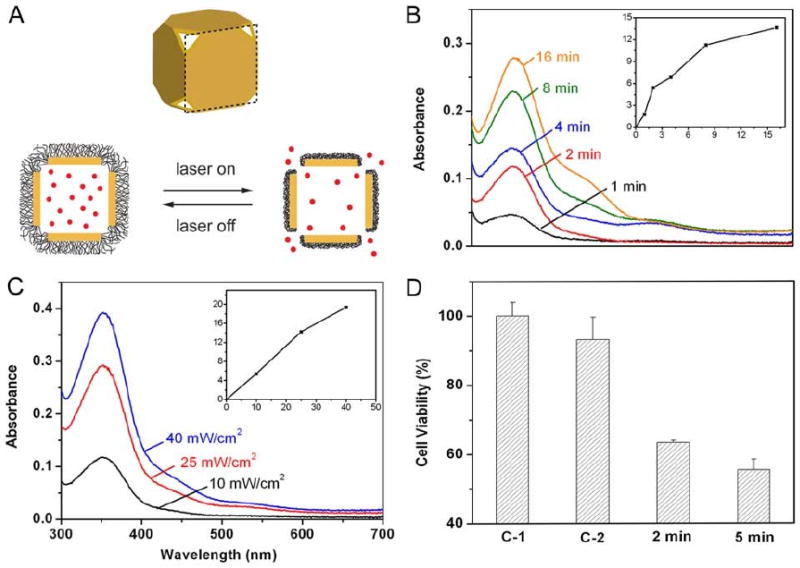
(A) Schematic showing the mechanism for drug release from Au nanocages coated with a smart polymer. When the polymer is heated above its LCST it collapses, exposing the pores and releasing the contents. (B-D) Controlled release from the Au nanocages covered by a smart polymer with an LCST at 39 °C (pNIPAAm-co-pAAm). (B) Absorption spectra of alizarin-PEG released from the copolymer-covered Au nanocages by exposure to a pulsed NIR laser at a power density of 10 mW cm−2 for 1, 2, 4, 8 and 16 min; and (C) by exposure to the near-infrared laser for 2 min at 10, 25 and 40 mW cm−2. The insets show the concentrations of alizarin-PEG released from the nanocages under different conditions. (D) Release of a chemotherapeutic drug (doxorubicin) from Au nanocages to breast cancer cells in vitro, showing significant cell death: (C-1) cells irradiated with a pulsed near-infrared laser (20 mW cm−2) for 2 min in the absence of Au nanocages; (C-2) cells irradiated with the laser for 2 min in the presence of Dox-free Au nanocages; and (2/5 min) cells irradiated with the laser for 2 and 5 min in the presence of Dox-loaded Au nanocages. Reproduced with permission from [127], Copyright 2009 Nature Publishing Group.
The PVP coating of as-synthesized gold nanocages was first exchanged with either poly(N-isopropylacrylamide) (pNIPAAm) or a related copolymer. A disulfide initiator was used in the polymerization in order to attach the polymer to the surface via the gold-thiolate linkage. This polymer has a sharp transition between an extended hydrophilic phase and a collapsed hydrophobic phase at a specific temperature, the low critical solution temperature (LCST) [128]. When the polymer is heated above that threshold, the collapsing of the polymer opens the pores and allows for release of the pre-loaded contents. This transition temperature can be engineered to a physiologically relevant value through the introduction of acrylamide (AAm) to generate pNIPAAm-co-pAAm copolymers. By adjusting the amount of AAm, the LCST can be tuned between 32 °C and 50 °C [127, 129]. The studies presented here used a copolymer with a LCST of 39 °C, which is above the body temperature of 37 °C, but below the onset of hyperthermia at 42 °C. Importantly, the temperature change needed to induce this transition can be generated via the photothermal effect, making it possible to initiate and control treatment from a distance. The studies shown in Figure 18 used a pulsed Ti:Sapphire NIR laser to generate the heat.
Initial studies were performed by loading a PEG-conjugated alizarin dye and monitoring the release profile with UV-vis spectroscopy (Figure 18, B and C). The amount of dye released depended on both the irradiation time and the laser power. At the highest laser power shown, 40 mW/cm2, the nanocages began to melt. At lower laser powers, the nanocages retained their morphology and could be re-used if desired, showing the polymer remained on the surface during the different stages of loading and release.
This technique could also be used to release small molecule drugs and biologically active enzymes. Figure 18D shows the reduction in breast cell viability after the release of the chemotherapeutic drug doxorubicin in vitro. Control samples with either laser irradiation in the absence of Au nanocages (C1) or laser irradiation of empty nanocages (C2) showed minimal cell death. A small reduction in viability in C2 may be due to mild photothermal effects, though the laser power in this experiment is low compared to typical photothermal treatments (20 mW/cm2 opposed to 1500 mW/cm2 for pulsed laser experiments)[121]. Conversely, when the drug-loaded nanocages were irradiated with the same laser power a significant decrease in cell viability was seen, reduced to ∼60%. Though this system is still being further optimized, it has great potential for both temporally and spatially specific delivery.
6.2 Catalytic Applications
Gold nanocages may also find use as catalysts for redox reactions. Though it has been shown by a number of groups that catalyst performance is enhanced as particle size is reduced, the oxidation and reduction half reactions in certain systems may need to occur on separate particles if the size is too small. These particles would then require electrical connection so the reaction can proceed. Gold nanocages could provide an alternative option as they have ultra thin, porous walls, but a large, electrically conductive surface area that could accommodate both half reactions easily.
To investigate this possibility more thoroughly, catalytic studies were performed for three different types of 50-nm Au-Ag alloyed nanostructures: hollow and porous nanocages; hollow nanoboxes; and partially hollow nanoboxes with significant amounts of Ag still present in the interior [39]. Data was also collected for 50-nm solid Au spheres and 5-nm Au spheres as a comparison. The concentration of Au nanostructures was held constant at 3.8 × 10⁹ particles/mL for all 50 nm structures but was increased to 1.56 × 10¹² for 5-nm particles to account for the significant difference in surface area. TEM images of these different morphologies are shown in Figure 19A.
Figure 19.
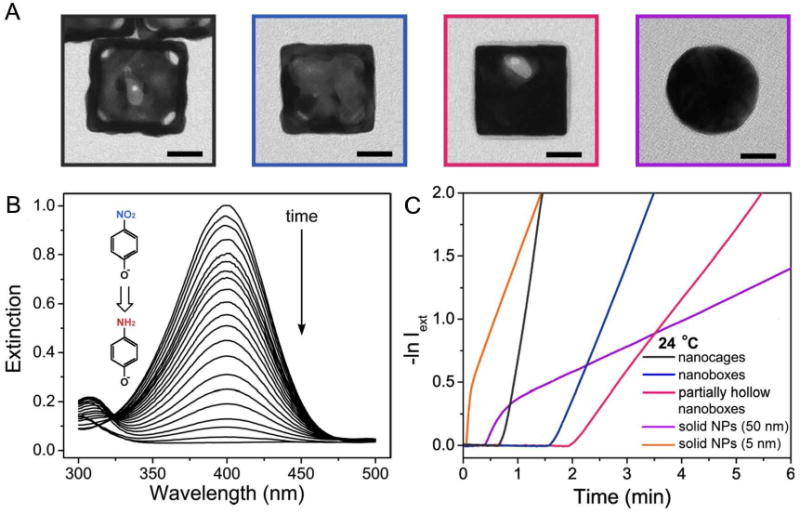
(A) Representative TEM images of the Au nanocages, nanoboxes, and nanoparticles used in the catalytic studies. (B) UV-vis spectra showing the disappearance of the 400 nm peak of p-nitrophenol due to the reduction of -NO2 group into -NH2 group. (C) Plots of −lnIext against time for Au-based nanocages, nanoboxes, and partially hollow nanoboxes. These plots were used to determine the reaction rate constant and activation energy. Reproduced with permission from [39], Copyright 2009 American Chemical Society.
The reaction studied was the reduction of p-nitrophenol by NaBH4 (more accurately p-nitrophenolate ions due to the alkalinity of the solution). A schematic of this reaction and the spectral changes used to monitor it are shown in Figure 19B. After the injection of an Au-based catalyst, the extinction peak from p-nitrophenolate ions at 400 nm gradually dropped in intensity. Figure 19C shows the resulting graphs of intensity versus time, which were used to calculate both the rate constant and the activation energy of the reactions. As expected, nanocages performed the best followed by nanoboxes, and then partially hollow nanoboxes, with rate constants of 2.83, 1.12, and 0.59 min-1 respectively. After taking into account the reducing power of the citrate, which was present on the surface of the solid gold nanospheres, the rate constants were 0.20 and 0.95 for the 50 nm and 5 nm particles respectively. A similar trend was seen in the activation energies for nanocages (28.04 kJ/mol), nanoboxes (44.25 kJ/mol), and partially hollow nanoboxes (55.44 kJ/mol).
The enhanced performance of the nanocages is likely due to a combination of factors. Due to the porosity of this structure when compared with the other solid walled structures, the amount of accessible surface area is higher. Additionally, the Au/Ag ratio is higher for nanocages compared to the nanoboxes due to dealloying, so the surface will contain less Ag, which does not contribute to the catalytic ability. The wall thickness for nanocages is also the smallest, about 5 nm by TEM measurements. In addition to studies with Au-based nanocages, Pd containing nanocages have also been investigated for hydrogenation reactions. More details about this study can be found in reference [38].
7. Conclusion
Galvanic replacement reaction is a synthetically simple route – it requires no unstable organometallic precursors, takes place in water and at moderate temperatures, and uses very few reagents other than the initial template particles. Despite this initial simplicity, it can be used to generate a wide diversity of structures. A number of trends have emerged through studies with an array of precursors and template particles, which can be used to optimize the syntheses of future materials for specific applications: i) Most fundamentally, it is important to consider the difference in electrochemical potentials of the metals being used. The metal being reduced must have a higher electrochemical potential than the one being oxidized for any replacement to take place, and the gap between them needs to be significant enough to overcome any stabilization if dealloying and pore formation is to occur. ii) Dealloying can also be controlled independently through the introduction of wet etchants, creating extremely thin-walled structures. iii) If a smooth surface is required, the two metals being studied should be mutually dissolvable at the reaction temperature. iv) Surfactants and trace ions can affect the final morphology in unexpected ways. Selective reaction on specific facets, solubilization of byproducts, and unusual segregation of alloy components have all been attributed to the influence of surfactants. v) The presence of twin boundaries, defects, and vacancies can all influence the alloying rate, and even affect the final morphology in some cases. vi) In general, size matters – particles less than ∼20 nm are more likely to form rings than larger particles, as the rate of alloying can be increased. vii) Stoichiometry also plays a role. By using precursors with different oxidation states, different numbers of vacancies will be generated, resulting in different porosities and morphologies. viii) Finally, galvanic replacement can be performed multiple times or combined with other synthetic techniques such as overgrowth to generate increasingly complex structures.
The nanomaterials generated with this method have highly tunable LSPR properties and compositions, making them ideal for applications in biomedicine, photonics, and catalysis. Particular attention has been paid to Au nanocages. The surface of these versatile particles can be modified with PEG and antibodies to create targeted photothermal transducers for cell death, or modified with PNIPAAm-based smart polymers to harness the hollow interior as a drug delivery vessel for precise delivery. Future studies aim to expand and possibly combine these techniques. Additionally, the thin walls and high porosity of Au nanocages make them promising substrates for catalysis, as initially demonstrated with the reduction of p-nitrophenol with NaBH4. Upcoming research in this area is likely to illuminate new mechanisms and unexpected effects, but the studies presented herein represent a strong foundation for future work.
Acknowledgments
This work was supported in part by a Director's Pioneer Award (DP1 OD000798) from NIH, a fellowship from David and Lucile Packard Foundation, a DARPA-DURINT subcontract from Harvard University, and various research grants from NSF and NIH. Y.X. is an Alfred P. Sloan Research Fellow (2000-2002) and a Camille Dreyfus Teacher Scholar (2002-2007). We thank all of our coworkers and collaborators for their invaluable contributions to this work.
Footnotes
Publisher's Disclaimer: This is a PDF file of an unedited manuscript that has been accepted for publication. As a service to our customers we are providing this early version of the manuscript. The manuscript will undergo copyediting, typesetting, and review of the resulting proof before it is published in its final citable form. Please note that during the production process errors may be discovered which could affect the content, and all legal disclaimers that apply to the journal pertain.
References
- 1.Aiken J, Finke R. J Mol Catal A: Chem. 1999;145:1–44. [Google Scholar]
- 2.Burda C, Chen X, Narayanan R, El-Sayed MA. Chem Rev. 2005;105:1025–1102. doi: 10.1021/cr030063a. [DOI] [PubMed] [Google Scholar]
- 3.Narayanan R, El-Sayed M. J Phys Chem B. 2005;109:12663–12676. doi: 10.1021/jp051066p. [DOI] [PubMed] [Google Scholar]
- 4.Lim B, Jiang M, Camargo PHC, Cho EC, Tao J, Lu X, Zhu Y, Xia Y. Science. 2009;324:1302–1305. doi: 10.1126/science.1170377. [DOI] [PubMed] [Google Scholar]
- 5.Ozbay E. Science. 2006;311:189–193. doi: 10.1126/science.1114849. [DOI] [PubMed] [Google Scholar]
- 6.Lu Y, Yin Y, Li Z, Xia Y. Nano Lett. 2002;2:785–788. [Google Scholar]
- 7.Pyayt AL, Wiley B, Xia Y, Chen A, Dalton L. Nature Nanotech. 2008;3:660–665. doi: 10.1038/nnano.2008.281. [DOI] [PubMed] [Google Scholar]
- 8.Shipway A, Katz E, Willner I. ChemPhysChem. 2000;1:18–52. doi: 10.1002/1439-7641(20000804)1:1<18::AID-CPHC18>3.0.CO;2-L. [DOI] [PubMed] [Google Scholar]
- 9.Camden J, Dieringer J, Zhao J, Duyne RV. Acc Chem Res. 2008;41:1653–1661. doi: 10.1021/ar800041s. [DOI] [PubMed] [Google Scholar]
- 10.Rosi NL, Mirkin CA. Chem Rev. 2005;105:1547–62. doi: 10.1021/cr030067f. [DOI] [PubMed] [Google Scholar]
- 11.Alivisatos AP. Nat Biotechnol. 2004;22:47–52. doi: 10.1038/nbt927. [DOI] [PubMed] [Google Scholar]
- 12.Kneipp K, Kneipp H, Itzkan I, Dasari R, Feld M. Chem Rev. 1999;99:2957–2975. doi: 10.1021/cr980133r. [DOI] [PubMed] [Google Scholar]
- 13.Nie S, Emory S. Science. 1997;275:1102–6. doi: 10.1126/science.275.5303.1102. [DOI] [PubMed] [Google Scholar]
- 14.Hu M, Chen J, Li ZY, Au L, Hartland GV, Li X, Marquez M, Xia Y. Chem Soc Rev. 2006;35:1084–94. doi: 10.1039/b517615h. [DOI] [PubMed] [Google Scholar]
- 15.Skrabalak SE, Chen J, Au L, Lu X, Li X, Xia Y. Adv Mater. 2007;19:3177–3184. doi: 10.1002/adma.200701972. [DOI] [PMC free article] [PubMed] [Google Scholar]
- 16.Lal S, Clare SE, Halas NJ. Acc Chem Res. 2008;41:1842–1851. doi: 10.1021/ar800150g. [DOI] [PubMed] [Google Scholar]
- 17.Huang X, El-Sayed IH, Qian W, El-Sayed MA. J Am Chem Soc. 2006;128:2115–2120. doi: 10.1021/ja057254a. [DOI] [PubMed] [Google Scholar]
- 18.Murphy CJ, Gole AM, Stone JW, Sisco PN, Alkilany AM, Goldsmith EC, Baxter SC. Acc Chem Res. 2008;41:1721–1730. doi: 10.1021/ar800035u. [DOI] [PubMed] [Google Scholar]
- 19.Xia Y, Xiong Y, Lim B, Skrabalak SE. Angew Chem Int Ed. 2009;48:60–103. doi: 10.1002/anie.200802248. [DOI] [PMC free article] [PubMed] [Google Scholar]
- 20.Skrabalak SE, Chen J, Sun Y, Lu X, Au L, Cobley CM, Xia Y. Acc Chem Res. 2008;41:1587–1595. doi: 10.1021/ar800018v. [DOI] [PMC free article] [PubMed] [Google Scholar]
- 21.Lu X, Chen J, Skrabalak SE, Xia Y. Proc Inst Mech Eng N. 2008;221:1–16. [Google Scholar]
- 22.Sun Y, Xia Y. J Am Chem Soc. 2004;126:3892–3901. doi: 10.1021/ja039734c. [DOI] [PubMed] [Google Scholar]
- 23.Skrabalak SE, Au L, Li X, Xia Y. Nature Protoc. 2007;2:2182–2190. doi: 10.1038/nprot.2007.326. [DOI] [PubMed] [Google Scholar]
- 24.Halas NJ. MRS Bull. 2005;30:362–367. [Google Scholar]
- 25.Ntziachristos V, Bremer C, Weissleder R. Eur Rad. 2003;13:195–208. doi: 10.1007/s00330-002-1524-x. [DOI] [PubMed] [Google Scholar]
- 26.Weissleder R. Nat Biotechnol. 2001;19:316–317. doi: 10.1038/86684. [DOI] [PubMed] [Google Scholar]
- 27.Song KH, Kim C, Cobley CM, Xia Y, Wang LV. Nano Lett. 2009;9:183–188. doi: 10.1021/nl802746w. [DOI] [PMC free article] [PubMed] [Google Scholar]
- 28.Fu E, Ramsey S, Chen J, Chinowsky T, Wiley BJ, Xia Y, Yager P. Sens Actuators B. 2007;123:606–613. doi: 10.1016/j.snb.2006.09.059. [DOI] [PMC free article] [PubMed] [Google Scholar]
- 29.Sun Y, Xia Y. Anal Chem. 2002;74:5297–5305. doi: 10.1021/ac0258352. [DOI] [PubMed] [Google Scholar]
- 30.Oldenburg S, Averitt R, Westcott S, Halas NJ. Chem Phys Lett. 1998;288:243–247. [Google Scholar]
- 31.Hirsch LR, Gobin AM, Lowery AR, Tam F, Drezek RA, Halas NJ, West JL. Ann Biomed Eng. 2006;34:15–22. doi: 10.1007/s10439-005-9001-8. [DOI] [PubMed] [Google Scholar]
- 32.Graf C, Blaaderen AV. Langmuir. 2002;18:524–534. [Google Scholar]
- 33.Bauer JC, Chen X, Liu Q, Phan TH, Schaak RE. J Mater Chem. 2008;18:275–282. [Google Scholar]
- 34.Chen M, Kumar D, Yi C, Goodman D. Science. 2005;310:291–293. doi: 10.1126/science.1115800. [DOI] [PubMed] [Google Scholar]
- 35.Nutt M, Hughes J, Wong M. Environ Sci Technol. 2005;39:1346–1353. doi: 10.1021/es048560b. [DOI] [PubMed] [Google Scholar]
- 36.Venezia A, Parola VL, Deganello G, Pawelec B, Fierro J. J Catal. 2003;215:317–325. [Google Scholar]
- 37.Bansal V, Jani H, Du Plessis J, Coloe P, Bhargava S. Adv Mater. 2008;20:717–723. [Google Scholar]
- 38.Cobley CM, Campbell D, Xia Y. Adv Mater. 2008;20:748–752. doi: 10.1002/adma.200702501. [DOI] [PMC free article] [PubMed] [Google Scholar]
- 39.Zeng J, Zhang Q, Chen J, Xia Y. Nano Lett. 2009 doi: 10.1021/nl903062e. ASAP. [DOI] [PubMed] [Google Scholar]
- 40.Kim S, Kim M, Lee W, Hyeon T. J Am Chem Soc. 2002;124:7642–7643. doi: 10.1021/ja026032z. [DOI] [PubMed] [Google Scholar]
- 41.Chen HM, Liu RS, Lo MY, Chang SC, Tsai LD, Peng YM, Lee JF. J Phys Chem C. 2008;112:7522–7526. [Google Scholar]
- 42.Dursun A, Pugh D, Corcoran S. J Electrochem Soc. 2003;150:B355–B360. [Google Scholar]
- 43.Greeley J, Norskov J. Electrochim Acta. 2007;52:5829–5836. [Google Scholar]
- 44.Sun Y, Mayers B, Xia Y. Nano Lett. 2002;2:481–485. [Google Scholar]
- 45.Wang Z, Ahmad T, El-Sayed M. Surf Sci. 1997;380:302–310. [Google Scholar]
- 46.Batzill M, Koel B. Surf Sci. 2004;553:50–60. [Google Scholar]
- 47.Chen J, McLellan J, Siekkinen A, Xiong Y, Li ZY, Xia Y. J Am Chem Soc. 2006;128:14776–14777. doi: 10.1021/ja066023g. [DOI] [PMC free article] [PubMed] [Google Scholar]
- 48.Zhang Q, Cobley C, Au L, Mckiernan M, Schwartz A, Wen LP, Chen J, Xia Y. ACS Appl Mater Interfaces. 2009;1:2044–2048. doi: 10.1021/am900400a. [DOI] [PMC free article] [PubMed] [Google Scholar]
- 49.McLellan J, Siekkinen AR, Chen J, Xia Y. Chem Phys Lett. 2006;427:122–126. doi: 10.1016/j.cplett.2006.10.095. [DOI] [PMC free article] [PubMed] [Google Scholar]
- 50.Sun Y, Mayers B, Herricks T, Xia Y. Nano Lett. 2003;3:955–960. [Google Scholar]
- 51.Wiley BJ, Herricks T, Sun Y, Xia Y. Nano Lett. 2004;4:1733–1739. [Google Scholar]
- 52.Wiley BJ, Xiong Y, Li ZY, Yin Y, Xia Y. Nano Lett. 2006;6:765–768. doi: 10.1021/nl060069q. [DOI] [PubMed] [Google Scholar]
- 53.Im SH, Lee YT, Wiley BJ, Xia Y. Angew Chem Int Ed. 2005;44:2154–2157. doi: 10.1002/anie.200462208. [DOI] [PubMed] [Google Scholar]
- 54.Siekkinen AR, McLellan J, Chen J, Xia Y. Chem Phys Lett. 2006;432:491–496. doi: 10.1016/j.cplett.2006.10.095. [DOI] [PMC free article] [PubMed] [Google Scholar]
- 55.Kim MH, Lu X, Wiley BJ, Lee EP, Xia Y. J Phys Chem C. 2008;112:7872–7876. doi: 10.1021/jp711662f. [DOI] [PMC free article] [PubMed] [Google Scholar]
- 56.Tao A, Sinsermsuksakul P, Yang P. Angew Chem Int Ed. 2006;45:4597–4601. doi: 10.1002/anie.200601277. [DOI] [PubMed] [Google Scholar]
- 57.Seo D, Yoo C, Park J, Park S, Ryu S, Song H. Angew Chem Int Ed. 2008;47:763–767. doi: 10.1002/anie.200704094. [DOI] [PubMed] [Google Scholar]
- 58.Yin Y, Erdonmez C, Aloni S, Alivisatos AP. J Am Chem Soc. 2006;128:12671–12673. doi: 10.1021/ja0646038. [DOI] [PubMed] [Google Scholar]
- 59.Sun Y, Xia Y. Nano Lett. 2003;3:1569–1572. [Google Scholar]
- 60.Yin Y, Li ZY, Zhong Z, Gates B, Xia Y, Venkateswaran S. J Mater Chem. 2002;12:522–527. [Google Scholar]
- 61.Sun Y, Xia Y. Analyst. 2003;128:686–691. doi: 10.1039/b212437h. [DOI] [PubMed] [Google Scholar]
- 62.Pyatenko A, Yamaguchi M, Suzuki M. J Phys Chem C. 2007;111:7910–7917. [Google Scholar]
- 63.Sun Y, Tao Z, Chen J, Herricks T, Xia Y. J Am Chem Soc. 2004;126:5940–5941. doi: 10.1021/ja0495765. [DOI] [PubMed] [Google Scholar]
- 64.Sun Y, Wiley B, Li ZY, Xia Y. J Am Chem Soc. 2004;126:9399–406. doi: 10.1021/ja048789r. [DOI] [PubMed] [Google Scholar]
- 65.Vitos L, Ruban A, Skriver H, Kollar J. Surf Sci. 1998;411:186–202. [Google Scholar]
- 66.Fan FR, Liu DY, Wu YF, Duan S, Xie ZX, Jiang ZY, Tian ZQ. J Am Chem Soc. 2008;130:6949–6951. doi: 10.1021/ja801566d. [DOI] [PubMed] [Google Scholar]
- 67.Habas SE, Lee H, Radmilovic V, Somorjai GA, Yang P. Nat Mater. 2007;6:692–697. doi: 10.1038/nmat1957. [DOI] [PubMed] [Google Scholar]
- 68.Cho EC, Camargo PHC, Xia Y. Adv Mater. 2009 ASAP. [Google Scholar]
- 69.Chen J, Wiley BJ, McLellan J, Xiong Y, Li ZY, Xia Y. Nano Lett. 2005;5:2058–2062. doi: 10.1021/nl051652u. [DOI] [PubMed] [Google Scholar]
- 70.Lu X, Tuan HY, Chen J, Li ZY, Korgel BA, Xia Y. J Am Chem Soc. 2007;129:1733–1742. doi: 10.1021/ja067800f. [DOI] [PMC free article] [PubMed] [Google Scholar]
- 71.Liang H, Zhang H, Hu J, Guo Y, Wan L, Bai C. Angew Chem Int Ed. 2004;43:1540–1543. doi: 10.1002/anie.200352956. [DOI] [PubMed] [Google Scholar]
- 72.Selvakannan P, Sastry M. Chem Comm. 2005:1684–1686. doi: 10.1039/b418566h. [DOI] [PubMed] [Google Scholar]
- 73.Millar G, Metson J, Bowmaker G, Cooney R. J Catal. 1994;147:404–416. [Google Scholar]
- 74.Meima G, Knijff L, Vis R, Van A. J Chem Soc Faraday Trans. 1989;85:269–277. [Google Scholar]
- 75.Wu K, Wang D, Wei X, Cao Y, Guo X. J Catal. 1993;140:370–383. [Google Scholar]
- 76.Lefferts L, Vanommen J, Ross J. Appl Catal. 1987;31:291–308. [Google Scholar]
- 77.Shibata T, Bunker BA, Zhang Z, Meisel D, Vardeman CF, Gezelter JD. J Am Chem Soc. 2002;124:11989–11996. doi: 10.1021/ja026764r. [DOI] [PubMed] [Google Scholar]
- 78.Mori H, Komatsu M, Takeda K, Fujita H. Phil Mag Lett. 1991;63:173–178. [Google Scholar]
- 79.Sun Y, Mayers B, Xia Y. Adv Mater. 2003;15:641–646. [Google Scholar]
- 80.Camargo PHC, Xiong Y, Ji L, Zuo JM, Xia Y. J Am Chem Soc. 2007;129:15452–15453. doi: 10.1021/ja077505a. [DOI] [PubMed] [Google Scholar]
- 81.Wetz F, Soulantica K, Falqui A. Angew Chem. 2007;119:7209–7211. doi: 10.1002/anie.200702017. [DOI] [PubMed] [Google Scholar]
- 82.Teng X, Wang Q, Liu P, Han W, Frenkel AI, Wen, Marinkovic N, Hanson JC, Rodriguez JA. J Am Chem Soc. 2008;130:1093–1101. doi: 10.1021/ja077303e. [DOI] [PubMed] [Google Scholar]
- 83.Wonnell S, Delaye J, Bibole M, Limoge Y. J App Phys. 1992;72:5195–5205. [Google Scholar]
- 84.Newman R, Sieradzki K. Science. 1994;263:1708–1709. doi: 10.1126/science.263.5154.1708. [DOI] [PubMed] [Google Scholar]
- 85.Martinez L, Segarra M, Fernandez M, Espiell F. Metall Trans B. 1993;24:827–837. [Google Scholar]
- 86.Sieradzki K. J Electrochem Soc. 1993;140:2868–2872. [Google Scholar]
- 87.Sieradzki K, Dimitrov N, Movrin D, McCall C, Vasiljevic N, Erlebacher J. J Electrochem Soc. 2002;149:B370–B377. [Google Scholar]
- 88.Erlebacher J. J Electrochem Soc. 2004;151:C614–C626. [Google Scholar]
- 89.Erlebacher J, Aziz MJ, Karma A, Dimitrov N, Sieradzki K. Nature. 2001;410:450–453. doi: 10.1038/35068529. [DOI] [PubMed] [Google Scholar]
- 90.Dursun A, Pugh D, Corcoran S. J Electrochem Soc. 2005;152:B65–B72. [Google Scholar]
- 91.Lu X, Au L, McLellan J, Li ZY, Marquez M, Xia Y. Nano Lett. 2007;7:1764–1769. doi: 10.1021/nl070838l. [DOI] [PMC free article] [PubMed] [Google Scholar]
- 92.Au L, Lu X, Xia Y. Adv Mater. 2008;20:2517–2522. doi: 10.1002/adma.200800255. [DOI] [PMC free article] [PubMed] [Google Scholar]
- 93.Au L, Chen Y, Zhou F, Camargo PHC, Lim B, Li ZY, Ginger DS, Xia Y. Nano Res. 2008;1:441–449. doi: 10.1007/s12274-008-8046-z. [DOI] [PMC free article] [PubMed] [Google Scholar]
- 94.Kirkendall EO. Aime Trans. 1942;147:104–109. [Google Scholar]
- 95.Yin Y, Rioux RM, Erdonmez CK, Hughes S, Somorjai GA, Alivisatos AP. Science. 2004;304:711–714. doi: 10.1126/science.1096566. [DOI] [PubMed] [Google Scholar]
- 96.Yin Y, Erdonmez C, Cabot A, Hughes S, Alivisatos AP. Adv Funct Mater. 2006;16:1389–1399. [Google Scholar]
- 97.Fan HJ, Knez M, Scholz R, Nielsch K, Pippel E, Hesse D, Zacharias M, Gosele U. Nat Mater. 2006;5:627–631. doi: 10.1038/nmat1673. [DOI] [PubMed] [Google Scholar]
- 98.Liu B, Zeng HC. J Am Chem Soc. 2004;126:16744–16746. doi: 10.1021/ja044825a. [DOI] [PubMed] [Google Scholar]
- 99.Fan HJ, Gцsele U, Zacharias M. Small. 2007;3:1660–1671. doi: 10.1002/smll.200700382. [DOI] [PubMed] [Google Scholar]
- 100.Cabot A, Smith RK, Yin Y, Zheng H, Reinhard BM, Liu H, Alivisatos AP. ACS Nano. 2008;2:1452–8. doi: 10.1021/nn800270m. [DOI] [PubMed] [Google Scholar]
- 101.Chen J, Lim B, Lee E, Xia Y. Nano Today. 2009;4:81–95. [Google Scholar]
- 102.Kreibig U, Vollmer M. Optical Properties of Metal Clusters. Springer; New York: 1995. [Google Scholar]
- 103.Maier S. Plasmonics: Fundamentals and Applications. Springer; New York: 2007. [Google Scholar]
- 104.Mie G. Anal Phys. 1908;23:377–445. [Google Scholar]
- 105.Draine B, Flatau P. J Opt Soc Am B. 1994;11:1491–1499. [Google Scholar]
- 106.Kelly K, Coronado E, Zhao L, Schatz GC. J Phys Chem B. 2003;107:668–677. [Google Scholar]
- 107.Lu X, Rycenga M, Skrabalak SE, Wiley BJ, Xia Y. Ann Rev Phys Chem. 2009;60:167–92. doi: 10.1146/annurev.physchem.040808.090434. [DOI] [PubMed] [Google Scholar]
- 108.Wiley BJ, Im SH, Li ZY, McLellan J, Siekkinen AR, Xia Y. J Phys Chem B. 2006;110:15666–75. doi: 10.1021/jp0608628. [DOI] [PubMed] [Google Scholar]
- 109.Murphy CJ, Sau TK, Gole AM, Orendorff CJ, Gao J, Gou L, Hunyadi SE, Li T. J Phys Chem B. 2005;109:13857–70. doi: 10.1021/jp0516846. [DOI] [PubMed] [Google Scholar]
- 110.Cobley CM, Rycenga M, Zhou F, Li ZY, Xia Y. J Phys Chem C. 2009;113:16975–16982. doi: 10.1021/jp8101817. [DOI] [PMC free article] [PubMed] [Google Scholar]
- 111.McLellan J, Li ZY, Siekkinen AR, Xia Y. Nano Lett. 2007;7:1013–1017. doi: 10.1021/nl070157q. [DOI] [PubMed] [Google Scholar]
- 112.Jain PK, Huang X, El-Sayed IH, El-Sayed MA. Acc Chem Res. 2008;41:1578–1586. doi: 10.1021/ar7002804. [DOI] [PubMed] [Google Scholar]
- 113.Prodan E, Radloff C, Halas NJ, Nordlander P. Science. 2003;302:419–422. doi: 10.1126/science.1089171. [DOI] [PubMed] [Google Scholar]
- 114.Peer D, Karp JM, Hong S, Farokhzad OC, Margalit R, Langer R. Nature Nanotech. 2007;2:751–760. doi: 10.1038/nnano.2007.387. [DOI] [PubMed] [Google Scholar]
- 115.Heath JR, Davis ME. Annu Rev Med. 2008;59:251–265. doi: 10.1146/annurev.med.59.061506.185523. [DOI] [PMC free article] [PubMed] [Google Scholar]
- 116.Lu H, Campbell C, Castner D. Langmuir. 2000;16:1711–1718. [Google Scholar]
- 117.Harris JM, Martin NE, Modi M. Clin Pharmacokinet. 2001;40:539–551. doi: 10.2165/00003088-200140070-00005. [DOI] [PubMed] [Google Scholar]
- 118.Moghimi SM, Hunter AC, Murray JC. Pharmacol Rev. 2001;53:283–318. [PubMed] [Google Scholar]
- 119.Au L, Zhang Q, Cobley C, Gidding M, Schwartz A, Chen J, Xia Y. ACS Nano. 2009 doi: 10.1021/nn901392m. ASAP. [DOI] [PMC free article] [PubMed] [Google Scholar]
- 120.Daniel MC, Astruc D. Chem Rev. 2004;104:293–346. doi: 10.1021/cr030698+. [DOI] [PubMed] [Google Scholar]
- 121.Chen J, Saeki F, Wiley BJ, Cang H, Cobb MJ, Li ZY, Au L, Zhang H, Kimmey MB, Li X, Xia Y. Nano Lett. 2005;5:473–477. doi: 10.1021/nl047950t. [DOI] [PubMed] [Google Scholar]
- 122.Chen J, Wang D, Xi J, Au L, Siekkinen A, Warsen A, Li ZY, Zhang H, Xia Y, Li X. Nano Lett. 2007;7:1318–1322. doi: 10.1021/nl070345g. [DOI] [PMC free article] [PubMed] [Google Scholar]
- 123.Au L, Zheng D, Zhou F, Li ZY, Li X, Xia Y. ACS Nano. 2008:1645–1652. doi: 10.1021/nn800370j. [DOI] [PMC free article] [PubMed] [Google Scholar]
- 124.Chen J, Glaus C, Laforest R, Zhang Q, Yang M, Gidding M, Welch MJ, Xia Y. Small. 2009 doi: 10.1002/smll.200902216. submitted. [DOI] [PMC free article] [PubMed] [Google Scholar]
- 125.Mayer G, Heckel A. Angew Chem Int Ed. 2006;45:4900–4921. doi: 10.1002/anie.200600387. [DOI] [PubMed] [Google Scholar]
- 126.Gullotti E, Yeo Y. Mol Pharm. 2009;6:1041–1051. doi: 10.1021/mp900090z. [DOI] [PMC free article] [PubMed] [Google Scholar]
- 127.Yavuz MS, Cheng Y, Chen J, Cobley CM, Zhang Q, Rycenga M, Xie J, Kim C, Song KH, Schwartz AG, Wang LV, Xia Y. Nature Mater. 2009;12:935–939. doi: 10.1038/nmat2564. [DOI] [PMC free article] [PubMed] [Google Scholar]
- 128.Hoffman AS. Adv Drug Deliv Rev. 2002;43:3–12. doi: 10.1016/s0169-409x(01)00239-3. [DOI] [PubMed] [Google Scholar]
- 129.Schilli CM, Zhang M, Rizzardo E, Thang SH, Chong YK, Edwards K, Karlsson G, Müller AHE. Macromolecules. 2004;37:7861–7866. [Google Scholar]
- 130.Sun Y, Xia Y. Adv Mater. 2004;16:264–268. [Google Scholar]


