

Abstract
Sequence-specific recognition of nucleic acids by proteins is required for nearly every aspect of gene expression. Quantitative binding experiments are a useful tool to measure the ability of a protein to distinguish between multiple sequences. Here, we describe the use of fluorophore-labeled oligonucleotide probes to quantitatively monitor protein/nucleic acid interactions. We review two complementary experimental methods, fluorescence polarization and fluorescence electrophoretic mobility shift assays, that enable the quantitative measurement of binding affinity. We also present two strategies for post-synthetic end-labeling of DNA or RNA oligonucleotides with fluorescent dyes. The approaches discussed here are efficient and sensitive, providing a safe and accessible alternative to the more commonly used radio-isotopic methods.
Keywords: fluorescence polarization, EMSA, gel shift, fluorophore, post-synthetic labeling, affinity, protein–RNA interaction
INTRODUCTION
Myriad cellular processes require sequence specific recognition of a nucleic acid by a protein. Transcription factors bind to specific DNA elements to enhance or repress transcription at a defined locus (Deplancke et al. 2006; Barrasa et al. 2007; Carrera and Treisman 2008; Noyes et al. 2008). RNA-binding proteins coordinate translation, mRNA localization and stability, and pre-mRNA splicing through association with defined sequences in target transcripts (Varnum et al. 1991; Johnstone and Lasko 2001; Nilsen 2002; Jurica and Moore 2003; Singh and Valcarcel 2005; Iwasaki et al. 2009). As such, it is critically important to understand the basic mechanisms by which DNA- and RNA-binding proteins identify their appropriate target sequences.
There are many ways a protein can recognize a DNA or RNA sequence. Most DNA-binding proteins rely on variations in the pattern of hydrogen bond acceptors and donors in the major groove to achieve sequence-specific recognition (Seeman et al. 1976). Others identify specific sequences through their relative flexibility that induces distortions in the DNA duplex (McClarin et al. 1986; Kim et al. 1993). RNA-binding proteins can recognize sequences through readout of the hydrogen bonding patterns of the bases on the Watson-Crick and Hoogsteen faces, or through shape-specific recognition of RNA secondary and tertiary structure (Howe et al. 1994; Valegard et al. 1994; Hudson et al. 2004; Hall 2005).
To identify the determinants of specificity, it is often necessary to measure the quantitative parameters of binding, such as relative binding affinity and stoichiometry (Schaup et al. 1970; Samuels et al. 1994). There are a number of methods that can be used to monitor protein/nucleic acid complexes (Wong and Lohman 1993; Royer and Scarlata 2008; Ryder et al. 2008). One of the more prominent techniques is the electrophoretic mobility shift assay (EMSA) (Dahlberg et al. 1969; Ryder et al. 2008). EMSA is a powerful technique that allows the visualization of the interaction between a protein and a labeled DNA or RNA probe. Equilibration reactions that include a fixed concentration of a 32P-radiolabeled oligonucleotide probe and varying amounts of protein are run on a native polyacrylamide gel to separate bound from free nucleic acid. Gels are dried and then exposed to film or a phosphorimager plate in order to determine the fraction of bound probe as a function of protein concentration. These data can be fit to determine the apparent equilibrium dissociation constant.
The use of radioactive material has the advantage of making the assay extremely sensitive. Very small amounts of 32P can be detected using common equipment. Another advantage is that the labeled and unlabeled probes are chemically similar, reducing the chance that the binding reaction is perturbed due to indirect effects caused by the label. However, radiolabled probes also have several disadvantages, including safety, environmental, and regulatory challenges. Moreover, radioactive labels are costly, and due to the short half-life of 32P, probes have to be frequently relabeled and radioisotope stocks reordered.
Due to the challenges associated with using radioisotopes, fluorescent probes have become a favorable alternative in many biochemical assays (Royer and Scarlata 2008; LeTilly and Royer 1993; Aviv et al. 2003; Ryder and Williamson 2004; Hardin and Batey 2006; Besse et al. 2009; Kohn et al. 2010). With modern instrumentation, the detection of fluorescent probes now rivals that of 32P-labeled probes. In this review, we present two methods to generate end-labeled fluorescent probes using commercially available fluorescent dyes and simple aqueous phase chemical reactions that can be performed in any laboratory (Reines and Cantor 1974; Czworkowski et al. 1991). In addition, we present two complementary approaches to measure the affinity of a protein for labeled DNA and RNA probes that rely on different physical properties of the complex—fluorescence polarization (FP) and fluorescence EMSA (F-EMSA) (Hellman and Fried 2007; Pagano et al. 2007; Ryder et al. 2008). Both assays can be applied to the same equilibration reactions because the FP measurements do not destroy the sample. Furthermore, the F-EMSA method enables analysis of the gels directly following electrophoresis, avoiding the need to dry and expose the phosphorimager screens, thereby reducing the time required to perform the assay.
We have used the approach described herein to study four RNA-binding proteins required for germline development and/or embryogenesis in the nematode Caenorhabditis elegans (Pagano et al. 2007, 2009; Farley et al. 2008) and two proteins that regulate oligodendrocyte differentiation in vertebrates (SP Ryder, unpubl.). Others have used it to study the association of bacteriophage PP7 coat protein and vertebrate ZBP variants to their cognate RNA sequences (Chao et al. 2008, 2010). These results show that the method is applicable to a wide variety of protein–RNA complexes.
LABELING STRATEGIES
5′-End labeling of DNA and RNA oligonucleotides
Chemically synthesized single-stranded DNA and RNA oligonucleotides can be efficiently post-synthetically labeled at the 5′-end using a two-step semi-enzymatic synthesis strategy described by Czworkowski and coworkers (Fig. 1A; Czworkowski et al. 1991). In the first step, T4 polynucleotide kinase (PNK) is used to transfer the γ-phosphorothioate group from 5′-O-(3-thio) adenosine triphosphate (ATPγS) to the 5′-hydroxyl of the oligonucleotide probe. After an ethanol precipitation step, 5-iodoacetamidofluorescein (5-IAF) is reacted with the phosphorothioate group on the probe in HEPES (pH 7.4)-buffered water to create a covalent adduct between the oligonucleotide and the fluorophore. Unreacted dye is removed by ethanol precipitation followed by a size exclusion spin column. Analytical denaturing polyacrylamide gel electrophoresis is used to assess purity. The reaction yield is measured, comparing the absorbance at 491 nm (fluorescein) to that at 260 nm (nucleotides and fluorescein) (Fig. 1B). We typically observe 80%–95% labeling efficiency. The reaction is simple and efficient and does not require pre-existing chemical modification of the DNA or RNA oligonucleotide. The reactions can be performed at the bench using standard laboratory plasticware. Fume hoods and specialized glass are not required. DNA probes labeled in this way can be used as primers in primer extension, PCR, or RT-PCR assays; the label does not interfere with subsequent enzymatic applications. The reaction is compatible with other iodoacetamide fluorescent dyes, including 7-diethylamino-3-((4′-(iodoacetyl)amino)phenyl)-4-methylcoumarin (DCIA) and tetramethylrhodamine-5-iodoacetamide, enabling a wide variety of downstream applications in several colors. Moreover, the approach is not limited to chemically synthesized DNA or RNA oligonucleotides. In principal, any substrate of PNK can be labeled in this manner.
FIGURE 1.

5′-End labeling of DNA and RNA oligonucleotides. (A) The 5′-end labeling strategy involves reacting unphosphorylated DNA or RNA with T4 PNK and ATP[γ]S to yield a thiol reactive group on the 5′ end. 5-Iodoacetamidofluorescein (5-IAF) is then reacted with the thiol group. (B) An example of an ultraviolet spectrum of a DNA oligonucleotide that was labeled with 5-IAF on the 5′-end. The DNA absorbs at 260 nM, and the fluorescein label absorbs at 492 nM.
3′-End labeling of RNA
In 1974, Reines and Cantor described a simple synthetic method to conjugate fluorescent dyes to RNA molecules at the 3′-end (Reines and Cantor 1974). This approach takes advantage of the vicinal hydroxyls present only at the 3′-end of ribonucleotides to achieve specific labeling without the need to protect other sites in the RNA. In the first step of the reaction, the RNA is incubated with sodium periodate (NaIO4) in a mildly acidic sodium acetate buffer (pH 5.1) in order to oxidize the vicinal hydroxyls to aldehyes (Fig. 2A). Following an ethanol precipitation step, the oxidized RNA is then reacted with fluorescein-5-thiosemicarbazide (FTSC) in order to generate a covalent thiosemicarbazone linkage with the RNA. The product can then be reduced with sodium cyanoborohydride to limit chemical reversibility, but this is not usually necessary. The labeled RNA is resolved from unreacted dye by ethanol precipitation followed by a size exclusion spin column. The products are analyzed as described above in the 5′-end labeling procedure (Fig. 2B).
FIGURE 2.

3′-End labeling of RNA oligonucleotides. (A) The 3′-end labeling strategy involves reacting vicinal hydroxyls of an RNA molecule through sodium periodate cleavage followed by an addition reaction with fluorescein 5-thiosemicarbazide (FTSC). (B) An example of a ultraviolet spectrum of an RNA oligonucleotide that was labeled with FTSC on the 3′-end. The RNA absorbs at 260 nM, and the fluorescein label absorbs at 492 nM.
As above, the reaction can be performed at the bench and does not require prior modification of the RNA oligonucleotide. Unless sodium cyanoborohydride is used, fume hoods and special glassware are not required. Any molecule with vicinal hydroxyls can be labeled this way, including ribonucleotides and longer RNA molecules produced by in vitro transcription. This is an important caveat; if in vitro transcribed RNA is used as the substrate, care must be taken to purify the RNA away from the other nucleotides present in the transcription reaction. Several aldehyde reactive dyes are available. The chemistry is the same for any thiosemicarbazide or hydrazide, including the commercially available Alexa dyes (Invitrogen) in a wide variety of colors, and the useful affinity tag biotinamidocaproyl hydrazide (BACH). As with the prior strategy, labeling efficiency is usually >80%.
There are, of course, other suitable labeling strategies, including body labeling by PCR or in vitro transcription with fluorescent nucleotide analogs (Besse et al. 2009; Kohn et al. 2010). Incorporation of amino, azido, or thiol groups during chemical synthesis of DNA or RNA oligonucleotides that can react with a wide variety of fluorescent dyes may also be used. These strategies are efficient and can be used to make labeled material for the quantitative applications outlined below. However, we prefer the end-labeling methods as any oligonucleotide can be labeled without incorporating reactive moieties during synthesis, and certain applications require an end label rather than random incorporation of a body label. Thus, the methods presented here remove a barrier to the use of fluorescent dyes by making post-synthetic labeling as convenient as the current strategies used to radiolabel nucleic acids.
QUANTITATIVE FLUORESCENCE METHODS TO MONITOR PROTEIN–NUCLEIC ACID INTERACTIONS
FP and F-EMSA can be used to determine the affinity and specificity of a DNA- or RNA-binding protein (Fig. 3). Both assays rely on different physical properties of the complex. Each require recombinant protein that has been purified to >95% homogeneity and a fluorescently labeled DNA or RNA probe. Both assays conveniently use the same experimental setup; thus it is possible to perform both assays using the same series of binding reactions. Since the FP is nondestructive, F-EMSA can be performed immediately following the polarization measurement.
FIGURE 3.

An overall schematic of the presented binding assays. The experiment is typically set up in a 96-well plate (black) format. A dilution series of the nucleic acid binding protein is equilibrated with trace amounts of fluorescently labeled oligonucleotides. After the experiment has been given time to reach equilibrium, the fluorescence polarization (FP) of each sample is measured. In the FP illustration shown, a sample is excited with polarized light. Emitted light is then measured using filters both parallel and perpendicular to the plain of excitation. Samples can then be run on a native gel (F-EMSA) directly after measuring FP. Measurements of either polarization (mP) or the fraction of RNA bound is then plotted as a function of protein concentration. The experimental design described provides two complementary approaches that depend upon different physical properties of the complex and enable quantitative measurements of the interaction.
FP assays
FP is a useful technique to study the thermodynamic and kinetic properties of a protein–nucleic acid interaction (LeTilly and Royer 1993; Aviv et al. 2003; Ryder and Williamson 2004). FP takes advantage of the change in the tumbling properties of a fluorescent ligand upon binding to a larger macromolecule: in our case, a fluorescent DNA or RNA probe and a nucleic acid–binding protein. Polarized light is used to excite the fluorophore, and emitted light is measured in planes both parallel and perpendicular to the plane of excitation. A labeled probe that is free in solution tumbles more rapidly because of its comparatively low molecular weight, leading to the depolarization of the emitted light. However, tumbling is reduced when the nucleic acid is bound to protein, causing an increase in polarization. The maximal extent of the increase is dependent on the size of the protein, the size of the labeled probe, and the lifetime of the fluorophore.
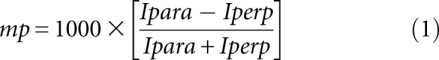
To measure the apparent affinity of the protein–nucleic acid complex, a series of equilibration reactions are set up with varying concentrations of protein and fixed trace amounts of labeled probe. After equilibration, polarization is determined using a fluorometer or a fluorescence plate reader equipped with polarizers. The extent of polarization is influenced by the relative concentration of each fluorescent species in the equilibration reaction. As such, polarization is directly proportional to the fraction of bound probe at each protein concentration. It is also important to note that if higher-order species are formed or if there is unreacted dye in the equilibration reaction, these will contribute to the apparent polarization value as well. The effective polarization, expressed in units of millipolarization (mP), is related to the fluorescence intensity (I) in the parallel (para) and perpendicular (perp) planes by Equation 1. Most plate readers capable of FP measurements report this value automatically.
 |
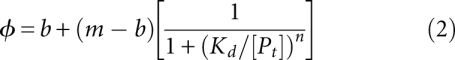
The data are then plotted as a function of protein concentration and fit to the Hill Equation 2 in order to determine the apparent equilibrium dissociation constant (Kd) and the apparent cooperativity (n) between a macromolecule (Pt) and its ligand (Fig. 4). The equation presented here uses the maximum (m) and base (b) signals as normalization factors that represent the polarization values at the upper and lower asymptote of the titration (Hill 1910).
 |
Other parameters that can be measured by this approach include the stoichiometry of the complex, determined by repeating the equilibration reactions at elevated probe concentration and fitting mP as a function of molar ratio to a quadratic equation derived by Rambo and Doudna (2004). FP is especially amenable to kinetic measurements, as the change in polarization can be measured in real time by many instruments.
FIGURE 4.

A sample fluorescence polarization (FP) assay. Raw FP data of the RNA binding protein MEX-3 interacting with one of its target RNA sequences are shown (Pagano et al. 2009). The data are given in units of millipolarization (mP), and the equilibrium dissociation constant (Kd,app) is given for the complex. Shown is a single replicate experiment.
The primary limitation of FP is that it requires a relatively small labeled ligand, usually ≤10 kDa when using fluorescein dyes. The lifetime of the fluorophore defines the size limit of the ligand. If the labeled probe cannot efficiently depolarize the emitted light within the lifetime of the fluorophore, it is not possible to measure the change in depolarization caused by binding to a protein. Other factors that contribute to the size limit include the shape and flexibility of the ligand. We typically use this approach for single-stranded RNA probes that are ≤30 nucleotides (nt). Smaller probes may be necessary for double-stranded DNA or RNA. The use of aliphatic linkers between the nucleic acid and the fluorophore should be avoided to minimize the “propeller effect,” which decouples fluorophore rotation from the rotational correlation time of the labeled DNA or RNA (Lynch et al. 1997; Wu et al. 1997). It is also important to control for fluorescence quenching. This is easily determined by monitoring fluorescence intensity in addition to anisotropy as a function of protein concentration. If quenching occurs, it may be necessary to try the label at the other end of the nucleic acid or to extend the nucleic acid beyond the footprint of the associating protein.
Electrophoretic mobility shift assays
F-EMSA is a complementary approach to measure the affinity of an interaction between a nucleic acid and a protein. This method relies on the ability of a protein to influence the migration of a labeled nucleic acid through a native polyacrylamide or agarose gel (Hellman and Fried 2007; Ryder et al. 2008). The migration depends upon the length, and as a result the overall charge, as well as the shape of the nucleic acid. If association of a protein perturbs these parameters, it can change the rate of migration, enabling separation of bound and free probe. As with FP, a series of equilibration reactions are set up such that protein concentration varies while a trace amount of labeled probe remains at the same concentration in each reaction. After equilibration, the reactions are loaded onto the gel and subjected to electrophoresis in order to separate bound from free RNA. Then, the fraction of bound RNA is determined and fit as a function of protein concentration to the Hill equation as described above. The primary advantage of this approach is that it enables visualization of both free and bound probe. Thus, if multiple proteins bind to the DNA or RNA sequence, this usually manifests as multiple shifted species. Moreover, if the probe has degraded, this can be assessed as well. The disadvantage of this approach is that it does not provide a true equilibrium measurement. Complexes with fast off rates will dissociate in the time it takes to load the sample, perturbing the apparent affinity.
Traditionally, EMSA is performed with radioactively labeled probes in vertical gel equipment (Hellman and Fried 2007; Ryder et al. 2008). We have observed that fluorescent probes provide sufficient sensitivity for use in experiments that require low nanomolar concentrations of the labeled oligo. To achieve sufficient sensitivity, we adapted the EMSA approach to horizontal submarine polyacrylamide gels, which enables loading of more sample per well compared to standard vertical gel equipment. Moreover, the horizontal format enables multiplexing of experiments as more than one comb can be used to create wells in the gel matrix. Immediately following electrophoresis, the gel is imaged using a fluorescent-capable phosphorimager equipped with the appropriate laser to excite the fluorophore (Fuji FLA-5000 or similar) (Fig. 5). This approach does not require drying the gel or exposing the gel to a phosphorimager screen, which saves time relative to experiments performed with radioactive probes.
FIGURE 5.

A sample fluorescent gel shift assay. The RNA binding protein MEX-3 interacting with one of its target RNAs is shown (Pagano et al. 2009). Fluorescently labeled RNAs are shown in the gel as black bands. A plot of the fraction RNA bound at varying MEX-3 concentrations is given. The equilibrium dissociation constant (Kd,app) is given for the complex.
The data obtained by F-EMSA produce comparable results to radioactive experiments. For example, we determined the affinity of recombinant QKI RNA-binding domain for its high affinity binding site in the Mbp 3′-UTR by F-EMSA (Supplemental Fig. 1). The apparent equilibrium dissociation constant is 26 ± 14 nM, identical to the value previously determined by radioactive EMSA (25 ± 4 nM) (Ryder and Williamson 2004). However, it is worth noting that the apparent cooperativity seems greater by F-EMSA than by radioactive EMSA (napp = 1.8 ± 0.4 versus 1.0 ± 0.2), which could be due to the increase in RNA concentration needed to detect binding, or to limitations of detection at the edge of the binding transition. Caution is warranted when interpreting the Hill coefficient by F-EMSA; we suggest comparing the Hill obtained by F-EMSA to values obtained by another approach, such as FP, to increase confidence in this parameter. In this case, the Kd, app determined by FP is 22 ± 9 nM, and the napp is 1.1 ± 0.1.
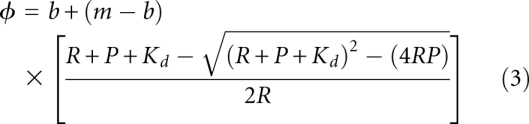
The primary disadvantage of F-EMSA is that the minimum amount of substrate needed to make an observation depends upon fluorophore concentration, labeling efficiency, quantum yield, and instrument sensitivity. In our experience, 2–4 nM fluorescein end-labeled nucleic acid is needed to achieve sufficient signal-to-noise for a quantitative measurement. Thus, for proteins that bind to their target sequences with an apparent Kd <20–40 nM, the trace assumption associated with fitting the Hill equation will be violated. In such cases, it may be necessary to fit the data to a quadratic equation (Equation 3, where R is labeled nucleic acid concentration, P is the total protein concentration, and other symbols are labeled as in Equation 2) or use a substrate with more labeled nucleotides, such as an in vitro transcript that has been body-labeled with fluorescent nucleotide analog. Failure to do so will lead to over-estimation of the equilibrium dissociation constant and Hill coefficient.
 |
Concluding remarks
This review presents a fluorescent alternative to common radiographic EMSA. The approach enables quantitative assessment of protein–nucleic acid binding affinity, specificity, and stoichiometry. Moreover, it improves upon standard radiographic methods in that two independent measurements—each of which depends on a different physical property of the protein–nucleic acid complex—can be obtained using the same reactions. The method uses standard equipment and instrumentation that is widely available in research settings. It provides a viable alternative when radioactive measurements are complicated by restrictive regulation. The approach should be generally useful to anyone interested in quantitative analysis of protein–nucleic acid interactions.
SUPPLEMENTAL MATERIAL
Supplemental material can be found at http://www.rnajournal.org.
ACKNOWLEDGMENTS
We thank Dr. Ruth Zearfoss and Brian Farley for helpful comments concerning this manuscript, and William Flaherty for technical assistance. This work was supported by a National Institutes of Health Grant GM081422 to S.P.R.
Footnotes
Article published online ahead of print. Article and publication date are at http://www.rnajournal.org/cgi/doi/10.1261/rna.2428111.
REFERENCES
- Aviv T, Lin Z, Lau S, Rendl LM, Sicheri F, Smibert CA 2003. The RNA-binding SAM domain of Smaug defines a new family of post-transcriptional regulators. Nat Struct Biol 10: 614–621 [DOI] [PubMed] [Google Scholar]
- Barrasa MI, Vaglio P, Cavasino F, Jacotot L, Walhout AJ 2007. EDGEdb: A transcription factor-DNA interaction database for the analysis of C. elegans differential gene expression. BMC Genomics 8: 21 doi: 10.1186/1471-2164-8-21 [DOI] [PMC free article] [PubMed] [Google Scholar]
- Besse F, Lopez de Quinto S, Marchand V, Trucco A, Ephrussi A 2009. Drosophila PTB promotes formation of high-order RNP particles and represses oskar translation. Genes Dev 23: 195–207 [DOI] [PMC free article] [PubMed] [Google Scholar]
- Carrera I, Treisman JE 2008. Message in a nucleus: Signaling to the transcriptional machinery. Curr Opin Genet Dev 18: 397–403 [DOI] [PMC free article] [PubMed] [Google Scholar]
- Chao JA, Patskovsky Y, Almo SC, Singer RH 2008. Structural basis for the coevolution of a viral RNA-protein complex. Nat Struct Mol Biol 15: 103–105 [DOI] [PMC free article] [PubMed] [Google Scholar]
- Chao JA, Patskovsky Y, Patel V, Levy M, Almo SC, Singer RH 2010. ZBP1 recognition of β-actin zipcode induces RNA looping. Genes Dev 24: 148–158 [DOI] [PMC free article] [PubMed] [Google Scholar]
- Czworkowski J, Odom OW, Hardesty B 1991. Fluorescence study of the topology of messenger RNA bound to the 30S ribosomal subunit of Escherichia coli. Biochemistry 30: 4821–4830 [DOI] [PubMed] [Google Scholar]
- Dahlberg AE, Dingman CW, Peacock AC 1969. Electrophoretic characterization of bacterial polyribosomes in agarose-acrylamide composite gels. J Mol Biol 41: 139–147 [DOI] [PubMed] [Google Scholar]
- Deplancke B, Mukhopadhyay A, Ao W, Elewa AM, Grove CA, Martinez NJ, Sequerra R, Doucette-Stamm L, Reece-Hoyes JS, Hope IA, et al. 2006. A gene-centered C. elegans protein-DNA interaction network. Cell 125: 1193–1205 [DOI] [PubMed] [Google Scholar]
- Farley BM, Pagano JM, Ryder SP 2008. RNA target specificity of the embryonic cell fate determinant POS-1. RNA 14: 2685–2697 [DOI] [PMC free article] [PubMed] [Google Scholar]
- Hall TM 2005. Multiple modes of RNA recognition by zinc finger proteins. Curr Opin Struct Biol 15: 367–373 [DOI] [PubMed] [Google Scholar]
- Hardin JW, Batey RT 2006. The bipartite architecture of the sRNA in an archaeal box C/D complex is a primary determinant of specificity. Nucleic Acids Res 34: 5039–5051 [DOI] [PMC free article] [PubMed] [Google Scholar]
- Hellman LM, Fried MG 2007. Electrophoretic mobility shift assay (EMSA) for detecting protein–nucleic acid interactions. Nat Protoc 2: 1849–1861 [DOI] [PMC free article] [PubMed] [Google Scholar]
- Hill AV 1910. The possible effects of the aggregation of the molecules of haemoglobin on its oxygen dissociation curve. J Physiol 40: 4–7 [Google Scholar]
- Howe PW, Nagai K, Neuhaus D, Varani G 1994. NMR studies of U1 snRNA recognition by the N-terminal RNP domain of the human U1A protein. EMBO J 13: 3873–3881 [DOI] [PMC free article] [PubMed] [Google Scholar]
- Hudson BP, Martinez-Yamout MA, Dyson HJ, Wright PE 2004. Recognition of the mRNA AU-rich element by the zinc finger domain of TIS11d. Nat Struct Mol Biol 11: 257–264 [DOI] [PubMed] [Google Scholar]
- Iwasaki S, Kawamata T, Tomari Y 2009. Drosophila argonaute1 and argonaute2 employ distinct mechanisms for translational repression. Mol Cell 34: 58–67 [DOI] [PubMed] [Google Scholar]
- Johnstone O, Lasko P 2001. Translational regulation and RNA localization in Drosophila oocytes and embryos. Annu Rev Genet 35: 365–406 [DOI] [PubMed] [Google Scholar]
- Jurica MS, Moore MJ 2003. Pre-mRNA splicing: Awash in a sea of proteins. Mol Cell 12: 5–14 [DOI] [PubMed] [Google Scholar]
- Kim JL, Nikolov DB, Burley SK 1993. Co-crystal structure of TBP recognizing the minor groove of a TATA element. Nature 365: 520–527 [DOI] [PubMed] [Google Scholar]
- Kohn M, Lederer M, Wachter K, Huttelmaier S 2010. Near-infrared (NIR) dye-labeled RNAs identify binding of ZBP1 to the noncoding Y3-RNA. RNA 16: 1420–1428 [DOI] [PMC free article] [PubMed] [Google Scholar]
- LeTilly V, Royer CA 1993. Fluorescence anisotropy assays implicate protein-protein interactions in regulating trp repressor DNA binding. Biochemistry 32: 7753–7758 [DOI] [PubMed] [Google Scholar]
- Lynch BA, Loiacono KA, Tiong CL, Adams SE, MacNeil IA 1997. A fluorescence polarization based Src-SH2 binding assay. Anal Biochem 247: 77–82 [DOI] [PubMed] [Google Scholar]
- McClarin JA, Frederick CA, Wang BC, Greene P, Boyer HW, Grable J, Rosenberg JM 1986. Structure of the DNA-Eco RI endonuclease recognition complex at 3 A resolution. Science 234: 1526–1541 [DOI] [PubMed] [Google Scholar]
- Nilsen TW 2002. The spliceosome: No assembly required? Mol Cell 9: 8–9 [DOI] [PubMed] [Google Scholar]
- Noyes MB, Christensen RG, Wakabayashi A, Stormo GD, Brodsky MH, Wolfe SA 2008. Analysis of homeodomain specificities allows the family-wide prediction of preferred recognition sites. Cell 133: 1277–1289 [DOI] [PMC free article] [PubMed] [Google Scholar]
- Pagano JM, Farley BM, McCoig LM, Ryder SP 2007. Molecular basis of RNA recognition by the embryonic polarity determinant MEX-5. J Biol Chem 282: 8883–8894 [DOI] [PubMed] [Google Scholar]
- Pagano JM, Farley BM, Essien KI, Ryder SP 2009. RNA recognition by the embryonic cell fate determinant and germline totipotency factor MEX-3. Proc Natl Acad Sci 106: 20252–20257 [DOI] [PMC free article] [PubMed] [Google Scholar]
- Rambo RP, Doudna JA 2004. Assembly of an active group II intron-maturase complex by protein dimerization. Biochemistry 43: 6486–6497 [DOI] [PubMed] [Google Scholar]
- Reines SA, Cantor CR 1974. New fluorescent hydrazide reagents for the oxidized 3′-terminus of RNA. Nucleic Acids Res 1: 767–786 [DOI] [PMC free article] [PubMed] [Google Scholar]
- Royer CA, Scarlata SF 2008. Fluorescence approaches to quantifying biomolecular interactions. Methods Enzymol 450: 79–106 [DOI] [PubMed] [Google Scholar]
- Ryder SP, Williamson JR 2004. Specificity of the STAR/GSG domain protein Qk1: Implications for the regulation of myelination. RNA 10: 1449–1458 [DOI] [PMC free article] [PubMed] [Google Scholar]
- Ryder SP, Recht MI, Williamson JR 2008. Quantitative analysis of protein–RNA interactions by gel mobility shift. Methods Mol Biol 488: 99–115 [DOI] [PMC free article] [PubMed] [Google Scholar]
- Samuels ME, Bopp D, Colvin RA, Roscigno RF, Garcia-Blanco MA, Schedl P 1994. RNA binding by Sxl proteins in vitro and in vivo. Mol Cell Biol 14: 4975–4990 [DOI] [PMC free article] [PubMed] [Google Scholar]
- Schaup HW, Green M, Kurland CG 1970. Molecular interactions of ribosomal components. I. Identification of RNA binding sites for individual 30S ribosomal proteins. Mol Gen Genet 109: 193–205 [DOI] [PubMed] [Google Scholar]
- Seeman NC, Rosenberg JM, Rich A 1976. Sequence-specific recognition of double helical nucleic acids by proteins. Proc Natl Acad Sci 73: 804–808 [DOI] [PMC free article] [PubMed] [Google Scholar]
- Singh R, Valcarcel J 2005. Building specificity with nonspecific RNA-binding proteins. Nat Struct Mol Biol 12: 645–653 [DOI] [PubMed] [Google Scholar]
- Valegard K, Murray JB, Stockley PG, Stonehouse NJ, Liljas L 1994. Crystal structure of an RNA bacteriophage coat protein-operator complex. Nature 371: 623–626 [DOI] [PubMed] [Google Scholar]
- Varnum BC, Ma QF, Chi TH, Fletcher B, Herschman HR 1991. The TIS11 primary response gene is a member of a gene family that encodes proteins with a highly conserved sequence containing an unusual Cys-His repeat. Mol Cell Biol 11: 1754–1758 [DOI] [PMC free article] [PubMed] [Google Scholar]
- Wong I, Lohman TM 1993. A double-filter method for nitrocellulose-filter binding: Application to protein–nucleic acid interactions. Proc Natl Acad Sci 90: 5428–5432 [DOI] [PMC free article] [PubMed] [Google Scholar]
- Wu P, Brasseur M, Schindler U 1997. A high-throughput STAT binding assay using fluorescence polarization. Anal Biochem 249: 29–36 [DOI] [PubMed] [Google Scholar]