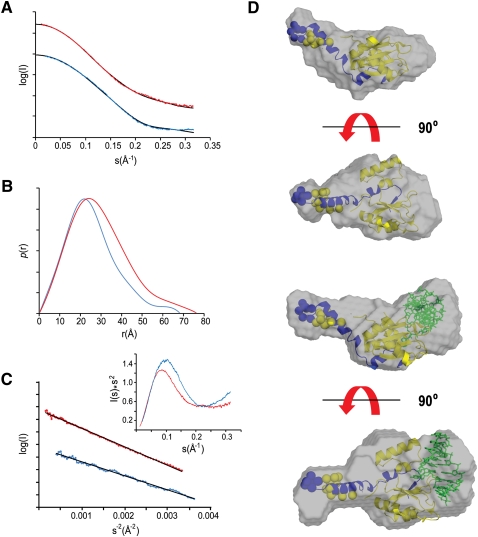
FIGURE 5.
Small-angle X-ray scattering (SAXS) analysis of p14/SF3b155 peptide and tethered p14/SF3b155 peptide•RNA complexes. (A) Experimental SAXS curves for p14/SF3b155 peptide (blue) and p14/SF3b155 peptide•RNA (red); also shown in black are scattering curves calculated from the CHADD (p14/SF3b155 peptide) or SASREF models (p14/SF3b155 peptide•RNA). (B) Distance distribution functions, P(r), for p14/SF3b155 peptide (blue) and p14/SF3b155 peptide•RNA (red) complexes calculated from the experimental scattering data using GNOM. (C) Guinier plots of p14/SF3b155 peptide (blue) and p14/SF3b155 peptide•RNA data (red); (inset) Kratky plots. (D, upper) SAXS envelope for the p14/SF3b155 peptide complex derived from the DAMMIN refined ab initio model superimposed on the model from CHADD. (Lower) SAXS envelope for the p14/SF3b155 peptide•RNA complex derived from the DAMMIN refined ab initio model superimposed on the model from SASREF. Dummy residues added for (yellow) p14 and (blue) SF3b155 using CHADD.

