

Abstract
Background
AZD6244 (ARRY-142886) is a potent small molecule inhibitor of MEK1/2 that is in phase 2 clinical development.
Procedures
AZD6244 was tested against the PPTP in vitro panel (1 nM-10μM). In vivo AZD6244 was tested at a dose of 100 mg/kg administered orally twice daily five days per week for 6 weeks. Subsequently, AZD6244 was evaluated against two juvenile pilocytic astrocytoma (JPA) xenografts using once and twice daily dosing schedules. Phosphorylation of ERK1/2 was used as a surrogate for in vivo inhibition of MEK1/2 was determined by immunoblotting.
Results
At the highest concentration used in vitro (10 μM) AZD6244 only inhibited growth by 50% in 5 of the 23 cell lines. Against the in vivo tumor panels, AZD6244 induced significant differences in EFS distribution in 10 of 37 (27%) solid tumor models and 0 of 6 acute lymphoblastic leukemia (ALL) models. There were no objective responses. Pharmacodynamic studies indicated at this dose and schedule AZD6244 completely inhibited ERK1/2 phosphorylation. AZD6244 was evaluated against two JPA xenografts, BT-35 (wild type BRAF) and BT-40 (mutant [V600E] BRAF). BT-40 xenografts were highly sensitive to AZD6244, whereas BT-35 xenografts progressed on AZD6244 treatment.
Conclusions
At the dose and schedule of administration used, AZD6244 as a single agent had limited in vitro and in vivo activity against the PPTP tumor panels despite inhibition of MEK1/2 activity. However, AZD6244 was highly active against BT-40 JPA xenografts that harbor constitutively activated BRAF, causing complete regressions.
Keywords: Preclinical Testing, Developmental Therapeutics, AZD6244
INTRODUCTION
MEK1 and MEK2 (mitogen-activated protein kinase kinase) are dual-specificity protein kinases that function in a mitogen activated protein kinase (MAPK) cascade controlling cell proliferation and differentiation. MEK1/2 activate the extracellular signal-regulated kinases 1 and 2 (ERK 1/2), which have wide substrate specificity, resulting in activation of a multitude of cellular responses involved in control of growth, differentiation and apoptosis.
Constitutive activation of the MAPK pathway in human tumors is a common event. Activation may occur through multiple mechanisms, including gain-of-function mutations in RAS family members and BRAF [1] and through activation of growth factor signaling. Over 40 missense mutations have been identified in the BRAF gene, among which the 1799A point mutation in exon 15 accounts for up to 90% [2]. This mutation causes a V600E amino-acid substitution in codon 600 and converts BRAF into a constitutively activated dominant transforming protein kinase, BRAFV600E, which causes cancer through aberrant activation of the Ras/Raf/MEK/MAP kinase/ERK signaling pathway (MAP kinase pathway). However mutations of BRAF as a mechanism of tumorigenesis in childhood solid cancers appears to be rare [3] as no mutations were found in 181 childhood tumors including neuroblastoma, Wilms tumor, hepatoblastoma, teratoma, rhabdomyosarcoma and ganglioneuroma. Similarly, no evidence for oncogenic mutations affecting NRAS, KRAS, HRAS, BRAF were identified in medulloblastoma [4]. In contrast mutations of BRAF and NRAS appear more frequently in childhood acute lymphoblastic leukemia (ALL) [5,6]. More recently, tandem duplication producing a novel fusion gene (KIAA1549-BRAF) that lacks the BRAF regulatory domain has been described in juvenile pilocytic astrocytomas (JPA) [7-10], whereas activating mutations in JPA are less frequent, being identified in approximately 5 percent of cases.
As the primary activator of ERK 1/2, MEK1/2 is a compelling target for anti-neoplastic therapy [2,11]. AZD6244 (ARRY-142886) is a potent and selective inhibitor of MEK 1/2 kinases [12-14] that is currently in phase II clinical development [15,16]. Given the selectivity of AZD6244 for MEK 1/2 [13,14], the Pediatric Preclinical Testing Program (PPTP) evaluated this agent to gain insight into the utility of specifically targeting the MAPK pathway in pediatric tumors.
MATERIALS AND METHODS
In vitro testing
In vitro testing was performed using DIMSCAN, a semiautomatic fluorescence-based digital image microscopy system that quantifies viable (using fluorescein diacetate [FDA]) cell numbers in tissue culture multiwell plates [17]. Cells were incubated in the presence of AZD6244 for 96 hours at concentrations from 1 nM to 10 μM and analyzed as previously described [18].
In vivo tumor growth inhibition studies
CB17SC-M scid−/− female mice (Taconic Farms, Germantown NY), were used to propagate subcutaneously implanted kidney/rhabdoid tumors, sarcomas (Ewing, osteosarcoma, rhabdomyosarcoma), neuroblastoma, and non-glioblastoma brain tumors, while BALB/c nu/nu mice were used for glioma models, as previously described [19-21]. Human leukemia cells were propagated by intravenous inoculation in female non-obese diabetic (NOD)/scid−/− mice as described previously [22]. Female mice were used irrespective of the gender of the patient from which the tumor was derived. All mice were maintained under barrier conditions and experiments were conducted using protocols and conditions approved by the institutional animal care and use committee of the appropriate consortium member. Ten mice were used per group for solid tumors and 8 mice per group were used for ALL models. Tumor volumes (cm3) [solid tumor xenografts] or percentages of human CD45-positive [hCD45] cells [ALL xenografts] were determined as previously described [23]. Responses were determined using three activity measures as previously described [23]. An in-depth description of the analysis methods is included in the Supplemental Response Definitions section.
Statistical Methods
The exact log-rank test, as implemented using Proc StatXact for SAS®, was used to compare event-free survival distributions between treatment and control groups. P-values were two-sided and were not adjusted for multiple comparisons given the exploratory nature of the studies.
Drugs and Formulation
AZD6244 was provided to the Pediatric Preclinical Testing Program by AstraZeneca through the Cancer Therapy Evaluation Program (NCI). AZD6244 was dissolved in 0.5% hydroxypropyl methyl cellulose, 0.1% Polysorbate 80 and administered p.o., using a twice daily schedule (excepting weekends, for which a once daily (SID) schedule was used) for 6 weeks at a dose of 100 mg/kg. AZD6244 was provided to each consortium investigator in coded vials for blinded testing.
Pharmacodynamic studies
MEK1/2 inhibition was determined by assaying phosphorylation of ERK1/2 by immunoblotting. Mice bearing OS-33 xenografts were treated with either vehicle or AZD6244 at 100mg/kg BID for 5 days. Tumors were harvested 1 hour after the first dose on day 5 [24]. Tumors were excised, snap frozen and analyzed for phospho-ERK1/2 using anti-phospho ERK1/2(Thr202/Tyr204) antibody (Cell Signaling, Beverly, MA) by Western blot analysis as described previously [24].
BRAF sequencing
The genomic DNA from BT-35 and BT-40 was screened for BRAF mutations with primers designed to amplify the exons 1-18 using primers described previously [1]. Big Dye Terminator Chemistry was used for sequencing.
FISH analysis
Purified BRAF BAC DNA was labeled with digoxigenin-11-dUTP (Roche Molecular Biochemicals, Indianapolis, IN) by nick translation. The labeled probe was combined with sheared mouse DNA and independently hybridized to interphase nuclei derived from the 3 samples in a solution containing 50% formamide, 10% dextran sulfate, and 2X SSC. Probe-detection was performed by incubating the hybridized slides in fluorescein-labeled anti-digoxigenin (Roche Molecular Biochemicals).
Affymetrix SNP6.0 array analysis
DNA was extracted from xenograft samples using DNeasy Tissue kit (Qiagen). Microarray analysis of genomic DNA was done in the Hartwell Center Core Laboratory using the Affymetrix Genome-Wide Human 6.0 SNP array, containing ~1.8 million markers throughout the genome, according to the standard Affymetrix protocol. Copy number analysis and segmentation were performed using the CNATv5 algorithm as implemented in the Affymetrix Genotyping Console v 3.01. Tumor DNA was compared to a diploid reference set comprising 129 St. Jude Children’s Research Hospital acute lymphoblastic leukemia remission samples. The Hidden Markov model in the CNATv5 algorithm was used to infer copy number and to identify genomic gains and losses. Segments with aberrant copy number were identified only if they consisted of at least 10 consecutive markers and comprised a minimum size of 100kb.
RESULTS
In vitro testing
AZD6244 inhibited growth in a minority of the cell lines from the PPTP in vitro panel. Kasumi-1, a cell line with an activating mutation in KIT, was the most responsive cell line and the only cell line with a clear cytotoxic response to AZD6244. Four of the remaining 22 cell lines achieved at least 50% growth inhibition, including two rhabdomyosarcoma cell lines (RD and Rh18), a neuroblastoma cell line (NB-EBc1), and a T-cell ALL cell line (MOLT-4) (Table 1). The distribution of IC50 values and examples of responses for Kasumi-1 and NB-EBc1 are shown in Figure 1.
Table I.
Activity of AZD6244 against Cell Lines in the PPTP in Vitro Panel
| Cell Line | Status | Histology | Minimum T/C (%) | EC50 (nM) | IC50 (nM) | BRAF Status* |
RAS (Amino acid position) |
|---|---|---|---|---|---|---|---|
| RD | Rhabdomyosarcoma | 29.0 | 122 | 430 | Wild Type | NRAS (p.Q61H) | |
| Rh41 | Post-Therapy | Rhabdomyosarcoma | 71.5 | >10,000 | >10,000 | ||
| Rh18 | Diagnosis | Rhabdomyosarcoma | 27.2 | 1427 | 1433 | Wild Type | |
| Rh30 | Diagnosis | Rhabdomyosarcoma | 82.1 | >10,000 | >10,000 | Wild Type | |
| BT-12 | Diagnosis | Rhabdoid | 69.7 | >10,000 | >10,000 | ||
| CHLA-266 | Diagnosis | Rhabdoid | 61.4 | >10,000 | >10,000 | ||
| TC-71 1 | Post-Therapy | Ewing | 81.8 | >10,000 | >10,000 | ||
| CHLA-9 | Diagnosis | Ewing | 69.2 | >10,000 | >10,000 | ||
| CHLA-10 | Post-Therapy | Ewing | 75.4 | >10,000 | >10,000 | ||
| CHLA-258 | Post-Bone Marrow Transplant |
Ewing | 75.1 | >10,000 | >10,000 | ||
| SJ-GBM2 | Post-Therapy | Glioblastoma | 67.3 | >10,000 | >10,000 | ||
| NB-1643 | Diagnosis | Neuroblastoma | 98.6 | >10,000 | >10,000 | ||
| NB-EBc1 | Post-Therapy | Neuroblastoma | 39.9 | 36 | 356 | ||
| CHLA-90 | Post-Bone Marrow Transplant |
Neuroblastoma | 52.1 | >10,000 | >10,000 | ||
| CHLA-136 | Post-Bone Marrow Transplant |
Neuroblastoma | 81.1 | >10,000 | >10,000 | ||
| COG-LL-317 | Post-Therapy | ALL T-cell | 68.2 | >10,000 | >10,000 | ||
| NALM-6 | Post-Therapy | ALL B-precursor | 72.1 | >10,000 | >10,000 | Wild Type | Wild Type |
| RS4;111 | Post-Therapy | ALL B-precursor | 100.0 | >10,000 | >10,000 | Wild Type | Wild Type |
| MOLT-4 | Post-Therapy | ALL T-cell | 41.5 | 149 | 3450 | Wild Type | NRAS (p.G12C) |
| CCRF-CEM | ALL T-cell | 93.6 | >10,000 | >10,000 | Wild Type | KRAS (p.G12D) | |
| Kasumi-1 ** | Post-Bone Marrow Transplant |
AML | 2.4 | 199.91 | 200 | Wild Type | Wild Type |
| Karpas-299 | Post-Therapy | ALCL | 52.6 | >10,000 | >10,000 | Wild Type | Wild Type |
| Ramos-RA1 | NHL | 94.5 | >10,000 | >10,000 | Wild Type | Wild Type | |
| Median | 29.0 | >10,000 | >10,000 | ||||
| Minimum | 71.5 | 36 | 200 | ||||
| Maximum | 27.2 | >10,000 | >10,000 |
Mutation status from COSMIC (http://www.sanger.ac.uk/genetics/CGP/cosmic/). Blank cells have unknown mutational status;
Has activating mutation in KIT (p.N822K).
Figure 1.

AZD6244 in vitro activity. Panel A is a dot plot chart that illustrates the relative sensitivity of the cell lines using the IC50 values displayed by histology. Panel B illustrates typical growth inhibition curves for Kasumi-1 and NB-EBc1. Error bars represent standard deviations for each concentration tested.
In vivo testing
AZD6244 was evaluated in 44 xenograft models and was well tolerated at the dose and schedule used for in vivo testing. Eleven of 842 mice died during the study (1.3%), with 0 of 420 in the control arms (0%) and 11 of 428 in the AZD6244 treatment arms (2.6%). One line (ALL-17) was excluded from analysis due to toxicity greater than 25 percent. A complete summary of results is provided in Supplemental Table I, including total numbers of mice, number of mice that died (or were otherwise excluded), numbers of mice with events and average times to event, tumor growth delay, as well as numbers of responses and T/C values.
AZD6244 induced significant differences in EFS distribution compared to controls in 10 of 43 evaluable xenografts (Table II). Significant differences in EFS distribution occurred in the majority of xenografts in the glioblastoma panel (3 of 4) and in one-half of the xenografts from the osteosarcoma panel (3 of 6), but in none of the evaluable xenografts in the Ewing, Wilms, medulloblastoma, and ALL panels. The in vivo testing results for the objective response measure of activity are presented in Figure 2 in a ‘heat-map’ format as well as a ‘COMPARE’-like format, based on the scoring criteria described in the Material and Methods and the Supplemental Response Definitions section. The latter analysis demonstrates relative tumor sensitivities around the midpoint score of 5 (stable disease). No objective responses (defined as ≥ 50% tumor volume regression) were observed in any of the models. The best responses observed were nine examples of PD2 (progressive disease with growth delay). These included 2 of 4 glioblastoma xenografts (BT-39 and D645) and 3 or 6 osteosarcoma xenografts (OS-1, OS-17, and OS-33). Examples of typical solid tumor response shown in Figure 3 for two osteosarcoma xenografts (OS-1 and OS-33) and one glioblastoma xenograft (BT-39) that met the criteria for intermediate activity (EFS T/C value > 2.0 and a significant difference in EFS distribution) for the time to event (EFS T/C) activity measure used by the PPTP. AZD6244 markedly reduced ERK phosphorylation in the responsive osteosarcoma xenograft OS-33, confirming the expected pharmacodynamic effect for AZD6244 at the dose employed for testing (Figure 4).
Table II.
Activity for AZD6244 against the PPTP in Vivo Panel
| Xenograft Line |
Histology | Kaplan- Meier Estimate of Median Time to Event |
P- value1 |
EFS T/C |
Median Final Relative Tumor Volume (RTV) |
Tumor Volume T/C |
P- Value2 |
T/C Volume Activity |
EFS Activity |
Response Activity |
|---|---|---|---|---|---|---|---|---|---|---|
| BT-29 | Rhabdoid | 18.7 | <0.001 | 1.8 | >4 | 0.43 | 0.005 | Int | Low | Int |
| KT-14 | Rhabdoid | 22.1 | 0.668 | 1.1 | >4 | 0.95 | 0.739 | Low | Low | Low |
| KT-12 | Rhabdoid | 17.3 | 0.104 | 1.4 | >4 | 0.86 | 0.447 | Low | Low | Low |
| KT-10 | Wilms | 9.6 | 0.759 | 1.2 | >4 | 0.96 | 0.971 | Low | Low | Low |
| KT-11 | Wilms | 10 | 0.229 | 1.2 | >4 | 0.73 | 0.258 | Low | Low | Low |
| KT-13 | Wilms | 9.6 | 0.582 | 1 | >4 | 0.93 | 0.965 | Low | Low | Low |
| SK-NEP-1 | Ewing | 6.6 | 0.368 | 1.3 | >4 | 0.75 | 0.218 | Low | Low | Low |
| EW5 | Ewing | 10.8 | 0.317 | 0.9 | >4 | 1.19 | 0.247 | Low | Low | Low |
| EW8 | Ewing | 9.8 | 0.246 | 1.1 | >4 | 0.95 | 0.684 | Low | Low | Low |
| TC-71 | Ewing | 8.6 | 0.166 | 1.2 | >4 | 0.83 | 0.353 | Low | Low | Low |
| CHLA258 | Ewing | 10.3 | 0.883 | 0.8 | >4 | 1.19 | 0.353 | Low | Low | Low |
| Rh28 | ALV RMS | 31.5 | 0.299 | 1.9 | >4 | 0.7 | 0.315 | Low | Low | Int |
| Rh30 | ALV RMS | 18.6 | 0.002 | 1.4 | >4 | 0.65 | 0.007 | Low | Low | Low |
| Rh30R | ALV RMS | 22.8 | 0.747 | 1 | >4 | 0.88 | 0.912 | Low | Low | Low |
| Rh65 | ALV RMS | 21.5 | 0.482 | 1 | >4 | 0.97 | 0.853 | Low | Low | Low |
| Rh18 | EMB RMS | 13 | 0.06 | 1.1 | >4 | 0.94 | 0.360 | Low | Low | Low |
| Rh36 | EMB RMS | 13.9 | 0.486 | 0.8 | >4 | 1.13 | 0.393 | Low | Low | Low |
| BT-28 | Medulloblastoma | 5.1 | 0.35 | 1 | >4 | 0.87 | 0.315 | Low | Low | Low |
| BT-45 | Medulloblastoma | 11.8 | 0.112 | 0.8 | >4 | 1.1 | 0.436 | Low | Low | Low |
| BT-46 | Medulloblastoma | 7 | 0.582 | 0.9 | >4 | 1.05 | 0.853 | Low | Low | Low |
| BT-44 | Ependymoma | 18.6 | 0.237 | 1 | >4 | 1.02 | 0.280 | Low | Low | Low |
| GBM2 | Glioblastoma | 11.1 | 0.139 | 1.2 | >4 | 0.87 | 0.353 | Low | Low | Low |
| BT-39 | Glioblastoma | > EP | <0.001 | > | 2.9 | 0.4 | <0.001 | Int | Int | Int |
| D645 | Glioblastoma | 19 | <0.001 | 1.9 | >4 | 0.38 | <0.001 | Int | Low | Int |
| D456 | Glioblastoma | 8.9 | 0.011 | 1.3 | >4 | 0.77 | 0.015 | Low | Low | Low |
| NB-SD | Neuroblastoma | 32.5 | 0.003 | 1.3 | >4 | 0.55 | 0.113 | Low | Low | Low |
| NB-1771 | Neuroblastoma | 34.3 | 0.996 | 1 | >4 | 0.85 | 0.182 | Low | Low | Low |
| NB-1691 | Neuroblastoma | 15.2 | 0.09 | 1.2 | >4 | 0.68 | 0.280 | Low | Low | Low |
| NB-EBc1 | Neuroblastoma | 11.4 | 0.916 | 1 | >4 | 0.86 | 0.863 | Low | Low | Low |
| CHLA-79 | Neuroblastoma | 15.8 | 0.302 | 1.2 | >4 | 0.61 | 0.165 | Low | Low | Low |
| NB-1643 | Neuroblastoma | 27.6 | 0.004 | 1.4 | >4 | 0.37 | 0.007 | Int | Low | Low |
| OS-1 | Osteosarcoma | > EP | <0.001 | > | 3.4 | 0.55 | <0.001 | Low | Int | Int |
| OS-2 | Osteosarcoma | 19.1 | 0.252 | 1.2 | >4 | 0.77 | 0.007 | Low | Low | Low |
| OS-17 | Osteosarcoma | 31 | 0.025 | 1.5 | >4 | 0.74 | 0.113 | Low | Low | Int |
| OS-9 | Osteosarcoma | 25.9 | 0.091 | 1.1 | >4 | 0.87 | 0.105 | Low | Low | Low |
| OS-33 | Osteosarcoma | 36.4 | <0.001 | 4.9 | >4 | 0.56 | <0.001 | Low | Int | Int |
| OS-31 | Osteosarcoma | 16.1 | 0.287 | 1.2 | >4 | 0.76 | 0.182 | Low | Low | Low |
| ALL-2 | ALL B-precursor | 10.6 | 0.01 | 0.8 | >25 | . | . | Low | Low | |
| ALL-3 | ALL B-precursor | 29.2 | 0.096 | 5.1 | >25 | . | . | Low | Int | |
| ALL-4 | ALL B-precursor | 4.1 | 0.225 | 0.9 | >25 | . | . | Low | Low | |
| ALL-7 | ALL B-precursor | 9.5 | 0.149 | 1.4 | >25 | . | . | Low | Low | |
| ALL-16 | ALL T-cell | 26.2 | 0.13 | 1.6 | >25 | . | . | Low | Low | |
| ALL-19 | ALL B-precursor | 4.2 | 0.208 | 4.2 | >25 | . | . | Low | Int |
P-value for EFS distribution for treated versus control;
P-value for tumor volume Tumor Volume T/C for treated versus control.
Figure 2.

AZD6244 in vivo objective response activity. Left: The colored ‘heat map’ depicts group response scores. A high level of activity is indicated by a score of 6 or more, intermediate activity by a score of ≥ 2 but < 6, and low activity by a score of < 2. Right: representation of tumor sensitivity based on the difference of individual tumor lines from the midpoint response (stable disease). Bars to the right of the median represent lines that are more sensitive, and to the left are tumor models that are less sensitive. Red bars indicate lines with a significant difference in EFS distribution between treatment and control groups, while blue bars indicate lines for which the EFS distributions were not significantly different.
Figure 3.

AZD6244 activity against individual solid tumor xenografts, Kaplan-Meier curves for EFS, median relative tumor volume graphs, and individual tumor volume graphs are shown for selected lines: (A) OS-1 (B) OS-33, and (C) BT-39. Mice received AZD6244 (100 mg/kg BID x 5 (Monday-Friday) and once daily (SID) (Saturday-Sunday) [abbreviated BID × 5/SID × 2] for six consecutive weeks
Figure 4.
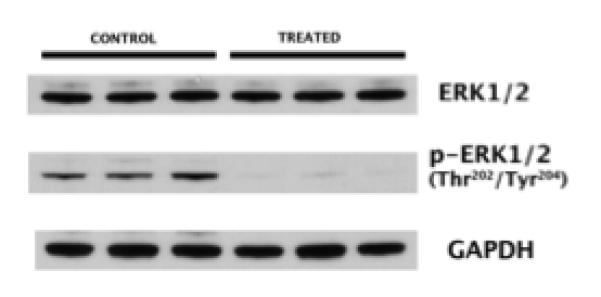
Pharmacodynamics of AZD6244, western blot analysis of OS-33 xenografts treated with either vehicle or AZD6244 at 100mg/kg BID for 5 days. Tumors were harvested 1 hour after the first dose on day 5.
The PPTP has established two models of JPA (BT-35 and BT-40) for use in secondary tumor panels. Both xenografts were evaluated for copy number alterations using Affymetrix SNP6.0 arrays. BT-35 and BT-40 showed no evidence for focal gain in the region of the BRAF gene, while BT-40 demonstrated gain of the entire long arm of chromosome 7 (Figure 5). These observations support absence of the KIAA1549/BRAF fusion in these xenografts. Fluorescence in situ hybridization (FISH) using probes for BRAF and for the chromosome 7 centromere showed equal numbers of these probes (Figure 6A), supporting the absence of focal BRAF duplication in the xenografts. By FISH analysis there were 5-8 copies of chromosome 7 in cells derived from BT-35 and 4-5 copies in cells derived from BT-40 tumors (Figure 6A). Sequencing showed that BRAF is wild type in BT-35, whereas BT-40 has a mutant (V600E) activating mutation (Figure 6B). AZD6244 was evaluated against these two models at 100 or 75 mg/kg (BID × 5 and once daily (SID) × 2) per week, or 100 mg/kg daily × 7 for 6 consecutive weeks (Supplemental Table 2). BT-35 xenografts were intrinsically resistant to AZD6244 (Figure 7A) whereas BT-40 xenografts were highly sensitive to each treatment schedule demonstrating CR at the end of treatment (6 weeks) Figure 7B. The delay in tumor re-growth, after stopping therapy, was related to the cumulative dose of AZD6244 received.
Figure 5.

Copy number analysis of BT-35 and BT-40 xenografts. Copy number analysis of BT-35 and BT-40 xenografts. Panel A. Ideograms of xenograft genomes. Genomic segments of at least 100 kb with copy gain (blue triangles) or loss (red triangles) for BT-35 (top) and BT-40 (bottom). Panel B. Copy number estimates for BT-35 (red squares) and BT-40 (blue squares) on chromosome 7 (top) and Hidden Markov model copy number states for the BRAF locus at 7q34 (bottom).
Figure 6.
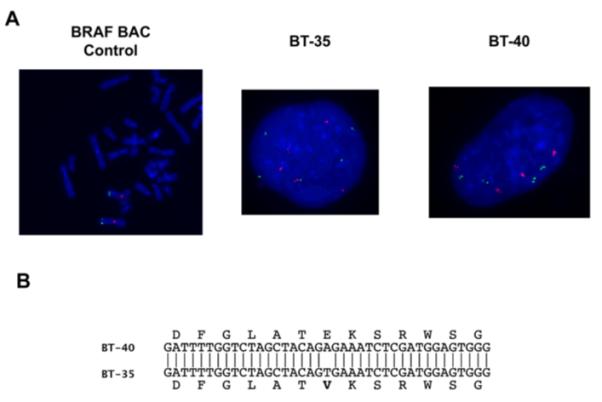
Chromosome 7 duplication and BRAF sequence analysis. Panel A. Fluorescence in situ hybridization (FISH). Centromeric probes (red) and BRAF probes (Green) for normal fibroblasts, BT-35 and BT-40 xenografts. Panel B. Sequence analysis for BRAF in BT-35 and BT-40 xenografts
Figure 7.

AZD6244 activity against pilocytic astrocytoma xenografts. Kaplan-Meier curves for EFS, median relative tumor volume graphs, and individual tumor volume graphs are shown for (A): BT-35 and (B) BT-40. Kaplan-Meier: Controls: black solid line; 100 mg/kg BID × 5/SID × 2 for six consecutive weeks: broken red line; 75 mg/kg BID × 5/SID × 2 for six consecutive weeks: blue broken line: 100 mg/kg SID for six consecutive weeks: broken pink line. Relative Tumor Volume curves: Controls: black solid line; 100 mg/kg BID × 5/SID × 2 for six consecutive weeks: solid brown line; 75 mg/kg BID × 5/SID × 2 for six consecutive weeks: solid blue line: 100 mg/kg SID for six consecutive weeks: solid red line. For individual growth curve plots: Upper left panel: Control; Upper right panel: AZD6244 100 mg/kg BID × 5/SID × 2 for six consecutive weeks; lower left panel: AZD6244 75 mg/kg BID × 5/SID × 2 for six consecutive weeks; Lower right panel100 mg/kg SID for six consecutive weeks
DISCUSSION
For the PPTP in vitro panel, 50% growth inhibition by AZD6244 was achieved in only 5 of 23 tumor lines. The most responsive cell line, Kasumi-1, has an activating KIT mutation [25], and its response to AZD6244 is similar to that previously described for selected BRAF and RAS mutant adult cancer cell lines [13,14]. Among the remaining PPTP cell lines, BRAF and RAS mutational status is known for 10 and 8 cell lines, respectively (Table 1). Mutations in BRAF were not observed. Two of 3 cell lines with activating RAS mutations achieved 50% growth inhibition, while only Kasumi-1 among the cell lines with known wild type RAS status achieved 50% growth inhibition.
AZD6244 demonstrated limited single agent in vivo activity against the PPTP’s childhood cancer models. The best response was progressive disease with significant tumor growth inhibition. Significant tumor growth inhibition was most consistently observed for the osteosarcoma (3 of 6) and glioblastoma (3 of 4) tumor panels.
Mutations in BRAF are associated with an increased sensitivity to MEK inhibition, while the response of cell lines with RAS gene mutations is more variable with both sensitivity and resistance observed [11,13,14]. BRAF mutations are uncommon in pediatric sarcomas [3], renal tumors [3], neuroblastoma [3,26], glioblastoma [27], and medulloblastoma [4], and are found in only 10% of childhood ALL [5]. This infrequency of BRAF mutation likely contributes to the relative insensitivity of most of the PPTP tumor lines to MEK1/2 inhibition. Pilocytic astrocytomas are reported to have MAPK pathway activation through BRAF activating mutations and through a tandem duplication that results in an in-frame fusion between the 5′ end of the KIAA1549 gene and the 3′ end of the BRAF gene producing an oncogenic fusion protein [9,28]. Two juvenile pilocytic astrocytoma xenografts have been established as secondary models within the PPTP. Neither line showed evidence for BRAF duplication, but direct sequencing of BRAF identified a well-characterized activating mutation (V600E) in BT-40 tumor tissue. The sensitivity of these tumors to treatment with AZD6244 was examined using two dose levels and schedules. BT-40 xenografts were sensitive to all treatments demonstrating a complete response at both dose levels on the BID schedule, but less sensitivity on the SID schedule. This result is consistent with a complete maintained response reported in a patient with this activating mutation in a melanoma [16]. In contrast, BT-35 xenografts were not sensitive to either dose/schedule of AZD6244 administration. Further dose-response testing (50 and 25 mg/kd BID) that may more readily simulate drug exposures achieved in the clinic using the hydrogen sulfate capsules [16] will be needed to determine whether tumor regressions for BT-40 occur at doses that produce drug exposures closer to those in the clinical setting.
The MEK1/2 inhibitor AZD6244, was not effective in inducing regressions as a single agent against most of the pediatric preclinical models evaluated. Both MEK1 mutations [29] or Ras effector signaling through PI3 kinase have been implicated in resistance to AZD6244 [29,30]. However, more recent data suggest a more complex mechanism by which cells are intrinsically resistant or sensitive to this agent, where expression of the compensatory-resistance expression signature appeared independent of PI3 kinase pathway activation [16]. AZD6244 may show greater benefit in combination with inhibitors of other signaling pathways (e.g., mTOR inhibitors) [31], where combined inhibition of mTOR and the Ras/MAPK pathways inhibited ribosome biogenesis and protein translation more effectively than either agent alone. Further, inhibition of MEK1 signaling appears to be the mechanism accounting for synergy between lapatinib and radiation [32] and AZD6244 was synergistic when combined with chemotherapeutic agents such as docetaxel [33]
The relative sensitivity of osteosarcoma and glioblastoma xenografts to AZD6244 suggests that preclinical combination testing in these histologic subsets may be worthwhile. The complete regressions induced by AZD6244 against a BRAF-mutant pilocytic astrocytoma xenograft are a strong activity signal that points to the potential utility of MEK inhibition for this tumor type.
Supplementary Material
ACKNOWLEDGEMENTS
This work was supported by NO1-CM-42216, CA21765, and CA108786 from the National Cancer Institute, and AZD6244 was provided by AstraZeneca. In addition to the authors, the manuscript represents work contributed by the following: Sherry Ansher, Joshua Courtright, Edward Favours, Henry S. Friedman, Debbie Payne-Turner, Charles Stopford, Mayamin Tajbakhsh, Chandra Tucker, Jianrong Wu, Joe Zeidner, Ellen Zhang, and Jian Zhang. Children’s Cancer Institute Australia for Medical Research is affiliated with the University of New South Wales and Sydney Children’s Hospital. We gratefully acknowledge the assistance of Marc Valentine, Cancer Center Core Cytogenetic Laboratory at St. Jude Children’s Research Hospital for FISH analysis.
Footnotes
Conflict of interest statement: The authors consider that there are no actual or perceived conflicts of interest.
Reference List
- 1.Davies H, Bignell GR, Cox C, et al. Mutations of the BRAF gene in human cancer. Nature. 2002;417(6892):949–954. doi: 10.1038/nature00766. [DOI] [PubMed] [Google Scholar]
- 2.Garnett MJ, Marais R. Guilty as charged: B-RAF is a human oncogene. Cancer Cell. 2004;6(4):313–319. doi: 10.1016/j.ccr.2004.09.022. [DOI] [PubMed] [Google Scholar]
- 3.Miao J, Kusafuka T, Fukuzawa M. Hotspot mutations of BRAF gene are not associated with pediatric solid neoplasms. Oncol Rep. 2004;12(6):1269–1272. [PubMed] [Google Scholar]
- 4.Gilbertson RJ, Langdon JA, Hollander A, et al. Mutational analysis of PDGFR-RAS/MAPK pathway activation in childhood medulloblastoma. Eur J Cancer. 2006;42(5):646–649. doi: 10.1016/j.ejca.2005.11.023. [DOI] [PubMed] [Google Scholar]
- 5.Gustafsson B, Angelini S, Sander B, et al. Mutations in the BRAF and N-ras genes in childhood acute lymphoblastic leukaemia. Leukemia. 2005;19(2):310–312. doi: 10.1038/sj.leu.2403589. [DOI] [PubMed] [Google Scholar]
- 6.Case M, Matheson E, Minto L, et al. Mutation of genes affecting the RAS pathway is common in childhood acute lymphoblastic leukemia. Cancer Res. 2008;68(16):6803–6809. doi: 10.1158/0008-5472.CAN-08-0101. [DOI] [PubMed] [Google Scholar]
- 7.Jones DT, Kocialkowski S, Liu L, et al. Tandem duplication producing a novel oncogenic BRAF fusion gene defines the majority of pilocytic astrocytomas. Cancer Res. 2008;68(21):8673–8677. doi: 10.1158/0008-5472.CAN-08-2097. [DOI] [PMC free article] [PubMed] [Google Scholar]
- 8.Jones DT, Kocialkowski S, Liu L, et al. Oncogenic RAF1 rearrangement and a novel BRAF mutation as alternatives to KIAA1549:BRAF fusion in activating the MAPK pathway in pilocytic astrocytoma. Oncogene. 2009 doi: 10.1038/onc.2009.73. [DOI] [PMC free article] [PubMed] [Google Scholar]
- 9.Pfister S, Janzarik WG, Remke M, et al. BRAF gene duplication constitutes a mechanism of MAPK pathway activation in low-grade astrocytomas. The Journal of clinical investigation. 2008;118(5):1739–1749. doi: 10.1172/JCI33656. [DOI] [PMC free article] [PubMed] [Google Scholar]
- 10.Forshew T, Tatevossian RG, Lawson AR, et al. Activation of the ERK/MAPK pathway: a signature genetic defect in posterior fossa pilocytic astrocytomas. J Pathol. 2009;218(2):172–181. doi: 10.1002/path.2558. [DOI] [PubMed] [Google Scholar]
- 11.Solit DB, Garraway LA, Pratilas CA, et al. BRAF mutation predicts sensitivity to MEK inhibition. Nature. 2006;439(7074):358–362. doi: 10.1038/nature04304. [DOI] [PMC free article] [PubMed] [Google Scholar]
- 12.Wan PT, Garnett MJ, Roe SM, et al. Mechanism of activation of the RAF-ERK signaling pathway by oncogenic mutations of B-RAF. Cell. 2004;116(6):855–867. doi: 10.1016/s0092-8674(04)00215-6. [DOI] [PubMed] [Google Scholar]
- 13.Davies BR, Logie A, McKay JS, et al. AZD6244 (ARRY-142886), a potent inhibitor of mitogen-activated protein kinase/extracellular signal-regulated kinase kinase 1/2 kinases: mechanism of action in vivo, pharmacokinetic/pharmacodynamic relationship, and potential for combination in preclinical models. Molecular cancer therapeutics. 2007;6(8):2209–2219. doi: 10.1158/1535-7163.MCT-07-0231. [DOI] [PubMed] [Google Scholar]
- 14.Yeh TC, Marsh V, Bernat BA, et al. Biological characterization of ARRY-142886 (AZD6244), a potent, highly selective mitogen-activated protein kinase kinase 1/2 inhibitor. Clin Cancer Res. 2007;13(5):1576–1583. doi: 10.1158/1078-0432.CCR-06-1150. [DOI] [PubMed] [Google Scholar]
- 15.Adjei AA, Cohen RB, Franklin W, et al. Phase I pharmacokinetic and pharmacodynamic study of the oral, small-molecule mitogen-activated protein kinase kinase 1/2 inhibitor AZD6244 (ARRY-142886) in patients with advanced cancers. J Clin Oncol. 2008;26(13):2139–2146. doi: 10.1200/JCO.2007.14.4956. [DOI] [PMC free article] [PubMed] [Google Scholar]
- 16.Banerji U, Camidge DR, Verheul HM, et al. The first-in-human study of the hydrogen sulfate (Hyd-sulfate) capsule of the MEK1/2 inhibitor AZD6244 (ARRY-142886): a phase I open-label multicenter trial in patients with advanced cancer. Clin Cancer Res. 16(5):1613–1623. doi: 10.1158/1078-0432.CCR-09-2483. [DOI] [PubMed] [Google Scholar]
- 17.Frgala T, Kalous O, Proffitt RT, et al. A fluorescence microplate cytotoxicity assay with a 4-log dynamic range that identifies synergistic drug combinations. Molecular cancer therapeutics. 2007;6(3):886–897. doi: 10.1158/1535-7163.MCT-04-0331. [DOI] [PubMed] [Google Scholar]
- 18.Houghton PJ, Morton CL, Kolb EA, et al. Initial testing (stage 1) of the proteasome inhibitor bortezomib by the pediatric preclinical testing program. Pediatr Blood Cancer. 2007 doi: 10.1002/pbc.21214. [DOI] [PubMed] [Google Scholar]
- 19.Friedman HS, Colvin OM, Skapek SX, et al. Experimental chemotherapy of human medulloblastoma cell lines and transplantable xenografts with bifunctional alkylating agents. Cancer research. 1988;48(15):4189–4195. [PubMed] [Google Scholar]
- 20.Graham C, Tucker C, Creech J, et al. Evaluation of the antitumor efficacy, pharmacokinetics, and pharmacodynamics of the histone deacetylase inhibitor depsipeptide in childhood cancer models in vivo. Clin Cancer Res. 2006;12(1):223–234. doi: 10.1158/1078-0432.CCR-05-1225. [DOI] [PubMed] [Google Scholar]
- 21.Peterson JK, Tucker C, Favours E, et al. In vivo evaluation of ixabepilone (BMS247550), a novel epothilone B derivative, against pediatric cancer models. Clin Cancer Res. 2005;11(19 Pt 1):6950–6958. doi: 10.1158/1078-0432.CCR-05-0740. [DOI] [PubMed] [Google Scholar]
- 22.Liem NL, Papa RA, Milross CG, et al. Characterization of childhood acute lymphoblastic leukemia xenograft models for the preclinical evaluation of new therapies. Blood. 2004;103(10):3905–3914. doi: 10.1182/blood-2003-08-2911. [DOI] [PubMed] [Google Scholar]
- 23.Houghton PJ, Morton CL, Tucker C, et al. The pediatric preclinical testing program: Description of models and early testing results. Pediatr Blood Cancer. 2006 doi: 10.1002/pbc.21078. [DOI] [PubMed] [Google Scholar]
- 24.Kurmasheva RT, Harwood FC, Houghton PJ. Differential regulation of vascular endothelial growth factor by Akt and mammalian target of rapamycin inhibitors in cell lines derived from childhood solid tumors. Mol Cancer Ther. 2007;6(5):1620–1628. doi: 10.1158/1535-7163.MCT-06-0646. [DOI] [PubMed] [Google Scholar]
- 25.Beghini A, Magnani I, Ripamonti CB, et al. Amplification of a novel c-Kit activating mutation Asn(822)-Lys in the Kasumi-1 cell line: a t(8;21)-Kit mutant model for acute myeloid leukemia. Hematol J. 2002;3(3):157–163. doi: 10.1038/sj.thj.6200168. [DOI] [PubMed] [Google Scholar]
- 26.Dam V, Morgan BT, Mazanek P, et al. Mutations in PIK3CA are infrequent in neuroblastoma. BMC cancer. 2006;6:177. doi: 10.1186/1471-2407-6-177. [DOI] [PMC free article] [PubMed] [Google Scholar]
- 27.Knobbe CB, Reifenberger J, Reifenberger G. Mutation analysis of the Ras pathway genes NRAS, HRAS, KRAS and BRAF in glioblastomas. Acta Neuropathol. 2004;108(6):467–470. doi: 10.1007/s00401-004-0929-9. [DOI] [PubMed] [Google Scholar]
- 28.Jones DT, Kocialkowski S, Liu L, et al. A novel oncogenic fusion gene is found in the majority of pilocytic astrocytomas. Proceedings of the 99th Annual Meeting of the American Association for Cancer Research; 2008. [DOI] [PMC free article] [PubMed] [Google Scholar]
- 29.Emery CM, Vijayendran KG, Zipser MC, et al. MEK1 mutations confer resistance to MEK and B-RAF inhibition. Proc Natl Acad Sci U S A. 2009;106(48):20411–20416. doi: 10.1073/pnas.0905833106. [DOI] [PMC free article] [PubMed] [Google Scholar]
- 30.Wee S, Jagani Z, Xiang KX, et al. PI3K pathway activation mediates resistance to MEK inhibitors in KRAS mutant cancers. Cancer Res. 2009;69(10):4286–4293. doi: 10.1158/0008-5472.CAN-08-4765. [DOI] [PubMed] [Google Scholar]
- 31.Legrier ME, Yang CP, Yan HG, et al. Targeting protein translation in human non small cell lung cancer via combined MEK and mammalian target of rapamycin suppression. Cancer research. 2007;67(23):11300–11308. doi: 10.1158/0008-5472.CAN-07-0702. [DOI] [PubMed] [Google Scholar]
- 32.Sambade MJ, Camp JT, Kimple RJ, et al. Mechanism of lapatinib-mediated radiosensitization of breast cancer cells is primarily by inhibition of the Raf>MEK>ERK mitogen-activated protein kinase cascade and radiosensitization of lapatinib-resistant cells restored by direct inhibition of MEK. Radiother Oncol. 2009;93(3):639–644. doi: 10.1016/j.radonc.2009.09.006. [DOI] [PMC free article] [PubMed] [Google Scholar]
- 33.Haass NK, Sproesser K, Nguyen TK, et al. The mitogen-activated protein/extracellular signal-regulated kinase kinase inhibitor AZD6244 (ARRY-142886) induces growth arrest in melanoma cells and tumor regression when combined with docetaxel. Clin Cancer Res. 2008;14(1):230–239. doi: 10.1158/1078-0432.CCR-07-1440. [DOI] [PubMed] [Google Scholar]
Associated Data
This section collects any data citations, data availability statements, or supplementary materials included in this article.