

Abstract
Recent studies show that glutamate and orexin (ORX, also known as hypocretin) inputs to the ventral tegmental area (VTA) dopamine (DA) cell region are essential for conditioned behavioral responses to reward-associated stimuli. In vitro experiments showed that ORX inputs to VTA potentiate responses of DA neurons to glutamate inputs, but it has remained unclear which glutamate inputs are modulated by ORX. The medial prefrontal cortex (mPFC) is a good candidate, given its role in processing complex stimulus–response information and its reciprocal connections with VTA DA neurons. Here we used in vivo recordings in anesthetized rats to investigate the responses of VTA DA neurons to mPFC stimulation, and how these responses are modulated by ORX. We demonstrate that mPFC stimulation evokes short- and long-latency excitation and inhibition in DA neurons. Maximal short-latency excitatory responses originated from stimulation sites in ventral prelimbic/infralimbic cortex, and were significantly more frequent during the active than during the rest period of the diurnal cycle. Application of ORX onto VTA DA neurons increased baseline activity and augmented or revealed excitatory responses to mPFC stimulation independent of changes in baseline activity, and without consistently affecting inhibitory responses. Moreover, orexin-1 receptor antagonism decreased tonic DA cell activity in active- but not rest-period animals, confirming a diurnal influence of ORX. These results indicate that ORX potently influences DA neuron activity, in part by modulating responses to mPFC inputs. By regulating prefrontal control of DA release, ORX projections to VTA may shape motivated behaviors in response to conditioned stimuli.
Introduction
Dopamine (DA) neurons in ventral tegmental area (VTA) are important for reward-driven behavior (Wise, 2004). Rewards or reward-predicting stimuli activate DA neurons (Pan et al., 2005; Roesch et al., 2007; Schultz, 2007), and elevate DA in nucleus accumbens and prefrontal cortex (Phillips et al., 2008; Wheeler and Carelli, 2009). Glutamate release in VTA controls DA neuron activity and DA release in VTA targets (Mereu et al., 1991; Johnson and North, 1992; Overton and Clark, 1997; Georges and Aston-Jones, 2002; Grace et al., 2007; Geisler and Wise, 2008). Glutamate transmission and plasticity in VTA are essential for reward-driven behaviors, including drug seeking (Harris and Aston-Jones, 2003; Saal et al., 2003; Harris et al., 2004; Sun et al., 2005; Kauer and Malenka, 2007; You et al., 2007).
The medial prefrontal cortex (mPFC) provides direct glutamate innervation of DA and GABA neurons in VTA (Sesack et al., 1989, 2003; Sesack and Pickel, 1992; Carr and Sesack, 2000; Geisler et al., 2007). mPFC stimulation releases glutamate in VTA, activates VTA neurons (Gariano and Groves, 1988; Murase et al., 1993; Tong et al., 1996; Rossetti et al., 1998; Massi et al., 2008), and releases DA (Taber et al., 1995; Karreman and Moghaddam, 1996; You et al., 1998). Previous studies revealed predominantly long-latency (>100 ms) responses of VTA DA neurons to PFC stimulation, leading to the view that PFC influence on VTA was primarily indirect (Gariano and Groves, 1988; Tong et al., 1996). However, the prominent mPFC projection directly to the VTA (Geisler et al., 2007) prompted us to reinvestigate this relationship.
The orexin/hypocretin (ORX) system also has been implicated in reward behaviors (Aston-Jones et al., 2010), in addition to its role in arousal (Sutcliffe and de Lecea, 2002; Sakurai, 2007). The ORX projection from lateral hypothalamus (LH) to VTA is important for seeking both natural and drug rewards (Harris et al., 2005; Narita et al., 2006; Harris et al., 2007; Zheng et al., 2007; España et al., 2010). VTA DA neurons are activated by ORX in vitro (Korotkova et al., 2003) and in vivo (Muschamp et al., 2007; Vittoz et al., 2008), and ORX intracerebroventricularly or in VTA increases DA release in PFC and NAc (Narita et al., 2006; Vittoz and Berridge, 2006).
ORX has strong interactions with glutamate in VTA. Borgland et al. (2006) showed that cocaine-induced plasticity in VTA DA neurons depends upon ORX inputs and that ORX administration to midbrain slices produced a late-phase glutamate-dependent long-term potentiation in DA neurons. Additional work found that ORX increased presynaptic glutamate release onto VTA DA neurons in slices from rats that self-administered salient rewards such as high-fat food or cocaine (Borgland et al., 2009). These in vitro studies did not specify which glutamatergic afferents ORX interacts with to facilitate DA neuron activity. Here we used extracellular recordings in anesthetized rats to investigate the hypothesis that ORX acts, at least in part, on mPFC projections to VTA DA neurons, with the goal of providing a framework for better understanding the circuitry involved in reward-seeking behaviors.
Materials and Methods
Animals.
Male Sprague Dawley rats (∼300–400 g; Charles River; n = 101) were used in these experiments. Rats were pair-housed under temperature- and humidity-controlled conditions and allowed ad libitum access to commercial chow and tap water. Rats recorded during the dark phase were housed in a reverse-cycle environment (lights off from 9:00 A.M. to 9:00 P.M.). Rats recorded during the light (rest) phase were housed in a regular-cycle environment (lights on from 7:00 A.M. to 7:00 P.M.). Recordings typically lasted ∼6 h and were performed within the 12 h temporal confines of each respective diurnal phase. As in previous studies (Luo et al., 2008), for recordings during the dark phase, animals were transferred from their housing cages to a darkened surgical area in covered transfer cages. Following the induction of anesthesia, black electrical tape was placed over the animals' eyes to ensure they were not exposed to photic input once room lights were reilluminated, and their eyes remained occluded in this way throughout surgery and the remainder of the experiment. All protocols and procedures followed National Institute of Health guidelines for the care and use of laboratory animals, and were approved by the Medical University of South Carolina Institutional Animal Care and Use Committee.
Surgery.
Animals were initially anesthetized with isoflurane in a closed container, and then with 2.5% isoflurane in air delivered through a face mask. A tracheotomy was performed and 2.0–2.5% isoflurane was delivered through a tracheal cannula via spontaneous respiration for surgical procedures. Animals were placed in a stereotaxic frame, and body temperature was maintained at ∼37°C using a thermistor-controlled electric heating pad. All incision points were infiltrated with a long-lasting anesthetic (2% lidocaine). The skull was exposed, and holes were drilled above the mPFC (2.7–3.4 mm rostral and 0.4–0.8 mm lateral to bregma) and the VTA (window: 5.1–6.3 mm caudal and 0.5–1.0 lateral to bregma). Some VTA windows were located 2 mm lateral to midline, and recording pipettes were angled 10° from vertical.
Electrical stimulation of mPFC.
Stimulation of mPFC was conducted with a bipolar concentric electrode (250 μm in diameter overall; 50 μm diameter for inner electrode, which extended 100 μm beyond the outer electrode; FHC). This electrode was inserted into mPFC [target location: prelimbic (PL)/infralimbic (IL) interface: 4.5 DV from skull surface]. Electrical stimulation (0.5, 1.0, and 1.5 mA, 0.5 Hz, 0.5 ms duration pulses) was administered using the output of a CED 1401 Plus computer interface under control of Spike2 software (Cambridge Electronic Design) and a stimulus isolator (ISO-Flex, A.M.P.I., Alomone Labs).
Ventral tegmental area recordings and microinfusion of orexin-A and SB 334867.
During recording experiments, the concentration of isoflurane was kept at 1.0–1.5%. A double-barrel pipette assembly similar to that described previously (Akaoka and Aston-Jones, 1991; Georges and Aston-Jones, 2002) was used for recording VTA spike activity with simultaneous local microinjection of drugs. The recording micropipette (tip diameter, 1–3 μm; 10–30 MΩ) was filled with a 1.5% biotinamide (Invitrogen) solution in 0.5 m sodium acetate. The injection pipette (tip ∼40–60 μm in diameter, offset ∼100 μm behind recording pipette tip) was filled with orexin-A [ORX-A; Tocris Bioscience; 1–100 μm in artificial CSF (ACSF), most commonly 1.4 μm], the orexin 1 receptor (ORX1R) antagonist SB 334867 (SB; generously donated by Eli Lilly; 100 μm in ACSF), or ACSF. The double-barrel assembly was lowered into VTA, and DA neurons were identified according to well established electrophysiological criteria (Guyenet and Aghajanian, 1978; Grace and Bunney, 1983, 1984; Tepper et al., 1984; Chiodo, 1988; Ungless et al., 2004). These included (1) action potential with biphasic or triphasic waveform >2.5 ms in duration, (2) >1.1 ms from spike onset to negative trough, and (3) slow spontaneous firing rate [<12 spikes/second (sp/s)]. Note that 12 sp/s was used as a criterion rather than the more commonly used 10 sp/s, as a small number (nine) of otherwise DA-like neurons exhibited baseline firing rates between 10 and 12 sp/s. Neurons firing at rates above 12 sp/s had clearly non-DAergic waveforms and fired at rates of 20 sp/s and higher. Signals were amplified and filtered (0.03–5 kHz or 0.1–5 kHz bandpass, see below) using a Model 1600 Neuroprobe Amplifier (A-M Systems), a BMA 200 Portable Bioamplifier (CWE), and additional custom-designed filtering electronics. Examples of DA neuron waveforms are shown in Figure 1 and in histograms for each of the presented neurons. Spikes of single neurons were discriminated and digital pulses were sent to a computer for online data collection using a laboratory interface and software (CED 1401 Plus, Spike2; Cambridge Electronic Design).
Figure 1.

Dopamine neuron recording and labeling. A–C, Action potential waveforms (A, B) and spontaneous activity (C) of a DA neuron. Dopamine neurons were high-pass filtered at either 100 Hz (A) or 30 Hz (B, C). D, This neuron was juxtacellularly labeled with biotinamide (upper panel, at arrow) and stained with tyrosine hydroxylase (middle panel; lower panel is merged images), demonstrating that it was dopaminergic. Arrows show the juxtacellularly labeled DA neuron. Arrowheads show another DA neuron not labeled with biotinamide.
Because the waveforms of extracellularly recorded DA neuron action potentials vary with filter settings (Grace et al., 2007), for 136 neurons we recorded a second channel with the high-pass filter at 30 Hz (Fig. 1). This filter setting did not substantially change the overall width of spike waveforms. In addition, for cells firing at low spontaneous rates, a strong relationship was found between spike onset to negative trough duration and DAergic phenotype in studies by others (Ungless et al., 2004; Brischoux et al., 2009) as well as from our laboratory (Luo et al., 2008). Therefore, for cells that were not juxtacellularly labeled (see below), we used those criteria to identify putative DA neurons. Although some DA neurons may be excluded with this approach (Ungless et al., 2004; Grace et al., 2007), these criteria have the advantage of decreasing the probability that non-DA neurons were included in our DA cell population. Our studies focused on putative DA neurons; apparent GABA-like neurons (thin spikes with fast firing rates) were not examined in detail and omitted from analyses.
After isolating a single neuron, we recorded spontaneous activity for at least 2 min before stimulation tests. Subsequently, 50 single electrical pulses were delivered to the mPFC at a rate of 0.5/s, and DA neuron responses were recorded (preinfusion test). When possible, all three levels of stimulation intensity (0.5, 1.0, and 1.5 mA) were tested. At least 1 min after stimulation, ORX-A, SB, or ACSF was microinfused via pneumatic pressure (Picospritzer, General Valve) at a rate of 60 nl/min for 1 min and effects on spontaneous activity were recorded. At least 5 min after the end of infusion, a second round of mPFC stimulation was performed and DA neuron responses were recorded (postinfusion test). This was to test long-lasting effects of ORX on mPFC-mediated responses. At least 1 min after that stimulation, ORX-A or SB was applied (60 nl/min) during mPFC stimulation, and DA neuron responses were recorded (stim+infusion test). If possible, 5 min after infusion/stimulation, a final round of stimulation was performed and DA neuron responses were recorded (post-stim+infusion test). This last test was to measure possible long-lasting plasticity in PFC responses of VTA DA neurons elicited by ORX-A administration during PFC stimulation. In some cases, a subset of manipulations (e.g., only postinfusion or stim+infusion) were performed for an individual neuron.
Juxtacellular labeling.
For juxtacellular labeling, current pulses (50% duty cycle, 250 ms, 0.5–10 nA) were applied through the biotinamide-filled recording electrode to entrain the impulse activity of a well isolated single neuron, as described in previous publications (Pinault, 1996; Schreihofer and Guyenet, 1997; Luo et al., 2008). Entraining stimulation typically continued for 1–5 min.
Histology and immunochemistry.
At the end of recording sessions, mPFC stimulation sites were marked by passing 10–20 μA of positive current through the stimulating electrode for 1–2 min to create a small lesion. Because recording electrodes were typically filled with biotinamide to attempt juxtacellular labeling, recording pipettes were removed and replaced with a pipette filled with a solution of 2% pontamine sky blue (BDH Chemicals) in 0.5 m sodium acetate for marking recording sites. This pipette was positioned ∼3–4 mm dorsal to the location of a successfully entrained neuron or, in the event that no neurons were entrained, at the location in VTA where most mPFC-responsive DA neurons were found. VTA recording locations were marked by iontophoretic deposit of pontamine sky blue (−7 μA, alternating current for 12–15 min). We selected for anatomical analysis a subset of 67 neurons from which we were able to reliably confirm that the blue spot was well aligned with recording tracks and accurately positioned in the VTA. Also included in this subset were recordings from eight juxtacellularly labeled DA neurons.
After marking electrode sites, animals were perfused with cold 0.09% NaCl followed by cold 4% paraformaldehyde in 0.1 m phosphate buffer (PB). Brains were postfixed overnight in 4% paraformaldehyde and transferred to a 20% solution of sucrose/0.1% sodium azide (Az) in PB at 4°C for at least 3 d. Coronal 40-μm-thick sections of brains were cut on a cryostat. Prefrontal sections and sections of VTA without juxtacellular labeling were transferred to slides, counterstained with neutral red (Fisher), dehydrated with graded alcohol solutions, cleared with xylene, and coverslipped with Permount (Fisher). Sections of VTA containing potentially juxtacellularly labeled neurons were incubated in 0.03% hydrogen peroxide/PBS for 15 min, followed by incubation in polyclonal mouse antibody to TH (1:1000; ImmunoStar) in 2% normal donkey serum/PBS (with 0.3% Triton X-100: PBST)-Az overnight. Sections were then incubated in a Streptavidin Alexa Fluor 488 nm- (1:400; Invitrogen) and an Alexa Fluor 594 nm-conjugated goat anti-mouse antibody (1:500; Invitrogen)/2% normal donkey serum/PBST for 2 h. Between incubations, sections were rinsed three times, 5 min each, in PBS or PBST. All incubations and rinses were performed at room temperature. Sections were mounted onto coated slides with Slowfade anti-fade mounting solution (Invitrogen). Sections were examined with a Leica DM-RXA microscope (Leica Microsystems). Photomicrographs were acquired with a CCD camera (Princeton Instruments) and processed using Openlab imaging software (Improvision). An example of a juxtacellularly labeled neuron is shown in Figure 1.
Data analysis.
Spontaneous activity and ORX- or SB-evoked responses were analyzed by calculating firing rate and proportions of spikes that occurred in bursts. The onset of a burst was defined as the occurrence of two spikes with an interspike interval <80 ms (Grace and Bunney, 1983). The percentage of spikes in bursts was calculated by dividing the number of spikes occurring in bursts by the total number of spikes occurring in the same period of time. Changes in firing rate evoked by local ORX-A or SB application were measured by comparing the mean firing rate 1 min preinfusion to the mean firing rate 1 min after infusion. During electrical stimulation of mPFC, cumulative peristimulus time histograms (PSTHs, 5 ms bin width) of VTA activity were generated for each recorded neuron. PSTHs were analyzed to determine excitatory and inhibitory epochs as described previously (Jodo et al., 1998; Georges and Aston-Jones, 2002). The mean and SD of counts per bin were determined for a baseline period (500 ms epoch preceding stimulation). The onset of significant excitation was defined as the first of five bins for which the mean value exceeded mean baseline activity by 2 SD, and response offset was determined as the time at which activity had returned to be consistently within 2 SD of baseline. Excitatory and inhibitory response magnitudes (Rmags) were normalized for different levels of baseline impulse activity, allowing for comparison of drug effects on evoked responses independent of effects on baseline activity. Rmags for excitation were calculated with the following equation: Excitation Rmag = (counts in excitatory epoch) − (mean counts per baseline bin × number of bins in excitatory epoch). Significant inhibition was defined as an epoch of at least 15 bins in which the mean count per bin was at least 35% less than that during baseline. Response magnitude for inhibition was calculated as follows: Inhibition Rmag = (counts in inhibitory epoch) − (mean counts per baseline bin × number of bins in inhibitory epoch). Antidromic activation was characterized as previously described (Georges and Aston-Jones, 2002), primarily through the presence of (1) a constant latency (varying by <1 ms) and a consistent evoked single-spike response, (2) driving by each of a pair of stimulus pulses at frequencies of 100 Hz or greater, and (3) collision of driven spikes by spontaneous impulses.
To test the influence of ORX-A or SB on evoked responses, the following analyses were performed. First, responses were sorted into preinfusion, postinfusion, stim+infusion, and post-stim+infusion (following the protocol described above). We next identified which neurons exhibited significant excitatory responses, either short- or long-latency, using the analysis methods described above. We then quantified numbers of neurons significantly excited or inhibited by mPFC stimulation at the different times with respect to ORX or SB infusion as described above. Comparisons were only made for cases in which stimulation intensities were matched across conditions. When multiple stimulation intensities were tested (e.g., 0.5 mA, 1 mA, 1.5 mA), effects were typically consistent across intensities. If different effects were observed across intensities (e.g., excitation at 0.5 mA and 1 mA, but not at 1.5 mA), the lowest intensity to produce a significant response preinfusion was compared to the same stimulation intensity in the postinfusion, stim+infusion, or post-stim+infusion condition. In the event that significant evoked responses were observed in both conditions, Rmags were calculated (as described above), and neurons were classified based on Rmag values (e.g., higher Rmag after infusion than before infusion denotes a response enhancement).
Results are expressed as mean ± SEM. ANOVAs and t tests or nonparametric equivalents were performed based on assessment of normal distribution of the data. Differences in counts of significant effects across neurons were measured with Fisher's exact test or χ2 analyses. All measurements and analyses were performed in Spike2 (Cambridge Electronic Design), Matlab (MathWorks), SPSS (IBM), or Excel (Microsoft).
Results
Neural populations studied
We recorded the activity of 305 VTA neurons with wide spikes (>2.5 ms) during the active periods of 82 rats. Of these neurons, 260 were classified as putative DA neurons based on not only having a wide total action potential waveform, but also a wide initial action potential component (Ungless et al., 2004), and baseline firing rates <12 sp/s (see Materials and Methods), meeting previous criteria for DA neurons (Grace and Bunney, 1983). The other 45/305 neurons were tentatively classified as non-DA neurons based on having an initial action potential component <1.1 ms, although in all cases the total action potential waveform was >2.5 ms and in 39/44 cases firing rate was <12 sp/s.
We also recorded the activity of 100 VTA neurons during the rest periods of 19 rats. Of these, 88 were classified as putative DA neurons. The other 12 neurons were classified as non-DA based on waveform initial component widths being <1.1 ms, although all 12 showed total spike waveforms >2.5 ms and 11/12 exhibited baseline firing rates <12 sp/s.
For 136 neurons (active and rest period), we recorded an additional channel of data with a wide high-pass filter setting (30 Hz as opposed to 100 Hz) (see Fig. 1 for sample waveforms). All of these neurons exhibited total waveforms >2.5 ms with wide filter settings, and therefore might have been considered DA cells (Grace and Bunney, 1983). However, 22 of these 136 neurons were classified as non-DA neurons because the duration of their initial waveforms to negative trough was <1.1 ms (see Materials and Methods) (Ungless et al., 2004).
We attempted to juxtacellularly label 29 neurons following mPFC stimulation tests described above. Of these, nine were unambiguously labeled and identified in processed tissue. Weakly labeled cells or cells with suboptimal recordings (e.g., those lost during juxtacellular labeling) were disregarded to be certain about neuronal phenotypes. Of the nine labeled neurons, eight were immunohistochemically identified as TH+ (see Fig. 1 for example) and one was identified as TH−. All eight TH+ neurons met electrophysiologic criteria for DA neurons (as above). Six and two of the eight DA neurons were recorded in active-period and rest-period animals, respectively. The waveform of the TH− neuron was thin (<2.5 ms total and <1.1 ms initial component), characterizing it as a putative non-DA neuron during recordings. Although the number of juxtacellularly labeled neurons is small compared to the overall population of recorded neurons, the fact that all neurons tentatively identified as DAergic were TH+ indicates that our criteria for identifying DA neurons during recordings were largely accurate. Therefore, we refer to all neurons meeting these criteria as DA neurons for ease of communication. However, because we did not label all neurons that we recorded, and because identification of DA neurons in extracellular recordings is uncertain (Ungless et al., 2004; Margolis et al., 2006; Brischoux et al., 2009), they should be considered putative DA neurons.
Prefrontal stimulation evoked short- and long-latency excitatory and inhibitory responses in VTA neurons
We recorded mPFC-evoked responses of 236 DA neurons and 44 non-DA neurons from 66 active-period rats during electrical stimulation of mPFC, focusing stimulation sites on the border of PL/IL cortex. Examples of neuronal recording and juxtacellular labeling are shown in Figure 1. Such prefrontal stimulation frequently evoked both excitatory and inhibitory responses in VTA neurons. Table 1 shows all responses of DA and non-DA neurons to mPFC stimulation. Note that Table 1 shows any response following stimulation, and does not classify each neuron as exclusively excited or inhibited (for example, neurons could exhibit evoked excitation and inhibition at different time points or at different stimulation intensities). As such, the total number of responses in Table 1 is greater than the number of neurons recorded. A comprehensive description of evoked response profiles for individual neurons is shown in Table 2(described below). As shown in Table 1, ∼61% of recorded DA neurons were excited by mPFC stimulation. In addition to the previously reported long-latency mPFC evoked responses ≥50 ms in latency (Tong et al., 1996), we also found a large number of evoked responses <50 ms in latency. In fact, about two-thirds of the excited neurons in our sample exhibited latencies <50 ms (Table 1). For convenience, we refer to <50 ms as short latency and ≥50 ms as long latency. Examples of neurons exhibiting short-latency and long-latency excitatory responses are shown in Figure 2. Short-latency-onset evoked responses appeared to cluster into two distributions: <25 ms and 25–50 ms (Fig. 2). We hypothesize that these two clusters may represent predominantly monosynaptic and polysynaptic projections from mPFC to VTA (see Discussion). Similar effects were observed in a smaller number of non-DA neurons recorded (Table 1). Thirteen DA and two non-DA neurons were antidromically activated (as defined in Materials and Methods), and these neurons were excluded from analyses.
Table 1.
mPFC-evoked responses in VTA dopamine and nondopamine neurons recorded during the active period
| Dopamine |
Nondopamine |
|||
|---|---|---|---|---|
| Number | Percentage | Number | Percentage | |
| Recorded | 236 | N/A | 44 | N/A |
| Excited | 143 | 60.6% | 22 | 50% |
| Short latency | 69 | 29.2% | 14 | 31.8% |
| Long latency | 49 | 20.8% | 5 | 11.4% |
| Short + long latency | 25 | 10.6% | 3 | 6.8% |
| Inhibited | 175 | 74.2% | 32 | 72.7% |
| Short latency | 39 | 16.5% | 13 | 29.5% |
| Long latency | 105 | 44.5% | 9 | 20.5% |
| Short + long latency | 31 | 13.1% | 10 | 22.7% |
| Unresponsive | 37 | 15.7% | 8 | 18.2% |
Neurons are subdivided into groups characterized by the type of excitatory or inhibitory responses they exhibited (see text for definitions). Percentages are of total number of neurons recorded. Note that some neurons exhibited both excitatory and inhibitory responses, in which case they were counted in both categories. Specific neuronal responses are categorized in Table 2.
Table 2.
Relationship between excitatory and inhibitory mPFC-evoked responses in VTA dopamine and nondopamine neurons recorded during the active period
| Dopamine |
Nondopamine |
|||
|---|---|---|---|---|
| Number | Percentage | Number | Percentage | |
| SLE-all | 55 | 27.6% | 12 | 31.6% |
| SLE followed by Inh | 38 | 19.1% | 7 | 18.4% |
| SLI-all | 27 | 13.6% | 10 | 26.3% |
| SLI followed by Exc | 7 | 3.5% | 1 | 2.6% |
| LLE-all | 12 | 6.0% | 0 | 0.0% |
| LLE followed by Inh | 5 | 2.5% | 0 | 0.0% |
| LLI-all | 43 | 21.6% | 5 | 13.2% |
| LLI followed by Exc | 13 | 6.5% | 1 | 2.6% |
These neurons are a subset of the 199 and 38 mPFC-responsive DA and non-DA neurons, respectively, that showed consistent response patterns across multiple stimulation intensities (DA n = 137, non-DA n = 27). Note that the neurons in the “followed by” categories are included in the corresponding “all” categories. Percentages are based on total responsive neurons (199 or 38). Additional neurons (described in text) responded differentially depending on stimulation intensity.
Figure 2.
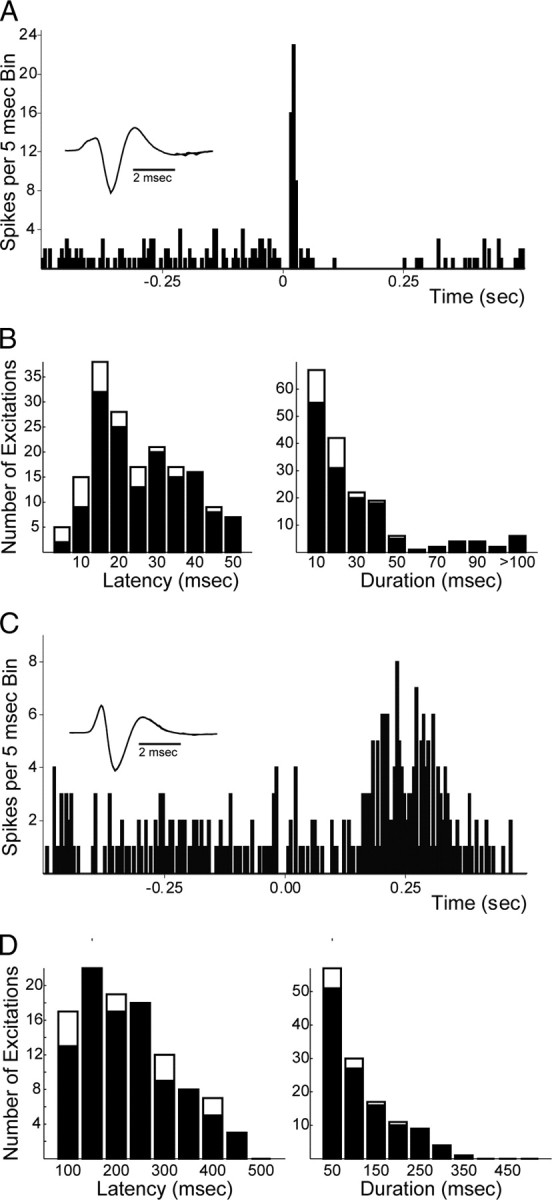
mPFC-evoked excitations in dopamine neurons. A, Example of short-latency excitatory response of a DA neuron evoked by mPFC stimulation (50 pulses, 0.5 Hz). Stimulation occurs at time 0. B, Distributions of latencies (left) and durations (right) of short-latency evoked responses for DA neurons (filled) and non-DA neurons (open) after mPFC stimulation. Abscissa values represent highest value in each bin (e.g., the first bin is 0–5 ms, etc.). Note the apparently bimodal distribution of latencies indicating possible separate monosynaptic and bisynaptic/polysynaptic connections. C, Example of long-latency excitatory responses of a second DA neuron evoked by mPFC stimulation (parameters as in A). D, Distributions of latencies (left) and durations (right) of long-latency evoked responses for DA neurons (filled) and non-DA neurons (open) after mPFC stimulation. Data presented from 143 DA and 22 non-DA neurons from 64 rats. See Materials and Methods for calculation of activation onset latencies and durations. Insets show waveforms of recorded neurons (high-pass filter = 100 Hz).
A large number of DA and non-DA neurons were inhibited by mPFC stimulation (Table 1). Examples of inhibitory responses and the distribution of evoked inhibitory latencies are shown in Figure 3. Note that the latencies for the majority of evoked inhibitions were ≥25 ms. Because there are no known monosynaptic inhibitory projections from mPFC to VTA, we conclude that inhibitory responses represent polysynaptic projections.
Figure 3.
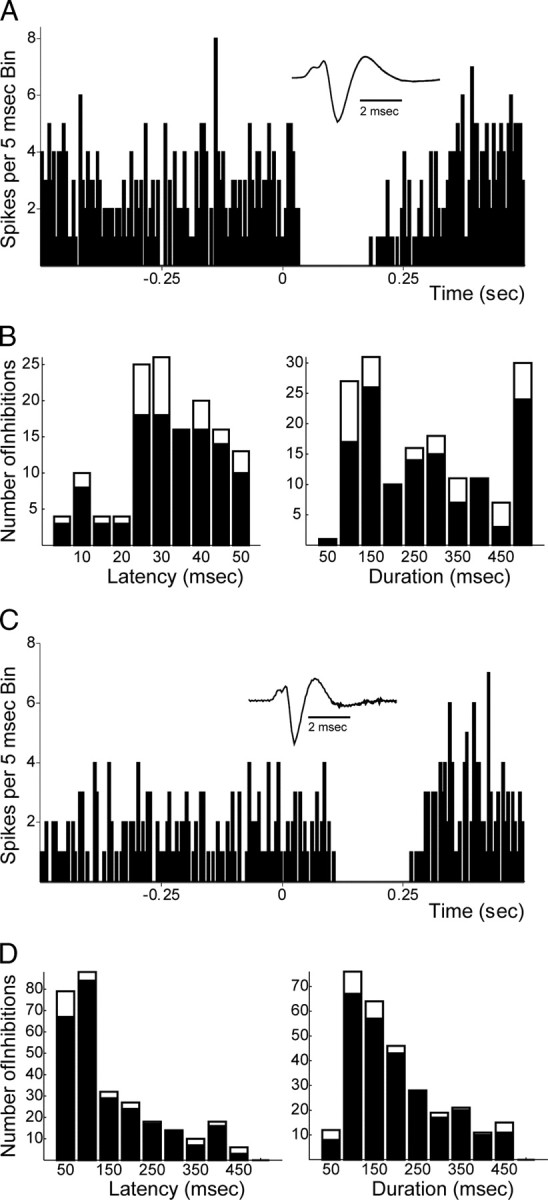
mPFC-evoked inhibitions in dopamine neurons. A, Example of short-latency inhibitory response of a DA neuron evoked by mPFC stimulation (50 pulses, 0.5 Hz). Stimulation occurs at time 0. B, Distributions of latencies (left) and durations (right) of short-latency inhibitory responses for DA neurons (filled) and non-DA neurons (open) after mPFC stimulation. Abscissa values represent highest value in each bin (e.g., the first bin is 0–5 ms, etc.). C, Example of long-latency inhibitory responses of a second DA neuron evoked by mPFC stimulation (parameters as in A). D, Distributions of latencies (left) and durations (right) of long-latency inhibitory responses for DA neurons (filled) and non-DA neurons (open) after mPFC stimulation. Data presented from 175 DA and 32 non-DA neurons from 62 rats. See Materials and Methods for calculation of activation onset latencies and durations. Insets show waveforms of recorded neurons (high-pass filter = 100 Hz).
Prefrontal stimulation most frequently produced short-latency excitation followed by inhibition
Table 1 summarizes evoked responses from recorded neurons. mPFC-evoked responses often demonstrated more than one response (e.g., short-latency excitation followed by inhibition) (Fig. 2A). An important question is what patterns of excitation and/or inhibition were evoked, as the answer provides information about the nature of the inputs to the neuron. Table 2 shows the first response of each excited or inhibited neuron (total number of mPFC-responsive DA neurons = 199, non-DA neurons = 38), and whether more than one response occurred (in the 0–500 ms poststimulus interval). The neurons shown in Table 2 are cells that exhibited consistent responses across all stimulation intensities (n = 137 DA cells and 27 non-DA cells; other cells giving variable responses with different stimulation intensities are discussed below). The major findings from this analysis are, first, that the short-latency evoked response was the most common initial response to mPFC stimulation (27.6% of all responsive neurons) and, second, that short-latency evoked responses were commonly followed by inhibition (69.1% of cells exhibiting a short-latency response). An example of this type of response is shown in Figure 2A. Excitatory responses following inhibition were less common, indicating that the majority of evoked excitatory responses were synaptic in nature (as opposed to rebound excitation, for example). A similar pattern was seen in non-DA neurons (Table 2). Importantly, these results, in combination with those presented in Table 1, show that even though many neurons exhibited mPFC-evoked inhibition, this inhibition was typically longer-latency and often followed an excitatory response.
The remaining DA neurons responded in a variable manner depending on the stimulation intensity (n = 62). A few neurons exhibited consistently excitatory (n = 11) or inhibitory (n = 11) responses whose latency or second response shifted with changes in stimulation intensity. These neurons primarily shifted to shorter-latency responses at higher current intensities. The remaining 40 DA neurons exhibited responses whose directions were dependent on current intensity. These neurons primarily responded with inhibition at low current intensities and excitation at higher current intensities (n = 27). A minority showed either a change from excitation to inhibition (n = 7) or inconsistent changes in responses (n = 6). Non-DA neurons showed a similar distribution in the proportion of responses. These data demonstrate that mPFC has a potent excitatory influence on VTA neurons. In neurons not initially responsive to mPFC stimulation, increasing current often revealed excitatory responses, presumably by activating a broader cortical area including regions of mPFC projecting (either directly or indirectly) to the recorded neurons.
Short-latency excitatory VTA responses were primarily elicited from ventral prelimbic/ infralimbic cortex
Figure 4 shows the distribution of stimulation sites producing short- or long-latency evoked excitatory responses. Note that sites that produced short-latency responses tended to cluster in the ventral prelimbic/infralimbic area. This was confirmed in a systematic analysis of varying the locations of stimulation sites. To determine the influence of stimulation location on VTA responses, we recorded from 13 VTA neurons (10 DA and 3 non-DA) while stimulating at different dorsoventral locations within mPFC. All of these cells exhibited short-latency excitations at ventral sites (4.5 mm depth; in the vicinity of the border between PL and IL cortices) (Fig. 5). However, moving the stimulating electrode to more dorsal locations in PL or cingulate (ACC) cortex (2.5–3.5 mm depth) either reduced or completely abolished the short-latency excitatory response in all 13 neurons tested (Fig. 5). The majority of responses were abolished when moving to 2.5 mm depth. This difference was significant (F(2,32) = 15.93, p < 0.001). Post hoc tests of significance demonstrated a significant difference between short-latency responses evoked at stimulation depths of 2.5 and 4.5 mm, as well as between responses at depths of 3.5 and 4.5 mm (Tukey HSD, p < 0.001), but not at depths of 2.5 and 3.5 mm.
Figure 4.

mPFC stimulation sites. A, Example of a marking lesion (at arrow) from a bipolar stimulating electrode in the ventral prelimbic cortex. B, Hemisection plots of prefrontal cortex showing the distribution of stimulation sites characterized by the type of excitatory response evoked in either DA or non-DA neurons. SLE, Short-latency excitatory response; LLE, Long-latency excitatory response; DA, dopamine neuron; ND, nondopamine neuron. SLE markers include neurons exhibiting short- or short- and long-latency responses. LLE markers include neurons only exhibiting long-latency responses. Data are presented from 82 stimulated rats. The plots are arranged rostral (left) to caudal. Frontal sections are shown; medial is to the left. Scale bar in A, 1 mm. The plots in B are modified with permission from Paxinos and Watson (1998).
Figure 5.

Decreased short-latency excitation at dorsal mPFC stimulation sites. A, Example of a DA neuron exhibiting no short-latency evoked excitation following mPFC stimulation (50 pulses, 0.5 Hz) in the ACC (2.5 mm from brain surface; top histogram). Placing the stimulating electrode at more ventral locations (DV 3.5 middle, DV 4.5 bottom) revealed stronger short-latency evoked responses. Stimulation sites are plotted in B. Cgl, Cingulate cortex; PrL, prelimbic cortex. C, Across all 13 neurons tested in 10 rats, ventral stimulation sites produced significantly greater short-latency evoked responses than dorsal sites. Rmag calculation is described in Materials and Methods. The plots in B are modified from Paxinos and Watson (1998).
Although short-latency excitatory responses were abolished by moving the stimulation electrode to more dorsal positions, evoked responses of a different nature were found for many neurons at these dorsal stimulation sites. Out of the 13 neurons tested after moving the stimulation electrode dorsally, 4 (3 DA, 1 non-DA) showed long-latency excitations, 8 (6 DA, 2 non-DA) showed short-latency inhibitions, and 6 (5 DA, 1 non-DA) showed long-latency inhibitions. Some neurons exhibited more than one evoked response at dorsal stimulation sites (e.g., short-latency inhibition followed by long-latency excitation) (Fig. 5A). Of note, these types of response are similar to the two main categories of evoked responses obtained by Tong et al. (1996) when stimulating dorsal mPFC: “E” responses analogous to our long-latency excitations, and “IE” responses analogous to our short-/long-latency inhibitory responses followed by excitation.
We also recorded the responses of 12 DA neurons (independent of those described above) to stimulation of the more ventral IL mPFC (DV 5.0–5.5), 4 of which exhibited short-latency evoked responses (15–45 ms latency). This proportion is approximately equivalent to the 40% of neurons that displayed short-latency evoked responses from the ventral PL/IL border area across all recordings (Table 1, Fig. 4). Thus our results are well aligned with previous physiological studies of the effects of mPFC stimulation on evoked responses in DA neurons: dorsal (dorsal prelimbic/cingulate) stimulation primarily produces long-latency excitation and short-latency inhibition, whereas ventral (ventral prelimbic/infralimbic) stimulation more frequently produces short-latency excitation. Overall, these results are in line with the description of strong glutamatergic projections from the PL/IL mPFC to the VTA described in anatomical studies (Geisler et al., 2007).
Locations of VTA neurons driven by mPFC stimulation
We selected for anatomical analysis a subset of 67 DA neurons from which we were able to most accurately plot the locations of VTA neural recordings. Included in this group were 8 juxtacellularly labeled DA neurons. We plotted the positions of these 67 neurons segregated by whether mPFC stimulation evoked short-latency excitations, long-latency excitations, or no excitation at all. As seen in Figure 6, there did not appear to be a topographic segregation of neurons based on mPFC responsiveness. This lack of topography within VTA was confirmed statistically using ANOVAs to assess differences in the X-, Y-, or Z-distribution of locations for neurons that exhibited short-latency, long-latency, or no evoked responses (all p > 0.05). However, a qualitative inspection of the spatial distribution of recorded neurons suggested a bias for neurons exhibiting short-latency evoked responses to cluster toward more caudal and ventral regions of the VTA. The area containing neurons with short-latency evoked responses also appeared to be confined to a middle medial/lateral region overlapping the parabrachial and paranigral nuclei, but not including the extreme regions of either.
Figure 6.

VTA recording sites. A, Example pontamine sky blue spot (black arrow) marking a recording location in VTA. Note the electrode track just dorsal to the blue spot (white arrow). B, Plots of 67 histologically localized DA neurons exhibiting short- (SLE) or long- (LLE) latency mPFC-evoked excitation recorded in 34 rats. Frontal sections are shown; medial is to the left. Scale bar in A, 0.5 mm. The plots in B are modified from Paxinos and Watson (1998).
Short-latency evoked responses are glutamatergic
VTA neurons receive multiple types of excitatory projections, only some of which are glutamatergic. If short-latency excitations were mediated by direct cortical projections, as we propose, they should be mediated by glutamate. To determine whether short-latency evoked responses from PFC were glutamatergic, in a subset of neurons we tested the effect of local AMPA/NMDA glutamate receptor antagonism on short-latency excitatory responses. Using a double-barrel pipette, we ejected 60 nl of a cocktail of CNQX and AP5 immediately proximal to the neuron recorded (see Materials and Methods). As illustrated for one example cell in Figure 7, of the 10 neurons tested in this manner, 9 showed decreased or abolished responses following CNQX/AP5 application. These results support the hypothesis that the majority of the mPFC-evoked response in DA neurons is glutamatergic in nature, consistent with responses to direct cortical inputs.
Figure 7.
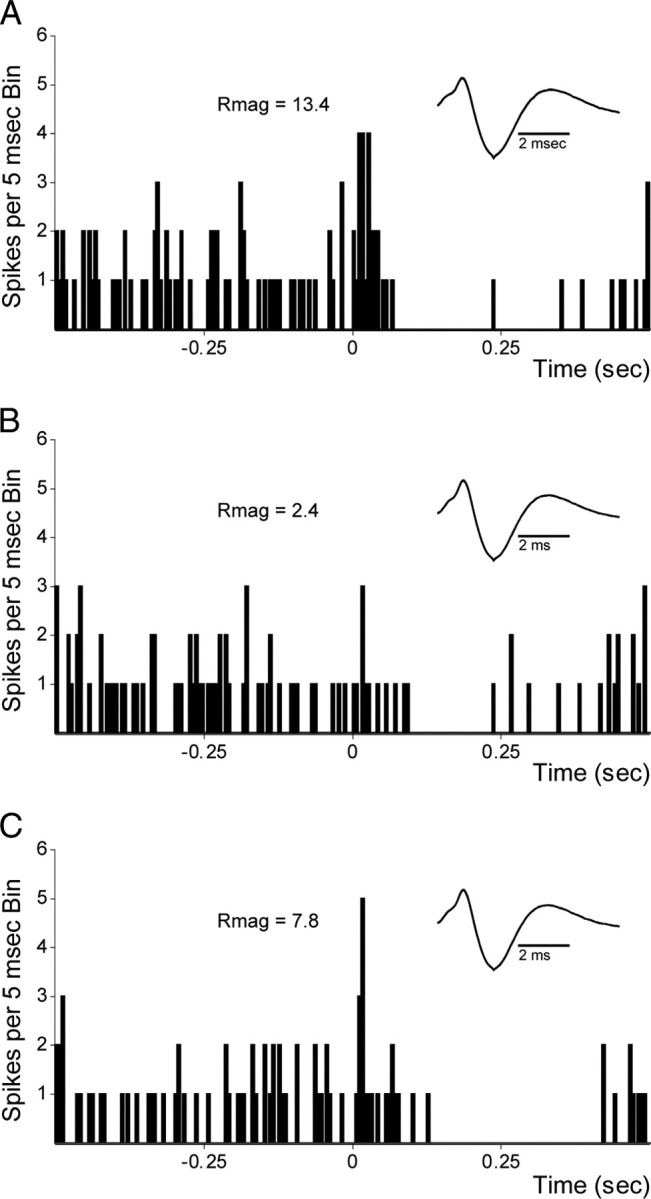
Application of glutamate antagonists abolishes short-latency evoked responses from mPFC. A, Example of a short-latency mPFC-evoked response of a DA neuron in VTA before application of the glutamate antagonists AP5/CNQX. B, Evoked response is absent 2 min after AP5/CNQX application. C, Partial recovery of evoked response 10 min after application. Rmag calculations were as described in Materials and Methods.
Stimulation of mPFC during the rest period produced fewer short-latency evoked responses than during the active period
The preceding results were obtained from rats studied during their active period. We also recorded 56 DA neurons during mPFC stimulation of 16 rats in their rest periods. A number of DA neurons exhibited mPFC-evoked excitation (Fig. 8A), but the percentage of recorded DA neurons that yielded excitatory responses was significantly lower than the percentage recorded during the active period (60.6% of DA neurons recorded in the active period vs 42.9% of DA neurons recorded in the rest period; p < 0.05, Fisher's exact test on numbers of neurons) (see Tables 1 and 3). In addition, the percentage of DA neurons with short-latency evoked responses was significantly lower in rest- than active-period animals (39.8% of DA neurons recorded in the active period vs 25.2% of neurons recorded in the rest period; p < 0.05, Fisher's exact test) (Fig. 8B). No significant differences were observed in evoked long-latency responses (31.4% of DA neurons recorded in the active period vs 26.7% of DA neurons recorded during the rest period; p > 0.05, Fisher's exact test) (Fig. 8B). Although a trend toward enhanced excitability existed for non-DA neurons during the active period, particularly for short-latency evoked excitations (38.6% of cells exhibited short-latency excitation during the active period vs 10.0% during the rest period, p < 0.2, Fisher's exact test), the comparisons did not achieve significance, perhaps due to the low number of non-DA neurons recorded during the rest period (n = 10). Among DA neurons with excitatory responses, there was no difference in the strength of evoked responses in rest vs active periods for either short-latency excitation (active mean Rmag: 25.44, rest mean Rmag: 25.21; U158 = 1116, p > 0.05, Mann–Whitney U) or long-latency excitation (active mean Rmag: 39.01, rest mean Rmag: 33.72; U142 = 1535, p > 0.05, Mann–Whitney U) (Fig. 8C). A small number of non-DA neurons was also recorded during the rest period, a subset of which showed evoked excitation (Table 3), though only one non-DA neuron exhibited short-latency evoked responses. The strength of short-latency responses in non-DA neurons was not calculated across circadian periods due to the paucity of activated non-DA neurons during the rest period. Similarly, evoked inhibition occurred more frequently in DA neurons during the active period than in the rest period (74.2% active vs 57.1% rest, p < 0.05, Fisher's exact test), but not in non-DA neurons (72.7% active vs 70% rest).
Figure 8.
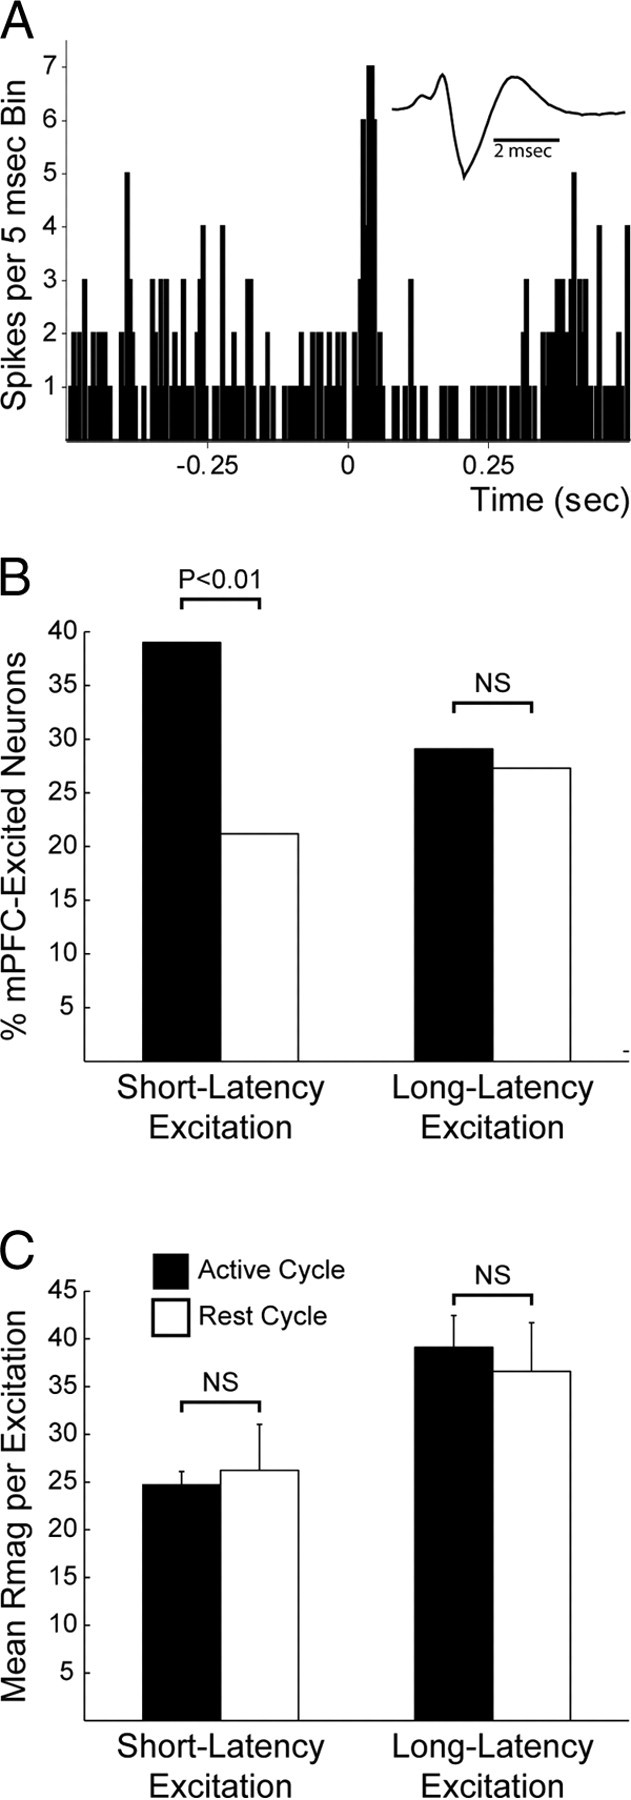
Short-latency evoked responses were less frequent in the rest than in the active period. A, Example of a DA neuron recorded during the rest period exhibiting an mPFC-evoked short-latency excitation. B, Significantly fewer neurons recorded during the rest period exhibited short-latency mPFC-evoked responses when compared to neurons recorded during the active period. Fewer long-latency evoked responses were also observed, but the difference was not significant. This effect was mainly driven by differences in DA neurons (see Results). C, Average strength of either short- (left) or long- (right) latency responses. There was no significant difference between the magnitudes of short- and long-latency evoked responses in DA neurons recorded during the active and rest periods (measured as Rmag, see Materials and Methods). Numbers of neurons included in these analyses are shown in Tables 1 and 3.
Table 3.
mPFC-evoked responses in VTA dopamine and nondopamine neurons recorded during the rest period
| Dopamine |
Nondopamine |
|||
|---|---|---|---|---|
| Number | Percentage | Number | Percentage | |
| Recorded | 56 | N/A | 10 | N/A |
| Excited | 24 | 42.9% | 4 | 40.0% |
| Short latency | 9 | 16.1% | 1 | 10.0% |
| Long latency | 11 | 19.6% | 3 | 30.0% |
| Short + long latency | 4 | 7.1% | 0 | 0.0% |
| Inhibited | 32 | 57.1% | 7 | 70.0% |
| Short latency | 7 | 12.5% | 2 | 20.0% |
| Long latency | 18 | 32.1% | 5 | 50.0% |
| Short + long latency | 7 | 12.5% | 0 | 0.0% |
| Unresponsive | 19 | 33.9% | 3 | 30.0% |
Neurons are subdivided into groups characterized by the type of excitatory or inhibitory responses they exhibited (see main text for definitions). Percentages are of total number of neurons recorded. Note that some neurons exhibited both excitatory and inhibitory responses, in which case they were counted in both categories. Specific neuronal responses are categorized in Table 4.
Patterns of mPFC-evoked responses in rest-period animals are summarized in Table 4. Proportions of specific response patterns were similar to those seen in active-period animals (Table 2), with the obvious difference of a decreased proportion of evoked excitation overall. Six DA and two non-DA neurons showed evoked inhibition with patterns that varied with changing stimulus intensities, and two DA neurons showed varying patterns of evoked excitation with changing stimulus intensities. Finally, in 10 DA neurons and 1 non-DA neuron tested with different stimulation intensities in the rest period, the direction of evoked responses (excitation vs inhibition) changed with current intensity, typically changing with higher intensities from inhibition to excitation. Thus, for the subset of VTA neurons capable of being driven by mPFC stimulation, increased cortical activation biases responses toward excitation during both the active and rest periods. Although mPFC stimulation evoked both more excitatory and more inhibitory responses in VTA neurons during the active period than during the rest period, comparisons of Table 2 to Table 4, as well as Table 1 to Table 3, show that the overall influence of stimulation was biased more toward excitation during the active period than during the rest period.
Table 4.
Relationship between excitatory and inhibitory mPFC-evoked responses in VTA dopamine and nondopamine neurons recorded during the rest period
| Dopamine |
Nondopamine |
|||
|---|---|---|---|---|
| Number | Percentage | Number | Percentage | |
| SLE-all | 5 | 13.5% | 1 | 14.3% |
| SLE followed by Inh | 3 | 8.1% | 1 | 14.3% |
| SLI-all | 4 | 10.8% | 1 | 14.3% |
| SLI followed by Exc | 0 | 0.0% | 0 | 0.0% |
| LLE-all | 1 | 2.7% | 0 | 0.0% |
| LLE followed by Inh | 0 | 0.0% | 0 | 0.0% |
| LLI-all | 9 | 24.3% | 2 | 28.6% |
| LLI followed by Exc | 3 | 8.1% | 0 | 0.0% |
These neurons are a subset of the 37 and 7 mPFC-responsive DA and non-DA neurons, respectively, that showed consistent response patterns across multiple stimulation intensities (DA n = 19, non-DA n = 4). Note that the neurons in the “followed by” categories are included in the corresponding “all” categories. Additional neurons (described in text) responded differentially depending on stimulation intensity.
ORX receptor activation enhances mPFC-evoked VTA neuron excitation
To determine whether ORX interacts with mPFC inputs to VTA, we next tested the effect of local ORX-A application (from a double-barrel pipette) on the response of VTA neurons to mPFC stimulation. As described in Materials and Methods, ORX-A was applied for 1 min and mPFC-evoked responses were recorded in the following contexts: (1) before ORX-A application (preinfusion), (2) 5 min following ORX-A application (postinfusion), (3) during ORX-A application (stim+infusion), and (4) 5 min following the stim+infusion period (post-stim+infusion). Example recordings are shown in Figure 9, A1 and A2. We then calculated whether significant evoked responses were observed (using a >2 SD criterion as described in Materials and Methods) and, for evoked responses, measured the strength of the response using Rmag (described in Materials and Methods). In both DA and non-DA neurons, the main effect of ORX-A application was to enhance mPFC-evoked responses; in many cases ORX-A application revealed responses that were not apparent previously (termed “gating,” described below). Out of 37 DA neurons that exhibited a short-latency excitation, 26 displayed greater evoked responses either following or during ORX-A application. Out of these 26 neurons, 22 exhibited greater responses at least 5 min following ORX-A administration (postinfusion or post-stim+infusion conditions), indicating prolonged modulation of PFC-driven responses by ORX (Fig. 9A1). Comparing Rmag values across the population revealed a significant overall augmentation of excitatory responses in DA neurons by ORX administration (t(36) = 2.21, p < 0.05). ORX-A administration also increased short-latency evoked responses in seven of eight non-DA neurons (t(7) = 3.40, p < 0.05).
Figure 9.

Orexin enhances, and SB 334867 diminishes, mPFC-evoked responses. A, B, Responses of DA neurons, recorded during the active period, to mPFC stimulation preinfusion, stim+infusion, and post-infusion of orexin-A (ORX-A; A panels) or SB 334867 (SB; B panels). A1, Example of short-latency mPFC-evoked responses in a DA neuron before infusion (left) and after infusion (right) of ORX-A. Short-latency evoked responses were enhanced or, in this case, revealed both during and following ORX-A administration (60 nl, 1.4 μm). A2, Example of long-latency evoked responses before infusion (left) and during infusion (stim+infusion; right) of ORX-A in a DA neuron. Long-latency evoked responses were also enhanced by ORX-A administration. B1, Example of short-latency mPFC-evoked responses in a DA neuron before infusion (left) and after infusion (right) of SB. Short-latency evoked responses were diminished during and after SB administration (60 nl, 100 μm). B2, Example of long-latency evoked responses in a DA neuron before infusion (left) and after infusion (right) of SB. Long-latency evoked responses were also diminished by SB administration. For all evoked responses, 50 pulses at 0.5 Hz were delivered. Application of ACSF (60 nl) had no effect on evoked responses. See Results for complete characterizations of evoked responses across the population.
In 12 of the 26 neurons with greater responses, ORX-A application gated the mPFC-evoked response: significant evoked responses were observed during or following application but not before. ORX-A also gated responses in four of the seven non-DA neurons with responses increased by ORX-A application, and the enhanced responses in three cells persisted after the end of application.
Evoked responses were also increased in 24/36 DA neurons with long-latency excitatory responses (t(35) = 2.79, p < 0.01), with increases persisting at least 5 min beyond ORX-A application in 12 of these cells. In 21/36 neurons, long-latency responses were gated by ORX, i.e., not present before application. An example of an enhanced long-latency response is shown in Figure 9A2. Long-latency responses were also enhanced by ORX-A in six of eight non-DA neurons (t(7) = 1.98, p > 0.05), with three exhibiting persistent enhancement and all six exhibiting no significant response before ORX-A application. By comparison, we observed no facilitation of evoked responses following application of ACSF in 22 DA neurons, 6 of which showed short-latency evoked excitations (t(5) = 0.18, p > 0.05), and 6 of which showed long-latency evoked excitations (t(5) = 0.33, p > 0.05).
The effects of ORX-A application on evoked responses were largely independent of effects on spontaneous activity. Our analysis of mPFC-evoked responses used an Rmag calculation that normalized for any change in baseline (see Materials and Methods), ensuring that observed effects on evoked responses were not due simply to an additive effect of ORX on spontaneous activity. In fact, ORX-A administration likely enhanced responses in a higher proportion of neurons than described above: qualitative assessment of evoked responses during ORX-A application (stim+infusion condition) revealed at least four instances where potentially enhanced evoked responses were obscured by ORX-induced increases in spontaneous activity. A complete analysis of the influence of ORX-A on spontaneous activity is described below.
ORX1R activation increases evoked activity of DA neurons during the rest period
The above results were obtained from rats recorded during their active period. During the rest period, ORX had an influence on mPFC-evoked responses similar to that seen during the active period. Of 11 neurons exhibiting short-latency evoked responses during the rest period, the responses of 4 were enhanced by ORX-A application. However, unlike during the active period, the effect of ORX on short-latency evoked excitation (Rmag) during the rest period was not significant (t(10) = 0.39, p > 0.05).
Long-latency evoked responses in rest-period animals were more frequently enhanced than short-latency responses, with 10/14 excited DA neurons exhibiting increased long-latency responses with ORX-A. Seven of these neurons displayed prolonged response enhancement at least 5 min after the end of application, and seven neurons demonstrated no long-latency activation before application (separate but overlapping populations). Despite the preponderance of neurons exhibiting enhanced long-latency responses, the effect across the population was not significant (t(13) = 1.94, p = 0.075), likely due to high variability in the intensities of evoked responses.
ORX1R antagonism decreased mPFC-evoked excitation of VTA DA neurons
We also tested the influence of local ORX1R antagonism on mPFC-evoked responses. Local microinfusion of the ORX1R antagonist SB 334876 (SB) for 1 min (as described in Materials and Methods) diminished short-latency evoked responses in 8/12 DA neurons recorded during the active period. An example is shown in Figure 9B1. In all eight cases, the reduced evoked responses persisted at least 5 min after SB application. The population effect for Rmags across all 12 cells, however, failed to reach significance (t(11) = 1.12, p > 0.05), most likely due to the small, though consistent, changes. Long-latency evoked responses were also affected by local SB application during the active period: 8/11 DA neurons showed diminished long-latency responses following SB administration, an effect that almost reached significance across the population with Rmag analysis (t(10) = 2.17, p = 0.055). An example is shown in Figure 9B2. As with short-latency evoked responses, all 8 cases of diminished evoked activity persisted after SB application. During the rest period, SB decreased the short-latency responses in one of two DA neurons and decreased evoked long-latency responses in two of two DA neurons. The influence of SB on responses in non-DA neurons was not tested due to the low number of such cells recorded.
ORX1R activation and antagonism produced inconsistent effects on evoked inhibitory responses
We additionally analyzed the effect of application of ORX or SB on mPFC-evoked inhibitory responses in VTA neurons. We focused our attention on the influence following drug application (postinfusion) because application of ORX and SB modulated spontaneous activity (see below for analysis), which could occlude effects on evoked inhibition. Unlike the consistent directional effects of ORX1R manipulation on evoked excitation (enhancement for ORX, diminution for SB), the effects of ORX and SB on inhibitory responses were inconsistent and minor. In 63 neurons that exhibited short-latency inhibition, 13 and 10 showed enhanced and diminished inhibitory responses with ORX-A application, respectively. Similar proportions were seen with applications of SB (5/24 enhanced, 3/24 diminished) and ACSF (3/22 enhanced, 2/22 diminished). No significant effects were observed across the population (ORX: t(22) = 0.18, p > 0.05; ACSF: t(4) = 0.05, p > 0.05; SB: t(7) = 1.48, p > 0.05). In the same neurons, long-latency inhibitions were more commonly diminished than enhanced (27 diminished and 16 enhanced with ORX, 8 enhanced and 8 diminished with SB, and 4 enhanced and 5 diminished with ACSF), though, again, the effect was unreliable and not significant across the population (ORX: t(42) = 0.99, p > 0.05; ACSF: t(8) = 0.80, p > 0.05; SB: t(15) = 0.71, p > 0.05). Similar inconsistent effects were seen when focusing on stimulation during ORX/SB application. We conclude from these results that ORX1R manipulation using ORX or SB has a minor or unreliable impact on mPFC-evoked inhibition, consistent with a primary role of ORX in strengthening excitatory synapses.
ORX1R activation increased baseline VTA neuron activity during active and rest periods
We also tested the influence of direct ORX application on spontaneous impulse activity of DA neurons. In many DA neurons, microinjections of ORX-A onto recorded neurons during the active period produced strong increases in activity (Fig. 10), as would be predicted by in vitro results (Korotkova et al., 2003) and by the fact that larger ORX infusions into the ventral midbrain area increased the firing rates and numbers of VTA DA neurons detected (Muschamp et al., 2007). An example neuron and population results from 79 DA neurons tested with local ORX-A microinjection are shown in Figure 10. Across the population, the effect of local ORX-A application was to significantly increase spontaneous firing in DA neurons in 59 of 79 DA neurons (Fig. 10B) (mean pre-ORX: 4.98 sp/s, mean post-ORX: 5.99 sp/s; t(78) = 3.81, p < 0.001). Despite an apparently robust increase in firing rate of non-DA neurons following ORX-A application (Fig. 10B), the effect was not statistically significant, possibly due to high variance and the limited number of non-DA neurons tested (n = 12). Application of ACSF (22 DA neurons) produced no significant effect on firing rates across the population (t(21) = 1.20, p > 0.05).
Figure 10.

Application of orexin-A increased tonic firing of dopamine and nondopamine neurons. A, Example of increased tonic activity in a DA neuron during and following application of 60 nl orexin-A (ORX-A; 1.4 μm; active period recording). The gray bar shows ∼1 min of ORX-A application. B, Scatter plot depicting the change in activity of DA (blue) and non-DA (red) neurons following (y-axis) as compared to before ORX-A application (x-axis) recorded during the active period in 36 rats. Each neuron is represented by one point. Points above the unity line show increased firing rate with ORX-A application. C, Effects of ORX-A application on firing rates of neurons recorded during the rest period in 11 rats. Conventions are as in A.
We also tested the influence of ORX on bursting in DA neurons. Across the population, the predominant effect of ORX-A microinjection was to increase bursting, measured as percentage of spikes in bursts [SIB; 55/79 increase, 21/79 decrease, 3/79 no change; mean preinjection SIB: 40.06%, mean postinjection SIB: 48.83%; t(78) = 3.7463, p < 0.001; t tests arcsin(sqrt) transformed].
We observed a similar and significant increase in activity of DA neurons following ORX-A application during the rest period as during the active period (24/35 DA neurons and 5/5 non-DA neurons from 12 rats) (Fig. 10C) (DA neurons: mean pre-ORX: 5.43 sp/s, mean post-ORX: 6.56 sp/s; t(34) = 3.22, p < 0.005) We also found a similar increase in bursting (22/35 increase, 13/35 decrease; mean preinjection SIB: 46.80%, mean postinjection SIB: 57.71%; t(34) = 2.5910, p < 0.05). As during the active period, application of ACSF to 17 neurons during the rest period resulted in no change in baseline activity (t(16) = 1.21, p > 0.05).
ORX1R antagonism decreased VTA DA activity during the active period, but not during the rest period
We also assessed the influence of the ORX1R antagonist SB 334867 on baseline activity of DA neurons. We recorded from 20 neurons (19 DA and 1 non-DA) during local microinfusion of 100 μm SB in active-period rats. The main effect of SB administration was to decrease spontaneous impulse activity (Fig. 11A). This effect was significant and predominant across DA neurons: SB decreased activity in 12 of the 19 DA cells tested (Fig. 11B) (mean pre-SB: 4.48 sp/s, mean post-SB: 3.87 sp/s; t(18) = 2.17, p < 0.05). Fourteen DA neurons recorded during the rest period were also tested for the influence of SB on spontaneous activity. In these neurons, there was no overall effect of SB administration. It appeared that fewer neurons were inhibited by SB in the rest period (7 of 14 neurons), and the strength of inhibition was weaker than in active-period animals (Fig. 11C) (mean pre-SB: 4.91 sp/s, mean post-SB: 5.01 sp/s; t(13) = 1.09, p > 0.05). Overall, the SB-evoked decrease in spontaneous firing rate was significantly greater in active-period animals than in rest-period animals (t(31) = 2.21, p < 0.05). These results indicate that there is a greater tonic ORX input to DA neurons during the active period than during the rest period. To confirm these observations, we performed two 2-factor ANOVAs comparing the change in firing following ORX or SB treatment (vs ACSF) in either active or rest periods. The analysis of the influence of ORX on firing rate demonstrated a main effect of treatment (ORX/ACSF; F(1,152) = 5.27, p < 0.05), but no effect of period (active/rest; F(1,152) = 0.75, p > 0.05), and no interaction effect (F(1,152) = 1.43, p > 0.05). On the other hand, the analysis of the influence of SB on firing rate showed no main effect of either treatment (SB/ACSF; F(1,71) = 1.53, p > 0.05) or period (F(1,71) = 0.18, p > 0.05), but did show a significant interaction effect (F(1,71) = 9.30, p < 0.005). These results, illustrated in Figures 10 and 11, show that ORX increases baseline firing rate regardless of circadian period but that tonic ORX input to VTA neurons fluctuates in a diurnal fashion such that blockade of ORX1Rs with SB only decreases basal activity during the active period, when ORX levels are high.
Figure 11.

Local ORX1R antagonist application decreased tonic firing of dopamine and nondopamine neurons in the active period only. A, Example of decreased tonic activity in a DA neuron during and following application of 60 nl of SB 334867 (SB; 100 μm). B, C, Neurons recorded during the active period of 12 rats showed significant decreases in spontaneous activity with SB application (B), whereas neurons recorded during the rest periods of 6 rats showed no effect of SB application (C). Conventions are as in Figure 10.
Discussion
Here we demonstrated that VTA-DA neurons in vivo are strongly regulated by mPFC and orexinergic inputs, both independently and interactively. mPFC stimulation produced short-latency excitations in VTA-DA neurons. These responses were more frequently evoked from the ventral prelimbic/infralimbic cortex than from dorsal sites, and were also more frequently observed during the active period than the rest period, indicating a significant diurnal influence. Blockade of the ORX1R with SB decreased spontaneous activity in active- but not rest-period animals, indicating a tonic excitatory influence of ORX on DA neuronal excitability during the active period. Finally, we characterized an interaction between ORX and mPFC inputs to DA neurons. Short- and long-latency mPFC-evoked responses were enhanced by ORX-A administration, and in many cases, responses occurred only after ORX-A administration. SB application decreased short- and long-latency mPFC-evoked responses. Together, our data indicate that ORX release in VTA enhances mPFC control over DA neurons, which may play a role in goal-directed behavior.
DA neurons are driven by mPFC stimulation at short latencies, primarily during the active period
Although anatomical studies have defined an mPFC–VTA pathway (Sesack and Pickel, 1992; Lu et al., 1997; Carr and Sesack, 2000; Geisler and Zahm, 2005; Geisler et al., 2007), physiological characterization of direct mPFC influence on DA neurons is lacking. Previously, PFC stimulation primarily produced excitations with latencies too long to be mediated by direct projections (Gariano and Groves, 1988; Tong et al., 1996). These studies focused on stimulation of dorsal mPFC, including dorsal PL and ACC. Our results demonstrate that the ventral PL/dorsal IL area has a more direct impact on DA neuron activity, consistent with anatomical studies showing a stronger glutamate projection to VTA from ventral than dorsal mPFC (Geisler et al., 2007). In one prior study, ventral PL stimulation produced apparent short-latency evoked responses (Almodóvar-Fabregas et al., 2002). These data, although not described in detail, are consistent with our findings. Additionally, recent work investigated IL influences on VTA neurons, concluding that this projection frequently involves a relay through the bed nucleus of the stria terminalis (BNST) (Massi et al., 2008). These results further support functional topography for PFC influences on VTA, and indicate that the PL/IL area, as opposed to IL, may provide direct input to VTA, as indicated by anatomical studies (Geisler et al., 2007).
We also found more short-latency responses evoked during the active than during the rest period. It is unclear whether earlier studies of mPFC-evoked responses in VTA were conducted in active- or rest-period animals. Previous investigations found that the activity of VTA neurons is influenced by phase of the diurnal cycle (Dahan et al., 2007; Luo et al., 2008; Léger et al., 2010). ORX inputs are one possible source for this variation in responses during active versus rest periods (see below).
ORX provides a diurnal influence on VTA DA neuron activity in vivo
Previous studies, both in vitro (Korotkova et al., 2003; Borgland et al., 2006) and in vivo (Muschamp et al., 2007), reported increased DA neuron activation following regional ORX application. We extended these results by showing, in vivo, that ORX-A microinjected directly onto the recorded neuron produces rapid-onset excitation. We also showed that the influence of endogenous ORX on VTA neurons is higher in the active than in the rest period. This conclusion is consistent with findings that ORX neuron activity (Estabrooke et al., 2001; Lee et al., 2005; Mileykovskiy et al., 2005) and ORX release (Yoshida et al., 2001; Kiyashchenko et al., 2002) fluctuate in a circadian manner and are directly related to the level of arousal/waking. Our data indicate, moreover, that this fluctuation in ORX levels influences excitability of DA neurons in VTA.
ORX in VTA facilitates excitatory drive from mPFC
Borgland et al. (2006) demonstrated in vitro that ORX-A facilitates glutamate responses and plasticity in VTA DA neurons by inducing NMDA receptor trafficking. In addition, the ORX1R is coupled to phosphoinositol metabolism, which may potentiate evoked ionotropic glutamate responses in VTA by a desensitization mechanism (Paladini et al., 2001; Paladini and Williams, 2004). We extended these findings, demonstrating that at least some evoked responses that are facilitated by ORX originate in mPFC. We also found that many DA neurons exhibited enhanced responses to mPFC stimulation that persisted for many minutes following ORX-A application, consistent with previous findings in vitro (Borgland et al., 2006). Thus, as in that study, the enhanced short-latency evoked responses we observed from mPFC may involve ORX-driven plasticity in the mPFC-DA synapse. Importantly, our results also reveal that naturally fluctuating levels of ORX in vivo may gate, as well as augment, mPFC-evoked responses. We observed fewer evoked responses during the rest period, but these responses were similar in magnitude to those observed during the active period. Whether this gating is specific to mPFC-evoked responses requires further study.
Technical caveats
Care must be taken in interpreting responses from mPFC stimulation as reflecting direct versus indirect influences on DA neurons. Short-latency evoked response onsets were apparently bimodally distributed (Fig. 2), with the shorter values within the range of conduction latencies for the PFC-to-VTA pathway (Thierry et al., 1983). We propose that these responses reflect a monosynaptic pathway. Longer-latency responses could reflect the influence of mPFC on other regions or even on glutamatergic neurons within the VTA that synapse on VTA DA neurons (Dobi et al., 2010). Many prefrontal projection targets, such as LH, BNST, and pedunculopontine and laterodorsal tegmental nuclei, project to VTA and regulate DA neuron activity (Fadel and Deutch, 2002; Georges and Aston-Jones, 2002; Floresco et al., 2003; Omelchenko and Sesack, 2005, 2007; Lodge and Grace, 2006; Balcita-Pedicino and Sesack, 2007). Although mPFC provides the strongest glutamatergic input to VTA (Geisler et al., 2007) it is one of many afferents, and PFC inputs may directly target a restricted population of VTA DA neurons (Omelchenko and Sesack, 2007). Our data showing that only a subset of DA neurons is directly influenced by mPFC stimulation comport with those findings and indicate that the influence of mPFC on DA neurons, although circumscribed, is potent. It should be noted, however, that our results describe the influences of mPFC on DA neurons by direct and indirect circuit inputs, both of which importantly regulate VTA DA activity. Examining both in vivo affords an analysis of the overall functional influence of mPFC activity on VTA neurons, and modulation of this influence by orexin inputs. Further studies are necessary to specify which mPFC-activated indirect projections to DA neurons are modulated by ORX inputs.
Identification of DA neurons is typically based on a number of factors, including waveform shape and basal firing rate (see Materials and Methods); however, these identifiers are not definitive (Johnson and North, 1992; Jones and Kauer, 1999; Ungless et al., 2004; Margolis et al., 2006; Luo et al., 2008; Brischoux et al., 2009). We addressed this issue by identifying several recorded neurons as DA or non-DA using juxtacellular and immunocytochemical labeling. This labeling confirmed that the multiple criteria we used for identifying DA neurons were largely accurate in identifying DA neurons. We are confident, therefore, that our results are valid for a large proportion of DA and non-DA cells in VTA.
Conclusions
ORX neuronal activation and release has a multifaceted impact on behavior. ORX profoundly influences both arousal (Sutcliffe and de Lecea, 2002; Sakurai, 2007) and reward seeking (Aston-Jones et al., 2009), and these functions are proposed to be regulated by medial and lateral sets of orexin neurons, respectively (Harris and Aston-Jones, 2006). The segregation between arousal and reward seeking may not be absolute, and these two streams of ORX-related processing may converge in VTA. By modulating excitatory mPFC influences on DA neurons, ORX may permit goal-directed, reward-driven behaviors when the animal is appropriately aroused or motivated (Boutrel et al., 2010). Reward seeking is influenced by arousal, and varies across the light/dark cycle with heightened seeking during the active period (Roberts et al., 2002; McClung, 2007; Webb et al., 2009). Our data indicate that tonic ORX in VTA facilitates mPFC-evoked responses, particularly during the active period. This permissive effect may be important for general waking behavior. Our data additionally lead us to speculate that phasic ORX release evoked by stimuli associated with salient rewards drives goal-directed behaviors, at least in part, by additionally enhancing mPFC control over DA neurons. Orexin, therefore, might act as a contextual agent whereby highly arousing or salient events or stimuli, through enhanced release of ORX into VTA, strengthen PFC-DA communication. This strengthened communication may facilitate motivated behavior and learning whereby the cues or plans represented in PFC produce enhanced dopamine release, reinforcing behaviors related to specific stimuli. This hypothesis aligns equally well with multiple theories of the role of the DA system, such as in reward prediction or salience signaling (Montague et al., 1996; Schultz, 2007; Redgrave et al., 2008). Results of our study, therefore, are consistent with a view that the ORX system functions at the interface between arousal and motivation. By impacting mPFC excitation of DA neurons, ORX may provide a means for plans and goals to drive reward-seeking behavior in an adaptive arousal context.
Footnotes
This work was supported by Public Health Service Grants R37 DA06214, P50 DA015369, T32 AA007474, U54 NS060658, and C06 RR015455. We thank Alice Luo and Carlos Mejias-Aponte for training and advice, and Lourdes Nogueira for technical assistance.
References
- Akaoka H, Aston-Jones G. Opiate withdrawal-induced hyperactivity of locus coeruleus neurons is substantially mediated by augmented excitatory amino acid input. J Neurosci. 1991;11:3830–3839. doi: 10.1523/JNEUROSCI.11-12-03830.1991. [DOI] [PMC free article] [PubMed] [Google Scholar]
- Almodóvar-Fabregas LJ, Segarra O, Colón N, Dones JG, Mercado M, Mejías-Aponte CA, Vázquez R, Abreu R, Vázquez E, Williams JT, Jiménez-Rivera CA. Effects of cocaine administration on VTA cell activity in response to prefrontal cortex stimulation. Ann N Y Acad Sci. 2002;965:157–171. doi: 10.1111/j.1749-6632.2002.tb04158.x. [DOI] [PubMed] [Google Scholar]
- Aston-Jones G, Smith RJ, Moorman DE, Richardson KA. Role of lateral hypothalamic orexin neurons in reward processing and addiction. Neuropharmacology. 2009;56(Suppl 1):112–121. doi: 10.1016/j.neuropharm.2008.06.060. [DOI] [PMC free article] [PubMed] [Google Scholar]
- Aston-Jones G, Smith RJ, Sartor GC, Moorman DE, Massi L, Tahsili-Fahadan P, Richardson KA. Lateral hypothalamic orexin/hypocretin neurons: a role in reward-seeking and addiction. Brain Res. 2010;1314:74–90. doi: 10.1016/j.brainres.2009.09.106. [DOI] [PMC free article] [PubMed] [Google Scholar]
- Balcita-Pedicino JJ, Sesack SR. Orexin axons in the rat ventral tegmental area synapse infrequently onto dopamine and gamma-aminobutyric acid neurons. J Comp Neurol. 2007;503:668–684. doi: 10.1002/cne.21420. [DOI] [PubMed] [Google Scholar]
- Borgland SL, Taha SA, Sarti F, Fields HL, Bonci A. Orexin A in the VTA is critical for the induction of synaptic plasticity and behavioral sensitization to cocaine. Neuron. 2006;49:589–601. doi: 10.1016/j.neuron.2006.01.016. [DOI] [PubMed] [Google Scholar]
- Borgland SL, Chang SJ, Bowers MS, Thompson JL, Vittoz N, Floresco SB, Chou J, Chen BT, Bonci A. Orexin A/hypocretin-1 selectively promotes motivation for positive reinforcers. J Neurosci. 2009;29:11215–11225. doi: 10.1523/JNEUROSCI.6096-08.2009. [DOI] [PMC free article] [PubMed] [Google Scholar]
- Boutrel B, Cannella N, de Lecea L. The role of hypocretin in driving arousal and goal-oriented behaviors. Brain Res. 2010;1314:103–111. doi: 10.1016/j.brainres.2009.11.054. [DOI] [PMC free article] [PubMed] [Google Scholar]
- Brischoux F, Chakraborty S, Brierley DI, Ungless MA. Phasic excitation of dopamine neurons in ventral VTA by noxious stimuli. Proc Natl Acad Sci U S A. 2009;106:4894–4899. doi: 10.1073/pnas.0811507106. [DOI] [PMC free article] [PubMed] [Google Scholar]
- Carr DB, Sesack SR. Projections from the rat prefrontal cortex to the ventral tegmental area: target specificity in the synaptic associations with mesoaccumbens and mesocortical neurons. J Neurosci. 2000;20:3864–3873. doi: 10.1523/JNEUROSCI.20-10-03864.2000. [DOI] [PMC free article] [PubMed] [Google Scholar]
- Chiodo LA. Dopamine-containing neurons in the mammalian central nervous system: electrophysiology and pharmacology. Neurosci Biobehav Rev. 1988;12:49–91. doi: 10.1016/s0149-7634(88)80073-3. [DOI] [PubMed] [Google Scholar]
- Dahan L, Astier B, Vautrelle N, Urbain N, Kocsis B, Chouvet G. Prominent burst firing of dopaminergic neurons in the ventral tegmental area during paradoxical sleep. Neuropsychopharmacology. 2007;32:1232–1241. doi: 10.1038/sj.npp.1301251. [DOI] [PubMed] [Google Scholar]
- Dobi A, Margolis EB, Wang HL, Harvey BK, Morales M. Glutamatergic and nonglutamatergic neurons of the ventral tegmental area establish local synaptic contacts with dopaminergic and nondopaminergic neurons. J Neurosci. 2010;30:218–229. doi: 10.1523/JNEUROSCI.3884-09.2010. [DOI] [PMC free article] [PubMed] [Google Scholar]
- España RA, Oleson EB, Locke JL, Brookshire BR, Roberts DC, Jones SR. The hypocretin-orexin system regulates cocaine self-administration via actions on the mesolimbic dopamine system. Eur J Neurosci. 2010;31:336–348. doi: 10.1111/j.1460-9568.2009.07065.x. [DOI] [PMC free article] [PubMed] [Google Scholar]
- Estabrooke IV, McCarthy MT, Ko E, Chou TC, Chemelli RM, Yanagisawa M, Saper CB, Scammell TE. Fos expression in orexin neurons varies with behavioral state. J Neurosci. 2001;21:1656–1662. doi: 10.1523/JNEUROSCI.21-05-01656.2001. [DOI] [PMC free article] [PubMed] [Google Scholar]
- Fadel J, Deutch AY. Anatomical substrates of orexin-dopamine interactions: lateral hypothalamic projections to the ventral tegmental area. Neuroscience. 2002;111:379–387. doi: 10.1016/s0306-4522(02)00017-9. [DOI] [PubMed] [Google Scholar]
- Floresco SB, West AR, Ash B, Moore H, Grace AA. Afferent modulation of dopamine neuron firing differentially regulates tonic and phasic dopamine transmission. Nat Neurosci. 2003;6:968–973. doi: 10.1038/nn1103. [DOI] [PubMed] [Google Scholar]
- Gariano RF, Groves PM. Burst firing induced in midbrain dopamine neurons by stimulation of the medial prefrontal and anterior cingulate cortices. Brain Res. 1988;462:194–198. doi: 10.1016/0006-8993(88)90606-3. [DOI] [PubMed] [Google Scholar]
- Geisler S, Wise RA. Functional implications of glutamatergic projections to the ventral tegmental area. Rev Neurosci. 2008;19:227–244. doi: 10.1515/revneuro.2008.19.4-5.227. [DOI] [PMC free article] [PubMed] [Google Scholar]
- Geisler S, Zahm DS. Afferents of the ventral tegmental area in the rat-anatomical substratum for integrative functions. J Comp Neurol. 2005;490:270–294. doi: 10.1002/cne.20668. [DOI] [PubMed] [Google Scholar]
- Geisler S, Derst C, Veh RW, Zahm DS. Glutamatergic afferents of the ventral tegmental area in the rat. J Neurosci. 2007;27:5730–5743. doi: 10.1523/JNEUROSCI.0012-07.2007. [DOI] [PMC free article] [PubMed] [Google Scholar]
- Georges F, Aston-Jones G. Activation of ventral tegmental area cells by the bed nucleus of the stria terminalis: a novel excitatory amino acid input to midbrain dopamine neurons. J Neurosci. 2002;22:5173–5187. doi: 10.1523/JNEUROSCI.22-12-05173.2002. [DOI] [PMC free article] [PubMed] [Google Scholar]
- Grace AA, Bunney BS. Intracellular and extracellular electrophysiology of nigral dopaminergic neurons—1. Identification and characterization. Neuroscience. 1983;10:301–315. doi: 10.1016/0306-4522(83)90135-5. [DOI] [PubMed] [Google Scholar]
- Grace AA, Bunney BS. The control of firing pattern in nigral dopamine neurons: single spike firing. J Neurosci. 1984;4:2866–2876. doi: 10.1523/JNEUROSCI.04-11-02866.1984. [DOI] [PMC free article] [PubMed] [Google Scholar]
- Grace AA, Floresco SB, Goto Y, Lodge DJ. Regulation of firing of dopaminergic neurons and control of goal-directed behaviors. Trends Neurosci. 2007;30:220–227. doi: 10.1016/j.tins.2007.03.003. [DOI] [PubMed] [Google Scholar]
- Guyenet PG, Aghajanian GK. Antidromic identification of dopaminergic and other output neurons of the rat substantia nigra. Brain Res. 1978;150:69–84. doi: 10.1016/0006-8993(78)90654-6. [DOI] [PubMed] [Google Scholar]
- Harris GC, Aston-Jones G. Critical role for ventral tegmental glutamate in preference for a cocaine-conditioned environment. Neuropsychopharmacology. 2003;28:73–76. doi: 10.1038/sj.npp.1300011. [DOI] [PubMed] [Google Scholar]
- Harris GC, Aston-Jones G. Arousal and reward: a dichotomy in orexin function. Trends Neurosci. 2006;29:571–577. doi: 10.1016/j.tins.2006.08.002. [DOI] [PubMed] [Google Scholar]
- Harris GC, Wimmer M, Byrne R, Aston-Jones G. Glutamate-associated plasticity in the ventral tegmental area is necessary for conditioning environmental stimuli with morphine. Neuroscience. 2004;129:841–847. doi: 10.1016/j.neuroscience.2004.09.018. [DOI] [PubMed] [Google Scholar]
- Harris GC, Wimmer M, Aston-Jones G. A role for lateral hypothalamic orexin neurons in reward seeking. Nature. 2005;437:556–559. doi: 10.1038/nature04071. [DOI] [PubMed] [Google Scholar]
- Harris GC, Wimmer M, Randall-Thompson JF, Aston-Jones G. Lateral hypothalamic orexin neurons are critically involved in learning to associate an environment with morphine reward. Behav Brain Res. 2007;183:43–51. doi: 10.1016/j.bbr.2007.05.025. [DOI] [PMC free article] [PubMed] [Google Scholar]
- Jodo E, Chiang C, Aston-Jones G. Potent excitatory influence of prefrontal cortex activity on noradrenergic locus coeruleus neurons. Neuroscience. 1998;83:63–79. doi: 10.1016/s0306-4522(97)00372-2. [DOI] [PubMed] [Google Scholar]
- Johnson SW, North RA. Two types of neurone in the rat ventral tegmental area and their synaptic inputs. J Physiol. 1992;450:455–468. doi: 10.1113/jphysiol.1992.sp019136. [DOI] [PMC free article] [PubMed] [Google Scholar]
- Jones S, Kauer JA. Amphetamine depresses excitatory synaptic transmission via serotonin receptors in the ventral tegmental area. J Neurosci. 1999;19:9780–9787. doi: 10.1523/JNEUROSCI.19-22-09780.1999. [DOI] [PMC free article] [PubMed] [Google Scholar]
- Karreman M, Moghaddam B. The prefrontal cortex regulates the basal release of dopamine in the limbic striatum: an effect mediated by ventral tegmental area. J Neurochem. 1996;66:589–598. doi: 10.1046/j.1471-4159.1996.66020589.x. [DOI] [PubMed] [Google Scholar]
- Kauer JA, Malenka RC. Synaptic plasticity and addiction. Nat Rev Neurosci. 2007;8:844–858. doi: 10.1038/nrn2234. [DOI] [PubMed] [Google Scholar]
- Kiyashchenko LI, Mileykovskiy BY, Maidment N, Lam HA, Wu MF, John J, Peever J, Siegel JM. Release of hypocretin (orexin) during waking and sleep states. J Neurosci. 2002;22:5282–5286. doi: 10.1523/JNEUROSCI.22-13-05282.2002. [DOI] [PMC free article] [PubMed] [Google Scholar]
- Korotkova TM, Sergeeva OA, Eriksson KS, Haas HL, Brown RE. Excitation of ventral tegmental area dopaminergic and nondopaminergic neurons by orexins/hypocretins. J Neurosci. 2003;23:7–11. doi: 10.1523/JNEUROSCI.23-01-00007.2003. [DOI] [PMC free article] [PubMed] [Google Scholar]
- Lee MG, Hassani OK, Jones BE. Discharge of identified orexin/hypocretin neurons across the sleep-waking cycle. J Neurosci. 2005;25:6716–6720. doi: 10.1523/JNEUROSCI.1887-05.2005. [DOI] [PMC free article] [PubMed] [Google Scholar]
- Léger L, Sapin E, Goutagny R, Peyron C, Salvert D, Fort P, Luppi PH. Dopaminergic neurons expressing Fos during waking and paradoxical sleep in the rat. J Chem Neuroanat. 2010;39:262–271. doi: 10.1016/j.jchemneu.2010.03.001. [DOI] [PubMed] [Google Scholar]
- Lodge DJ, Grace AA. The laterodorsal tegmentum is essential for burst firing of ventral tegmental area dopamine neurons. Proc Natl Acad Sci U S A. 2006;103:5167–5172. doi: 10.1073/pnas.0510715103. [DOI] [PMC free article] [PubMed] [Google Scholar]
- Lu XY, Churchill L, Kalivas PW. Expression of D1 receptor mRNA in projections from the forebrain to the ventral tegmental area. Synapse. 1997;25:205–214. doi: 10.1002/(SICI)1098-2396(199702)25:2<205::AID-SYN11>3.0.CO;2-X. [DOI] [PubMed] [Google Scholar]
- Luo AH, Georges FE, Aston-Jones GS. Novel neurons in ventral tegmental area fire selectively during the active phase of the diurnal cycle. Eur J Neurosci. 2008;27:408–422. doi: 10.1111/j.1460-9568.2007.05985.x. [DOI] [PubMed] [Google Scholar]
- Margolis EB, Lock H, Hjelmstad GO, Fields HL. The ventral tegmental area revisited: is there an electrophysiological marker for dopaminergic neurons? J Physiol. 2006;577:907–924. doi: 10.1113/jphysiol.2006.117069. [DOI] [PMC free article] [PubMed] [Google Scholar]
- Massi L, Elezgarai I, Puente N, Reguero L, Grandes P, Manzoni OJ, Georges F. Cannabinoid receptors in the bed nucleus of the stria terminalis control cortical excitation of midbrain dopamine cells in vivo. J Neurosci. 2008;28:10496–10508. doi: 10.1523/JNEUROSCI.2291-08.2008. [DOI] [PMC free article] [PubMed] [Google Scholar]
- McClung CA. Circadian rhythms, the mesolimbic dopaminergic circuit, and drug addiction. ScientificWorldJournal. 2007;7:194–202. doi: 10.1100/tsw.2007.213. [DOI] [PMC free article] [PubMed] [Google Scholar]
- Mereu G, Costa E, Armstrong DM, Vicini S. Glutamate receptor subtypes mediate excitatory synaptic currents of dopamine neurons in midbrain slices. J Neurosci. 1991;11:1359–1366. doi: 10.1523/JNEUROSCI.11-05-01359.1991. [DOI] [PMC free article] [PubMed] [Google Scholar]
- Mileykovskiy BY, Kiyashchenko LI, Siegel JM. Behavioral correlates of activity in identified hypocretin/orexin neurons. Neuron. 2005;46:787–798. doi: 10.1016/j.neuron.2005.04.035. [DOI] [PMC free article] [PubMed] [Google Scholar]
- Montague PR, Dayan P, Sejnowski TJ. A framework for mesencephalic dopamine systems based on predictive Hebbian learning. J Neurosci. 1996;16:1936–1947. doi: 10.1523/JNEUROSCI.16-05-01936.1996. [DOI] [PMC free article] [PubMed] [Google Scholar]
- Murase S, Grenhoff J, Chouvet G, Gonon FG, Svensson TH. Prefrontal cortex regulates burst firing and transmitter release in rat mesolimbic dopamine neurons studied in vivo. Neurosci Lett. 1993;157:53–56. doi: 10.1016/0304-3940(93)90641-w. [DOI] [PubMed] [Google Scholar]
- Muschamp JW, Dominguez JM, Sato SM, Shen RY, Hull EM. A role for hypocretin (orexin) in male sexual behavior. J Neurosci. 2007;27:2837–2845. doi: 10.1523/JNEUROSCI.4121-06.2007. [DOI] [PMC free article] [PubMed] [Google Scholar]
- Narita M, Nagumo Y, Hashimoto S, Narita M, Khotib J, Miyatake M, Sakurai T, Yanagisawa M, Nakamachi T, Shioda S, Suzuki T. Direct involvement of orexinergic systems in the activation of the mesolimbic dopamine pathway and related behaviors induced by morphine. J Neurosci. 2006;26:398–405. doi: 10.1523/JNEUROSCI.2761-05.2006. [DOI] [PMC free article] [PubMed] [Google Scholar]
- Omelchenko N, Sesack SR. Laterodorsal tegmental projections to identified cell populations in the rat ventral tegmental area. J Comp Neurol. 2005;483:217–235. doi: 10.1002/cne.20417. [DOI] [PubMed] [Google Scholar]
- Omelchenko N, Sesack SR. Glutamate synaptic inputs to ventral tegmental area neurons in the rat derive primarily from subcortical sources. Neuroscience. 2007;146:1259–1274. doi: 10.1016/j.neuroscience.2007.02.016. [DOI] [PMC free article] [PubMed] [Google Scholar]
- Overton PG, Clark D. Burst firing in midbrain dopaminergic neurons. Brain Res Brain Res Rev. 1997;25:312–334. doi: 10.1016/s0165-0173(97)00039-8. [DOI] [PubMed] [Google Scholar]
- Paladini CA, Williams JT. Noradrenergic inhibition of midbrain dopamine neurons. J Neurosci. 2004;24:4568–4575. doi: 10.1523/JNEUROSCI.5735-03.2004. [DOI] [PMC free article] [PubMed] [Google Scholar]
- Paladini CA, Fiorillo CD, Morikawa H, Williams JT. Amphetamine selectively blocks inhibitory glutamate transmission in dopamine neurons. Nat Neurosci. 2001;4:275–281. doi: 10.1038/85124. [DOI] [PubMed] [Google Scholar]
- Pan WX, Schmidt R, Wickens JR, Hyland BI. Dopamine cells respond to predicted events during classical conditioning: evidence for eligibility traces in the reward-learning network. J Neurosci. 2005;25:6235–6242. doi: 10.1523/JNEUROSCI.1478-05.2005. [DOI] [PMC free article] [PubMed] [Google Scholar]
- Paxinos G, Watson C. Ed 4. San Diego: Academic; 1998. The rat brain in stereotaxic coordinates. [DOI] [PubMed] [Google Scholar]
- Phillips AG, Vacca G, Ahn S. A top-down perspective on dopamine, motivation and memory. Pharmacol Biochem Behav. 2008;90:236–249. doi: 10.1016/j.pbb.2007.10.014. [DOI] [PubMed] [Google Scholar]
- Pinault D. A novel single-cell staining procedure performed in vivo under electrophysiological control: morpho-functional features of juxtacellularly labeled thalamic cells and other central neurons with biocytin or Neurobiotin. J Neurosci Methods. 1996;65:113–136. doi: 10.1016/0165-0270(95)00144-1. [DOI] [PubMed] [Google Scholar]
- Redgrave P, Gurney K, Reynolds J. What is reinforced by phasic dopamine signals? Brain Res Rev. 2008;58:322–339. doi: 10.1016/j.brainresrev.2007.10.007. [DOI] [PubMed] [Google Scholar]
- Roberts DC, Brebner K, Vincler M, Lynch WJ. Patterns of cocaine self-administration in rats produced by various access conditions under a discrete trials procedure. Drug Alcohol Depend. 2002;67:291–299. doi: 10.1016/s0376-8716(02)00083-2. [DOI] [PubMed] [Google Scholar]
- Roesch MR, Calu DJ, Schoenbaum G. Dopamine neurons encode the better option in rats deciding between differently delayed or sized rewards. Nat Neurosci. 2007;10:1615–1624. doi: 10.1038/nn2013. [DOI] [PMC free article] [PubMed] [Google Scholar]
- Rossetti ZL, Marcangione C, Wise RA. Increase of extracellular glutamate and expression of Fos-like immunoreactivity in the ventral tegmental area in response to electrical stimulation of the prefrontal cortex. J Neurochem. 1998;70:1503–1512. doi: 10.1046/j.1471-4159.1998.70041503.x. [DOI] [PubMed] [Google Scholar]
- Saal D, Dong Y, Bonci A, Malenka RC. Drugs of abuse and stress trigger a common synaptic adaptation in dopamine neurons. Neuron. 2003;37:577–582. doi: 10.1016/s0896-6273(03)00021-7. [DOI] [PubMed] [Google Scholar]
- Sakurai T. The neural circuit of orexin (hypocretin): maintaining sleep and wakefulness. Nat Rev Neurosci. 2007;8:171–181. doi: 10.1038/nrn2092. [DOI] [PubMed] [Google Scholar]
- Schreihofer AM, Guyenet PG. Identification of C1 presympathetic neurons in rat rostral ventrolateral medulla by juxtacellular labeling in vivo. J Comp Neurol. 1997;387:524–536. doi: 10.1002/(sici)1096-9861(19971103)387:4<524::aid-cne4>3.0.co;2-4. [DOI] [PubMed] [Google Scholar]
- Schultz W. Multiple dopamine functions at different time courses. Annu Rev Neurosci. 2007;30:259–288. doi: 10.1146/annurev.neuro.28.061604.135722. [DOI] [PubMed] [Google Scholar]
- Sesack SR, Pickel VM. Prefrontal cortical efferents in the rat synapse on unlabeled neuronal targets of catecholamine terminals in the nucleus accumbens septi and on dopamine neurons in the ventral tegmental area. J Comp Neurol. 1992;320:145–160. doi: 10.1002/cne.903200202. [DOI] [PubMed] [Google Scholar]
- Sesack SR, Deutch AY, Roth RH, Bunney BS. Topographical organization of the efferent projections of the medial prefrontal cortex in the rat: an anterograde tract-tracing study with Phaseolus vulgaris leucoagglutinin. J Comp Neurol. 1989;290:213–242. doi: 10.1002/cne.902900205. [DOI] [PubMed] [Google Scholar]
- Sesack SR, Carr DB, Omelchenko N, Pinto A. Anatomical substrates for glutamate-dopamine interactions: evidence for specificity of connections and extrasynaptic actions. Ann N Y Acad Sci. 2003;1003:36–52. doi: 10.1196/annals.1300.066. [DOI] [PubMed] [Google Scholar]
- Sun W, Akins CK, Mattingly AE, Rebec GV. Ionotropic glutamate receptors in the ventral tegmental area regulate cocaine-seeking behavior in rats. Neuropsychopharmacology. 2005;30:2073–2081. doi: 10.1038/sj.npp.1300744. [DOI] [PubMed] [Google Scholar]
- Sutcliffe JG, de Lecea L. The hypocretins: setting the arousal threshold. Nat Rev Neurosci. 2002;3:339–349. doi: 10.1038/nrn808. [DOI] [PubMed] [Google Scholar]
- Taber MT, Das S, Fibiger HC. Cortical regulation of subcortical dopamine release: mediation via the ventral tegmental area. J Neurochem. 1995;65:1407–1410. doi: 10.1046/j.1471-4159.1995.65031407.x. [DOI] [PubMed] [Google Scholar]
- Tepper JM, Young SJ, Groves PM. Autoreceptor-mediated changes in dopaminergic terminal excitability: effects of increases in impulse flow. Brain Res. 1984;309:309–316. doi: 10.1016/0006-8993(84)90598-5. [DOI] [PubMed] [Google Scholar]
- Thierry AM, Chevalier G, Ferron A, Glowinski J. Diencephalic and mesencephalic efferents of the medial prefrontal cortex in the rat: electrophysiological evidence for the existence of branched axons. Exp Brain Res. 1983;50:275–282. doi: 10.1007/BF00239191. [DOI] [PubMed] [Google Scholar]
- Tong ZY, Overton PG, Clark D. Stimulation of the prefrontal cortex in the rat induces patterns of activity in midbrain dopaminergic neurons which resemble natural burst events. Synapse. 1996;22:195–208. doi: 10.1002/(SICI)1098-2396(199603)22:3<195::AID-SYN1>3.0.CO;2-7. [DOI] [PubMed] [Google Scholar]
- Ungless MA, Magill PJ, Bolam JP. Uniform inhibition of dopamine neurons in the ventral tegmental area by aversive stimuli. Science. 2004;303:2040–2042. doi: 10.1126/science.1093360. [DOI] [PubMed] [Google Scholar]
- Vittoz NM, Berridge CW. Hypocretin/orexin selectively increases dopamine efflux within the prefrontal cortex: involvement of the ventral tegmental area. Neuropsychopharmacology. 2006;31:384–395. doi: 10.1038/sj.npp.1300807. [DOI] [PubMed] [Google Scholar]
- Vittoz NM, Schmeichel B, Berridge CW. Hypocretin/orexin preferentially activates caudomedial ventral tegmental area dopamine neurons. Eur J Neurosci. 2008;28:1629–1640. doi: 10.1111/j.1460-9568.2008.06453.x. [DOI] [PMC free article] [PubMed] [Google Scholar]
- Webb IC, Baltazar RM, Wang X, Pitchers KK, Coolen LM, Lehman MN. Diurnal variations in natural and drug reward, mesolimbic tyrosine hydroxylase, and clock gene expression in the male rat. J Biol Rhythms. 2009;24:465–476. doi: 10.1177/0748730409346657. [DOI] [PubMed] [Google Scholar]
- Wheeler RA, Carelli RM. Dissecting motivational circuitry to understand substance abuse. Neuropharmacology. 2009;56(Suppl 1):149–159. doi: 10.1016/j.neuropharm.2008.06.028. [DOI] [PMC free article] [PubMed] [Google Scholar]
- Wise RA. Dopamine, learning and motivation. Nat Rev Neurosci. 2004;5:483–494. doi: 10.1038/nrn1406. [DOI] [PubMed] [Google Scholar]
- Yoshida Y, Fujiki N, Nakajima T, Ripley B, Matsumura H, Yoneda H, Mignot E, Nishino S. Fluctuation of extracellular hypocretin-1 (orexin A) levels in the rat in relation to the light-dark cycle and sleep-wake activities. Eur J Neurosci. 2001;14:1075–1081. doi: 10.1046/j.0953-816x.2001.01725.x. [DOI] [PubMed] [Google Scholar]
- You ZB, Tzschentke TM, Brodin E, Wise RA. Electrical stimulation of the prefrontal cortex increases cholecystokinin, glutamate, and dopamine release in the nucleus accumbens: an in vivo microdialysis study in freely moving rats. J Neurosci. 1998;18:6492–6500. doi: 10.1523/JNEUROSCI.18-16-06492.1998. [DOI] [PMC free article] [PubMed] [Google Scholar]
- You ZB, Wang B, Zitzman D, Azari S, Wise RA. A role for conditioned ventral tegmental glutamate release in cocaine seeking. J Neurosci. 2007;27:10546–10555. doi: 10.1523/JNEUROSCI.2967-07.2007. [DOI] [PMC free article] [PubMed] [Google Scholar]
- Zheng H, Patterson LM, Berthoud HR. Orexin signaling in the ventral tegmental area is required for high-fat appetite induced by opioid stimulation of the nucleus accumbens. J Neurosci. 2007;27:11075–11082. doi: 10.1523/JNEUROSCI.3542-07.2007. [DOI] [PMC free article] [PubMed] [Google Scholar]