

Abstract
Background: Emerging evidence implicates white matter (WM) abnormalities in the pathophysiology of schizophrenia. However, there is considerable heterogeneity in the presentation of WM abnormalities in the existing studies. The object of this study was to evaluate WM integrity in a large sample of patients with first-episode (FE) and chronic schizophrenia in comparison to matched control groups. Our goal was to assess whether WM findings occurred early in the illness or whether these abnormalities developed with the illness over time. Methods: Participants included 114 patients with schizophrenia (31 FE and 83 chronic patients) and 138 matched controls. High-resolution structural and diffusion tensor images were obtained on all participants. Measures of fractional anisotropy (FA) were calculated for the 4 cortical lobes and the cerebellum and brain stem. Results: FA was significant lower in patients vs controls in the whole brain and individually in the frontal, parietal, occipital, and temporal lobes. FA was not significantly different in the brain stem or cerebellum. FA differences were significant only in patients with chronic schizophrenia and not in the FE group. Conclusions: We found global differences in the WM microstructure in patients with chronic but not FE schizophrenia. These findings suggest progressive alterations in WM microstructure.
Keywords: first-episode schizophrenia, fractional anisotropy, neuroimaging, DTI, microstructure
Introduction
Evidence from postmortem,1,2 magnetic resonance spectroscopy,3 and diffusion tensor imaging (DTI) studies4,5 implicates brain white matter (WM) abnormalities in the neurobiology of schizophrenia.6 WM forms the basis for high speed communication between brain regions, and disruption of WM pathways could potentially partially explain the vast array of clinical and cognitive symptoms associated with the illness.
There have now been more than 60 studies to date that have utilized DTI to evaluate the WM microstructure in patients with schizophrenia.5 One of the challenges in developing a unified understanding of the reported WM abnormalities is the variability in the reported locations of disrupted WM in schizophrenia. A review of DTI studies found an overrepresentation of fractional anisotropy (FA) reductions in the corpus callosum (CC), frontal WM, and the cingulum bundle.5 However, diverse abnormalities have also been identified in WM tracts in cortical, subcortical, and cerebellar regions. While the majority of these studies evaluate patients with chronic schizophrenia, studies of first-episode (FE) and early-onset schizophrenia (EOS) also have found lower FA in frontal and limbic regions. Finally, there is evidence for a worsening of WM abnormalities as individuals progress from FE to chronic schizophrenia,5,7 raising the question as to whether duration of illness (DOI), medication exposure, cohort effects, or illness-related environmental factors contribute to the greater differences in FA between patients and controls.
The majority of DTI studies utilize voxel-based (VB) techniques to study group differences between patients with schizophrenia and controls. The advantages of VB techniques include the ability to approach the data without a priori assumptions of the implicated regions of interest (ROIs) and greater efficiency of the analysis as compared with ROI analyses. The disadvantages of these techniques include the poor characterization of individual differences in the spatial location of specific brain regions, challenges associated with registration of the brains, and the multiple tests that require statistical correction. VB techniques are valuable and are continually being improved to address these challenges.
Because the majority of the DTI studies of schizophrenia utilize relatively small numbers of patients (n = 20–30), the purpose of this study was to utilize a multisite design to recruit a large number of subjects. The MIND Clinical Imaging Consortium was established as a collaborative multisite consortium that includes the Massachusetts General Hospital (MGH), the University of Iowa (Iowa), the University of Minnesota (Minn), and the University of New Mexico (NMex) and the MIND Research Network. Our goal was to include FE and chronic patients with schizophrenia, each with an associated matched control group in order to explore aberrant connectivity as a hypothesis in the pathogenesis of schizophrenia. In addition, because schizophrenia is associated with abnormalities that are not localized to any one brain region, our goal was to assess relatively large areas of the brain, including whole-brain FA and regional differences within each of the lobes, cerebellum, and the brain stem.
Methods
Participants
The participants consisted of 114 patients with schizophrenia and 138 controls matched by age, sex, and parental education level. Subjects were recruited from 4 sites: MGH, Iowa, Minn, and NMex. All subjects underwent an extensive clinical diagnostic assessment that included either the Structured Clinical Interview for the DSM-IV (SCID)8 or the Comprehensive Assessment of Symptoms and History (CASH).9 Both the SCID and CASH utilized Diagnostic and Statistical Manual of Mental Disorders, Fourth Edition, Text Revision criteria for the confirmation of diagnoses. Positive and negative symptoms were rated using the Scale for the Assessment of Positive Symptoms (SAPS)10 and the Scale for the Assessment of Negative Symptoms (SANS).11 The consortium study included a total cohort of 385 subjects; however, we report on the subset of those for who had DTI data that could be analyzed. In the image processing methods, we indicate the criteria used for exclusion of imaging data. Importantly, the cohort included (65% of the total) did not differ in any systematic way from the total cohort.
The clinical group consisted of patients characterized as either chronic or FE schizophrenia. The FE group consisted of patients in their first psychotic episode who had received fewer than 6 months of antipsychotic medications. The sample consisted of 31 FE and 83 chronic patients diagnosed with a schizophrenia spectrum disorder. The demographic information for the patient and control groups and the clinical characteristics of the patients at each site are provided in tables 1–2, respectively.
Table 1.
Within-Site Demographics and Clinical Data of Patients With Schizophrenia and Controls
| Patients (n = 114) |
Controls (n = 138) |
|||||||
| MGH | Iowa | Minnesota | New Mexico | MGH | Iowa | Minnesota | New Mexico | |
| Number | 27 | 19 | 27 | 41 | 21 | 52 | 22 | 43 |
| Age (y, SD) | 36.3 (10.7) | 31.5 (10.2) | 31.3 (10.1) | 33.1 (12.6) | 40.1 (8.0) | 30.8 (10.4) | 28.9 (8.9) | 28.7 (11.6) |
| Sex (M/F) | 19/8 | 15/4 | 18/9 | 32/9 | 12/9 | 23/29 | 12/10 | 34/9 |
| Hand (R/L/both) | 26/1/1 | 17/0/2 | 22/2/2 | 35/3/2 | 19/1/0 | 49/2/1 | 21/0/1 | 38/5/0 |
| WRAT3RT | 45.5 (7.2) | 49.1 (4.8) | 46.0 (6.6) | 47.4 (5.8) | 53.2 (3.6) | 50.2 (4.2) | 50.9 (3.7) | 49.7 (5.1) |
| Father's education | 13.8 (3.9) | 15.4 (3.2) | 13.8 (3.5) | 14.0 (3.9) | 13.6 (3.4) | 14.5 (2.8) | 15.5 (2.5) | 15.7 (3.9) |
| Mother's education | 14.1 (3.0) | 14.9 (3.4) | 12.8 (3.0) | 12.9 (4.0) | 13.3 (3.2) | 13.7 (2.0) | 15.2 (2.5) | 13.8 (3.2) |
| BMI | 30.6 (6.3) | 28.2 (4.2) | 28.1 (7.0) | 25.5 (5.6) | 25.2 (4.2) | 25.8 (5.7) | 25.3 (5.3) | 26.0 (4.8) |
Note: MGH, Massachusetts General Hospital; WRAT3RT; Wide Range Achievement Test—3rd Edition, reading test; BMI, body mass index.
Demographics and Clinical Data of Patients With Schizophrenia and Controls Collapsed across Sites (Smaller Version of Table 1)
| Patients (n = 114) |
Controls (n = 138) |
P | |||
| Chronic (n = 83) | FE (n = 31) | Chronic Controls (n = 95) | FE Controls (n = 43) | ||
| Age (y, SD) | 36.4 (11.0) | 25.2 (6.7) | 34.0 (11.3) | 25.2 (6.6) | <.001a |
| Sex (M/F) | 62/21 | 22/9 | 57/38 | 24/19 | <.05b |
| Hand (R/L/both) | 73/3/6 | 26/3/1 | 86/5/3 | 41/2/0 | |
| WRAT3RT | 46.8 (6.2) | 47.1 (6.6) | 50.8 (4.5) | 50.2 (3.9) | <.001b |
| Father's education | 14.3 (3.3) | 13.9 (4.7) | 15.0 (3.7) | 14.6 (2.3) | |
| Mother's education | 13.3 (3.6) | 14.1 (3.2) | 13.8 (2.9) | 14.1 (2.3) | |
Note: FE, first episode; WRAT3RT; Wide Range Achievement Test—3rd Edition, reading test.
Between chronic and FE patients.
Between patients and controls.
τP < .01.
Healthy volunteers matched for age, sex, and handedness were recruited from the community through medical clinics and advertisements in local newspapers. The control subjects were excluded if they had a physical or neurological disorder affecting brain function (ie, head injury, seizure disorder) or a lifetime history of any Axis I psychiatric disorder, including substance abuse or dependence. A diagnosis of schizophrenia or bipolar disorder in a first-degree relative was also exclusionary. Recruitment into the study was performed only after written informed consent was obtained. The study was approved by the institutional review boards at each of the 4 sites.
Of the 83 patients diagnosed with chronic schizophrenia at the time of scanning, 57 were on atypical antipsychotics only, 8 were on typical antipsychotic only, 3 were on both an atypical and typical antipsychotic, and 6 were not on medications at the time of scanning. Within the atypical antipsychotic group, 12 were on clozapine only and 5 were on clozapine in addition to another atypical. Twenty-three of those in the FE group were on atypical antipsychotics, and none were on either a typical antipsychotic or clozapine. Antipsychotic dose years (1 dose year = 100 chlorpromazine equivalents per day for 1 year12) for the patient groups are provided in table 2.
Image Acquisition and Processing
The image acquisition parameters for the high-resolution structural and diffusion tensor images are presented in table 3. The anatomical images were analyzed using BRAINS2.13 This produced a skull-stripped T1-weighted image and a WM mask. The skull-stripped T1-weighted image was coregistered with an AC-PC aligned atlas image using a rigid registration to a scaled version of the atlas image to account for linear stretching along each axis. The Talairach parameters were defined for the subject based on an affine registration of the atlas image into the raw subject space allowing the Talairach atlas to be warped onto each subject. The T2-weighted image was then coregistered with the AC-PC aligned T1-weighted image. Tissue classification was performed using a multimodal tissue classification.14
Table 2.
Clinical Characteristics of Patients With FE and Chronic Schizophrenia
| Clinical Measures | Chronic Patients | FE Patients | ||
| Years of Illness | 13.6 (10.8) (n = 83) | 2.1 (3.0) (n = 31) | ||
| Dose years antipsychotics | 294.5 (2044.6) CPE (n = 78) | 0.64 (1.1) CPE (n = 31) | ||
| Diagnostic subtypes | Iowa | MGH | UMinn | NMex |
| Paranoid | 10 | 15 | 19 | 17 |
| Disorganized | 1 | 3 | 1 | 0 |
| Undifferentiated | 7 | 2 | 3 | 9 |
| Residual | 0 | 0 | 0 | 6 |
| Schizoaffective disorder | 1 | 1 | 1 | 2 |
| Schizophreniform | 0 | 1 | 3 | 2 |
| SANS/SAPS scores | ||||
| Positive | 4.4 (2.8) | 5.6 (2.2) | ||
| Negative | 7.2 (3.7) | 8.4 (4.1) | ||
| Disorganized | 1.5 (1.7) | 1.8 (1.9) | ||
Note: FE, first episode; CPE, chlorpromazine equivalents (a CPE of 100 = 100 mg/day for 1 y).
The diffusion weighted images were analyzed using the GTRACT program.15 The diffusion weighted images were first coregistered to the B0 image using a mutual information image registration to correct for motion and distortions caused by eddy currents. The images were median filtered, and the diffusion tensor was estimated. Scalar measures for FA were calculated on the DTI images for all subjects.16
The B0 image was then coregistered with the skull-stripped T1-weighted anatomical image from BRAINS2 using a rigid body transformation and a mutual information metric similarity metric. Next, a B-spline transform was applied to remove distortion in the echo-planar images resulting from susceptibility changes at air tissue interfaces.15 The resulting transforms were applied to the scalar maps placing them into the space of the anatomical image.
Measurements of FA were obtained for the whole brain, cerebellum, and brain stem WM using the following equation:
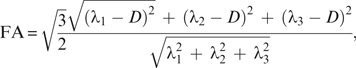 |
where D is the diffusion tensor and the λ’s are the 3 eigenvalues.
In addition, FA measures were obtained for the frontal, temporal, parietal, and occipital lobes as well as lateralized measures for all regions utilizing Talairach parameters.17 The WM mask was defined for each individual as the intersection between the segmented WM obtained from the structural image and FA image with a threshold of 0.1. This combination of structural and DTI images eliminated regions of signal loss resulting from magnetic susceptibility differences. Regional brain measures were obtained using BRAINS2.
Statistical Analyses
The evaluation of differences between patients and controls on demographic measures were initially performed using t-test and χ2 analyses. Site by demographic differences were evaluated with a one-way analysis of variance (ANOVA). Within-site demographic variables of patients vs controls were evaluated using χ2 for discrete data or a one-way ANOVA for continuous data. To assess whether certain structures had greater variability, a coefficient of variability (CoV) was determined for each brain region. Because there were significant site-related differences in FA, site and age were both used as a covariates in the analysis of covariance (ANCOVA). FA measures were also converted to z scores within site and combined to provide measures of effect sizes for the graphical representation of the findings. The evaluation of FA within the brain regions using an ANCOVA with site and age as a covariates was no different from using the z-transformed FA in an ANCOVA with age as a covariate.
Because differences were present in the number of patients and controls within each of the 4 sites, a secondary analysis was performed using a subset of the data that was closely matched within each site. Matching for this subset was performed using a minimum bipartite matching algorithm which minimizes the sum of edge weights between 2 sides of a bipartite graph.18 In our case, the 2 sides were represented by patients and controls and the weights were the age differences between a given patient and control. An independent bipartite graph was also created for each sex at each site, resulting in 2 matchings per site. Combining these matches results in age- and sex-matched subjects within each site. This matching algorithm resulted in 103 patients and an equal number of controls in which the above analyses were repeated.
Age-related differences were evaluated utilizing Pearson correlation coefficients. Due to nonlinearity in DOI and dose years of medication, Spearman rank correlations were used to assess the relationship between DOI, dose years of medication, and FA measures within brain regions. Finally, a localized regression analysis with an optimized smoothing parameter (localized regression [LOESS] procedure in SAS) was performed to obtain qualitative measures of the age-related trajectory of FA in both patients and controls. The LOESS procedure has the advantage of being more flexible and allowing for nonlinear registration. All statistical analyses were performed utilizing the SAS statistical package (Cary, NC).
Results
Demographic and Clinical Variables
The mean ages of the patients and controls were 33.3 (SD 11.2) and 31.2 (SD 10.9) years, respectively. There were no differences between the patients and controls in age, handedness, or in the educational level attained by the father or the mother (table 1). The patient group consisted of 84 males and 30 females (74% male), whereas the control group consisted of 81 males and 57 females (59% male). Thus, the patient group had a higher proportion of males compared with the control group (chi-square 6.2, df = 1, P = .01). These sex differences were evaluated by including sex as a covariate in the analyses and by repeating the analyses in a smaller age- and sex-matched sample.
There was a significant difference between patients and controls on the Wide Range Achievement Test—3rd Edition, reading test (WRAT3RT) (t = 5.46, df = 246, P < .001). The mean WRAT3RT for patients was 46.9 (SD 6.3) compared with 50.6 (SD 5.0) for the controls. Highest level of education obtained was also significantly different between the patient and control groups (t = 7.1, df = 244, P < .0001). The patients completed on average 13.6 (SD 2.6) years of education compared to 15.7 (SD 2.2) years completed by the controls.
Scores on the SANS and SAPS in the patient group had a mean positive symptom score of 4.7 (SD 2.7), negative symptom of 7.5 (SD 3.8), and disorganized symptoms score of 1.6 (SD 1.8). There were no site differences for the patients on either positive, negative, or disorganized symptoms. The mean number of years since diagnosis and entry into the study was 10.7 (SD 10.7). There were no site-related differences in the log-transformed total number of years since diagnosis between sites. The mean number of years since diagnosis for each site is provided in table 2. To test whether there were site-related differences in diagnostic subtypes, we collapsed subtypes to compare with the paranoid subtype. We found no significant site-related differences between the paranoid subtype and the other subtypes of schizophrenia. The diagnostic subtypes for schizophrenia are presented in table 2. Finally, a one-way ANOVA revealed no site-related differences in total dose years of antipsychotic medications, atypical dose years, or typical dose years.
Site Differences in Measures of FA
The mean FA values at the 4 sites for whole brain, the frontal, temporal, parietal, and occipital lobes, the cerebellum, and the brain stem are shown in figure 1. A one-way ANOVA revealed significant site differences in FA values in all brain regions (F‘s between 12 and 180). The site differences remained highly significant when controlling for age and sex, and thus, site was used as a covariate in all analyses. To graphically represent the data, the FA measures were z-transformed within site to preserve the within-site patient control differences, while allowing for a standardization of the scanner platform-dependent differences. This provided for the visual representation of the effect sizes of the pooled data.
Fig. 1.

Site-Related Differences in Mean Fractional Anisotropy Measures Within Specific White Matter Brain Regions in Entire Cohort.
CoV in FA for each of the brain structures were similar between each of the 4 sites. The CoV was the lowest for the whole brain measure at Iowa (5.0), MGH (6.7), and NMex (6.5). The lowest CoV at UMinn was the temporal lobe (6.8), with the whole brain close at 7.2. The highest CoV was the occipital lobe for Iowa (7.1) and NMex (8.2); the brain stem at MGH (10.0) and UMinn (13.1).
FA Differences between Patients vs Controls
A one-way ANCOVA with site, age, and sex as covariates demonstrated that patients had significantly lower FA in the whole brain (F1,244 = 20.5, P < .0001) as well as in the frontal (F1,244 = 23.2, P < .0001), parietal (F1,244 = 15.1, P < .0001), occipital (F1,244 = 13.7, P < .0003), and temporal lobes (F1,244 = 6.9, P < .009). FA was not significantly different in either the brain stem (F1,244 = 0.9, P = .35) or the cerebellum (F1,244 = 0, P = .98). There was a small but significant negative correlation between age and the whole-brain FA (r = −.28, P < .0001), as well as in the frontal (r = −.28, P < .0001), parietal (r = −.29, P < .0001), temporal (r = −.24, P = .0001), and occipital (r = −.24, P = .0002) lobes. This supports the use of age as a covariate, and age effects of FA have been described in the literature.19 Age and FA were not significantly correlated for either the cerebellum (r = −.10) and the brain stem (r = −.07).
To assess whether the regional brain FA differences between patients and controls were present within each site, we performed separate analyses with data within each of the 4 sites. The effect sizes of the differences between patients and controls for each site are shown in figure 2. An ANCOVA using age and sex as covariates found significant within-site differences at MGH for the whole brain (F1,44 = 5.4, P = .02), frontal (F1,44 = 4.5, P = .04), parietal (F1,44 = 6.3, P = .02), and occipital (F1,44 = 5.2, P = .03). Similarly, UMinn had significant differences in the whole brain (F1,45 = 10.3, P = .002), frontal (F1,45 = 19.7, P < .0001), parietal (F1,45 = 5.3, P = .03), and occipital (F1,45 = 8.5, P = .005). NMex had significant FA differences in the whole brain (F1,80 = 5.3, P = .02) and in the frontal (F1,80 = 8.3, P = .005) and parietal (F1,80 = 4.8, P = .03) lobes but not in the occipital lobes. The Iowa site had no significant FA differences between patients and controls in any of the brain regions tested, although the data from Iowa trended in the same direction as from the other sites (figure 2).
Fig. 2.

Within-Site Differences in Fractional Anisotropy Measures on Cortical White Matter Between Patients With Schizophrenia and Controls. The z-transformed data are equivalent to effect sizes for the patient/control differences.
FA Differences in FE Patients
A series of ANCOVAs were performed to evaluate differences between the chronic patients, FE patients, and their respective controls groups (Tables 4 and 5). FA differences were found in the comparison between the chronic patients and their matched control group (figure 3). The results paralleled the results seen with the combined FE and chronic comparison. Interestingly, none of the regions that were significant in the chronic patients were found to be significant in a comparison between the FE patient vs FE control groups (table 4). An ANCOVA comparing the chronic vs FE patients groups found no significant differences between the 2 groups, although there was a trend for the chronics to have lower FA than the FE patients (F1,107 = 3.6, P = .06).
Table 3.
High-Resolution Structural and DTI Parameters at Each of the 4 Sites
| Iowa | MGH | UMinn | NMex | |
| High-resolution structural images | ||||
| Scanner | Siemens 1.5 T Sonata | Siemens 1.5 T Avanto | Siemens 3 T TRIO | Siemens 1.5 T Avanto |
| TR (ms) | 20 | 12 | 2530 | 12 |
| TE (ms) | 6 | 4.76 | 3.79 | 4.76 |
| TI (ms) | NA | NA | 1100 | NA |
| Flip angle (degrees) | 20 | 20 | 7 | 20 |
| In-plane voxel dimensions (mm) | 0.625 × 0.625 | 0.625 × 0.625 | 0.625 × 0.625 | 0.625 × 0.625 |
| Slice thickness (mm) | 1.5 | 1.5 | 1.5 | 1.5 |
| NEX | 3 | 1, acquired 3 identical scans | 1, acquired 3 identical scans | 1, acquired 3 identical scans |
| Bandwidth (Hz/pixel) | 122 | 110 | 181 | 110 |
| Diffusion tensor images | ||||
| Scanner | Siemens 3T TRIO | Siemens 1.5 T Sonata | Siemens 3T TRIO | Siemens 1.5 T Sonata |
| TR (ms) | 9500 | 8900 | 10 500 | 9800 |
| TE (ms) | 90 | 80 | 98 | 86 |
| Voxel dimensions (mm) | 2 × 2 × 2 | 2 × 2 × 2 | 2 × 2 × 2 | 2 × 2 × 2 |
| Diffusion directions | 6 | 60 | 12 | 12 |
| B values (s/mm2) | 0/1000 | 0/700 | 0/1000 | 0/1000 |
| NEX | 4 | 1 | 2 | 4 |
| Bandwidth (Hz/pixel) | 1954 | 1860 | 1342 | 1502 |
Note: DTI, diffusion tensor imaging; TR, repetition time; TE, echo time; TI, inversion time; NEX, number of excitations; NA, not applicable.
Table 4.
Measures of FA in Chronic and FE Patients and Controls
| Least-Square Mean FA Values |
ANCOVA Results |
|||||||
| Chronic Patients | Chronic Controls | FE Patients | FE Controls | Combined Patients vs Controls | Chronic Patients vs Chronic Controls | FE Patients vs FE Controls | FE Patients vs Chronic Patients | |
| Brain | 0.257 | 0.268 | 0.266 | 0.267 | F1,245 = 20.3 | F1,171 = 18.7 | F1,68 = 0.8 | F1,108 = 0.1 |
| P < .0001 | P < .0001 | NS | NS | |||||
| Cerebellum | 0.249 | 0.249 | 0.252 | 0.246 | F1,245 = 0.2 | F1,171 = 0.2 | F1,68 = 1.5 | F1,108 = 1.0 |
| NS | NS | NS | NS | |||||
| Brain stem | 0.304 | 0.310 | 0.316 | 0.308 | F1,245 = 0.4 | F1,171 = 0.4 | F1,68 = 1.6 | F1,108 = 2.4 |
| NS | NS | NS | NS | |||||
| Brain lobes | ||||||||
| Frontal | 0.281 | 0.298 | 0.291 | 0.294 | F1,245 = 24.3 | F1,171 = 27.7 | F1,68 = 0.3 | F1,108 = 3.6 |
| P < .0001 | P < .0001 | NS | P = .06 | |||||
| Parietal | 0.289 | 0.300 | 0.292 | 0.299 | F1,245 = 14.9 | F1,171 = 13.6 | F1,68 = 0.7 | F1,108 = 0.3 |
| P < .0001 | P = .0003 | NS | NS | |||||
| Temporal | 0.258 | 0.264 | 0.259 | 0.263 | F1,245 = 5.9 | F1,171 = 5.0 | F1,68 = 0.1 | F1,108 = 0.1 |
| P < .02 | P < .03 | NS | NS | |||||
| Occipital | 0.199 | 0.208 | 0.202 | 0.209 | F1,245 = 13.7 | F1,171 = 11.9 | F1,68 = 1.2 | F1,108 = 0.3 |
| P = .0003 | P = .0007 | NS | NS | |||||
Note: FA, fractional anisotropy; FE, first episode; ANCOVA, analysis of covariance; NS, nonsignificant. ANCOVA results used both site and age as covariates.
Fig. 3.

Differences in z-Transformed Fractional Anisotropy Measures on Cortical White Matter Between FE and Chronic Patients With Schizophrenia and Controls. The z score for the chronic control group was set to zero.
Paired t-tests were used to evaluate laterality in the measures of FA for each of the brain regions. The right cerebellum had significantly higher mean FA in all 4 groups: chronic patients (t = 2.5, P = .01), control group matched to the chronic patients (t = 6.0, P < .0001), FE patients (t = 3.8, P < .0006), and control group matched to the FE patients (t = 4.8, P < .0006). In addition, the FE patients (t = 2.6, P = .01), the FE controls (t = 3.3, P = .002), and the chronic control (t = 3.9, P = .0002) groups had higher FA in the right occipital lobe. The chronic patient group had a similar finding in the occipital lobe at the trend level (t = 1.9, P = .06). Repeating the ANOVA on lateralized measures resulted in significant differences between patients and controls in all the same brain regions identified using the combined left and right brain regions.
Analyses between the full cohort of patients and controls and the additional analyses comparing the chronic patients and their matched controls, FE patients and their matched controls, and chronic vs FE patients were also performed in an age- and sex-matched subset of the larger sample. This sample included 76 patients with chronic schizophrenia and 27 FE patients with an equally matched number of controls corresponding to each group. Analyses performed on this closely matched sample did not differ significantly from the larger sample (table 5).
DOI and Medication Effects on FA
The high intercorrelation between age, DOI, and total dose years of antipsychotics (ADY) provides a challenge for teasing apart the contributions toward reduced FA for each of these variables. The Spearman rank correlation between the DOI and ADY for the chronic group was 0.69 (P < .0001). Subject age was highly correlated with both the DOI (r = .80, P < .0001) and ADY (r = .59, P < .0001).
Overall, correlations between the brain FA measures with age, DOI, and dose years of antipsychotic medications were small (table 6). These analyses were also performed while adjusting for the ADY and DOI, respectively. There was a negative correlation between DOI and frontal lobe FA (r = −.19, P = .05). Controlling for ADY, there was no long a significant correlation between the frontal lobe FA and DOI. There was a negative correlation between ADY and FA in multiple brain regions, including the whole brain (r = −.23, P = .01) and in all 4 lobes (table 6).
Table 5.
Measures of Fractional Anisotropy in Chronic and FE Patients and Closely Matched Controls
| Least-Square Mean FA Values |
ANCOVA Results |
|||||||
| Chronic Patients | Chronic Controls | FE Patients | FE Controls | Combined Patients vs Controls | Chronic Patients vs Chronic Controls | FE Patients vs FE Controls | FE Patients vs Chronic Patients | |
| Brain | 0.257 | 0.270 | 0.263 | 0.265 | F1,200 = 18.4 | F1,146 = 20.4 | F1,48 = 0.5 | F1,97 = 2.1 |
| P < .0001 | P < .0001 | NS | NS | |||||
| Cerebellum | 0.248 | 0.251 | 0.254 | 0.247 | F1,200 = 0 | F1,146 = 2.4 | F1,48 = 1.4 | F1,97 = 2.1 |
| NS | P < .0001 | NS | NS | |||||
| Brain stem | 0.303 | 0.310 | 0.320 | 0.311 | F1,200 = 0.5 | F1,146 = 20.4 | F1,48 = 1.2 | F1,97 = 2.1 |
| NS | P < .0001 | NS | NS | |||||
| Brain lobes | ||||||||
| Frontal | 0.281 | 0.300 | 0.293 | 0.296 | F1,200 = 24.9 | F1,146 = 28.2 | F1,48 = 0.4 | F1,97 = 4.9 |
| P < .0001 | P < .0001 | NS | P < .03 | |||||
| Parietal | 0.290 | 0.301 | 0.294 | 0.296 | F1,200 = 10.5 | F1,146 = 11.2 | F1,48 = 0.2 | F1,97 = 0.8 |
| P = .001 | P = .001 | NS | NS | |||||
| Temporal | 0.258 | 0.266 | 0.262 | 0.261 | F1,200 = 6.4 | F1,146 = 9.0 | F1,48 = 0.1 | F1,97 = 1.0 |
| P < .01 | P = .003 | NS | NS | |||||
| Occipital | 0.200 | 0.211 | 0.204 | 0.206 | F1,200 = 12.8 | F1,146 = 14.7 | F1,48 = 0.3 | F1,97 = 0.6 |
| P = .0004 | P = .0002 | NS | NS | |||||
Note: FA, fractional anisotropy; FE, first episode; ANCOVA, analysis of covariance; NS, nonsignificant. ANCOVA results used both site and age as covariates.
Table 6.
Spearman Rank Correlations Between FA in Specific Brain Regions and Age, Duration of Illness, and Dose Years of Antipsychotic Medications
| Age (n = 114) | DOI (n = 113) | DOI (Adjusting for Dose Years) (n = 113) | Dose Years of Medication (n = 113) | Dose Years of Medication (Adjusting for DOI) (n = 113) | |
| Brain | r = −.27 | r = −.15 | r = .02 | r = −.23 | r = −.19 |
| P = .003 | NS | NS | P = .01 | P = .05 | |
| Cerebellum | r = .0 | r = .09 | r = .17 | r = −.06 | r = −.16 |
| NS | NS | NS | NS | NS | |
| Brain stem | r = −.01 | r = .02 | r = −.06 | r = .11 | r = .12 |
| NS | NS | NS | NS | NS | |
| Brain lobes | |||||
| Frontal | r = −.25 | r = −.19 | r = −.05 | r = −.22 | r = −.12 |
| P = .007 | P = .05 | NS | P = .02 | NS | |
| Parietal | r = −.25 | r = −.13 | r = .02 | r = −.20 | r = −.16 |
| P = .008 | NS | NS | P = .04 | NS | |
| Temporal | r = −.23 | r = −.11 | r = .05 | r = −.21 | r = −.18 |
| P = .01 | NS | NS | P = .03 | P = .06 | |
| Occipital | r = −.21 | r = −.07 | r = .09 | r = −.20 | r = −.21 |
| P = .03 | NS | NS | P = .03 | P = .03 | |
Note:FA, fractional anisotropy; DOI, duration of illness.
The FE group included 23 patients who were on medication and 8 patients who were not on medications at the time of scanning. A 4 (site) by 2 (naive/nonnaive) ANCOVA with age as a covariate found no differences between those who were neuroleptic naive compared with those who were not.
The large number of subjects coupled with the variability in ADY and DOI allowed for an alternative approach to tease apart DOI and medication exposure on global and regional brain FA measures. To assess the effects of medications on brain FA measures, we further analyzed the data from a subgroup of 22 patients who had a DOI between 20 and 40 years. The mean age for this group was 46.3 years (SD 5.3), the range of ADY was between 6.4 and 1023, and the correlation between the DOI and ADY was 0.07. The Spearman rank correlations were generally low with the cerebellum (r = −.23) having the highest absolute correlation, which was nonsignificant.
A subgroup of 45 patients with similar ADY but with considerable variability in DOI was selected for additional analyses. The mean age of this group was 40.1 years (SD 10.0) and the DOI ranged between 0 and 42 years and the ADY was between 17.9 and 145.9. This patient subgroup had a nonsignificant correlation between the DOI and ADY (r = .14, P = .36). A Spearman rank correlation resulted in no significant correlations between DOI and FA, although the frontal lobe had the highest negative correlation (r = −.24, P = .10).
Relationship Between Clinical Variables and FA
Because there were site-related FA differences in findings between patients and controls, exploratory analyses were performed to evaluate the role of clinical variables. To limit multiple testing, this was performed in a 2-stage process. First, either a chi-square for categorical data or an ANOVA for continuous data was performed to assess for site differences in that clinic variable. Those measures that had significant differences in site underwent subsequent analyses to determine if they influenced FA.
A history of alcohol abuse, but not alcohol dependence, had a significant effect of site (χ2 = 8.2, df = 3, P = .04). Iowa and NMex both had lower rates (21% and 17%, respectively) compared with MGH and UMinn, who had rates of 44% and 41%, respectively). A 4 (site) by 2 (alcohol abuse) ANCOVA with age as a covariate found those who did not have a history of alcohol abuse had significantly higher FA in the whole brain (F1,108 = 4.5, P = .04), frontal lobe (F1,108 = 5.7, P = .02), and parietal lobe (F1,108 = 5.1, P = .03).
Both a history of cannabis abuse (χ2 = 10.5, df = 3, P = .02) and cannabis dependence (χ2 = 15.4, df = 3, P = .001) had a significant effects of site. For cannabis abuse, once again Iowa and NMex both had lower rates (16% and 23%, respectively) compared with MGH and UMinn, who both had rates of 44%). For cannabis dependence, Iowa had none, whereas NMex had a rate of 10%, MGH had a rate of 41%, and UMinn had a rate of 22%. However, neither cannabis abuse or dependence showed a significant effect on any of the brain measures.
Discussion
We demonstrate global WM differences in FA in a large sample of patients with schizophrenia. Differences were present in the whole brain, and individually in the frontal, temporal, parietal, and occipital lobes, but were not present in either the brain stem or the cerebellum. The abnormalities were more pronounced in patients with chronic schizophrenia in contrast to the FE patients. The differences in chronic patients also had larger effect sizes compared with the FE patients, lessening the chance that the difference is a result of the larger sample size for the chronic patients. We found that only frontal lobe WM demonstrated a significant difference between the FE and chronic patients.
Disrupted connectivity between brain regions is a potential hypothesis that may explain the global nature and diversity of deficits in schizophrenia.6,20 Alterations in distributed neural networks, evidenced by abnormalities in WM, could account for the global nature of the clinical, cognitive, and social cognitive symptoms that are a hallmark of the illness. WM disruptions have been supported by the over 60 DTI papers that report aberrant WM microstructure in the pathophysiology of schizophrenia.5 While, there is considerable heterogeneity in the results of these studies, taken together, they provide strong support for WM abnormalities in the pathophysiology of schizophrenia. This is especially notable for pathways involving interhemispheric connections and frontal and limbic WM.
The neuropathological changes responsible for lower FA in patients with schizophrenia are yet unknown. It has been postulated to reflect abnormalities in myelination, oligodendrocytes, neuronal loss, disruption of the integrity of the cell membrane, or alterations in fiber orientation. Perhaps one of the more interesting findings of the current study is the reduced likelihood that altered fiber orientation, such as crossing fibers, would account for the decreases in FA. It is likely that differences as a result of crossing fibers would be equally present in the FE and chronic groups. Although better studied using longitudinal designs, our findings suggest a progressive decrease in FA as patients progress from FE into chronic schizophrenia. Such a progression is also supported in a review of the DTI literature in schizophrenia,5 a recent DTI study comparing FE and chronic patients,7 and is consistent with a number of structural imaging studies.21–25
Longitudinal magnetic resonance imaging studies early in the illness have documented progression of volume loss in the frontal regions after 2.5 years,26 both cerebral hemispheres after 4 years,22 parietal, frontal, temporal gray matter, and hippocampus after 4 years,23,25 frontal WM after 3 years,21 and ventricular enlargement after 2.5 years in patients with persistent symptoms.24 It has been proposed that this early brain volume reduction stabilizes in early adulthood27; however, a recent review suggests that progressive atrophy occurs even later in the illness.28
What mechanism may account for progressive FA reduction as well as white and gray matter volume losses previously described in adults with schizophrenia? Hypofunction of N-methyl-D-aspartic acid receptors in gamma-aminobutyric acid interneurons resulting in a paradoxical downstream glutamatergic excitotoxic process has been proposed.29–31 Consistently, cortical neuropil reductions without neuronal loss or gliosis have been found in postmortem studies.32,33 Hence, excessive cortical synaptic pruning with neuropil contractions and subsequent axonal microstructural dysfunction may account for the greater FA reductions in chronically treated compared with the FE patients in our study. However, other possible explanations include a neuroplastic adaptation to psychosocial impoverishment or treatment effects.34
With the suggestion of a progression of WM changes, we explored underlying factors contributing to these observed group differences. While it was somewhat difficult to tease apart whether lower FA was associated with DOI from the effects of medication, there is evidence that it is more associated with medication effects, although it is difficult to parse out the effects of multicollinear variables. Mori et al.35 reported an age-dependent decline in FA in schizophrenia that was correlated with DOI rather than medication; however, the variable of ‘current dose of antipsychotic medication’ was used and this does not provide information about the cumulative dose of antipsychotic exposure.
Studies tend to lump the different antipsychotics into 1 or 2 categories to increase power. However, different atypical antipsychotics will have different effects on the neurochemistry. These neurochemical differences may decrease associations seen between FA and ADY. Overall, we report relatively low correlations between FA measures and DOI and total dose years of medications, although the variability in FA in cross-sectional studies likely considerably impacts the correlation. Thus, the question of a progressive decrease in FA and the underlying cause is best addressed in a longitudinal study of FA in schizophrenia.
Interestingly, by including both an FE and chronic sample, we were able identify FA differences in the frontal lobe between these 2 groups. The differences in DOI in the current literature may account for some of the heterogeneity of findings. Studies have reported lower FA in the frontal, parietal, temporal, and occipital lobes in patients with schizophrenia.5 The frontal lobe tends to have a larger number of studies identifying abnormalities, although this may be a result of it being a target for a number of ROI studies. Alternatively, because frontal WM development tends to progress into early adulthood, greater frontal WM deficits in chronic patients may correspond with a cessation or failure to maintain typical developmental trajectories, rather than WM pathophysiologic changes. Future cross-sectional and longitudinal studies using DTI in schizophrenia will need to consider the stage of the illness and development of the participants.
There are several limitations to the study. We performed a number of different statistical analyses adjusting for multiple comparisons in the initial analysis but not in the post hoc tests. Adjusting for multiple comparisons would allow the findings of lower FA in the frontal, parietal, and occipital lobe, but the finding in the temporal lobe in chronic patients would not survive Bonferroni correction. In addition, the finding of lower frontal FA in the chronic compared with the FE patients would also not survive Bonferroni correction. We would expect that random error would affect the patients and controls equally, and we found no brain regions showing higher FA in the controls compared with the patients. Cross-sectional studies of individuals with large age ranges may be susceptible to cohort effects. The patients had a matched control group, which may help reduce some of the cohort effects. The LOESS curve for cortical FA between patients and controls is shown in figure 4. As can be seen, the trajectory for FA in patients is lower but parallels the trajectory for FA in controls.
Fig. 4.

Age-Related Trajectories of z-Transformed Fractional Anisotropy Measures in Patients With Chronic Schizophrenia and Controls.
Data collected from multiple sites, using scanners with different field strengths, head coils, and sequence parameters may induce artifacts and increase the variance of the FA measures. While these site-related differences cannot be completely removed, we corrected for these differences by using site as a covariate and through the use of relatively large ROIs. In addition, post-processing was performed at one site using the same image processing algorithms. Differences in scanner noise could increase the variance in the measures, resulting in a lowering of the effects sizes and significant findings. The CoV was higher in the occipital lobe and brain stem; thus, the higher noise in these smaller structures may have limited smaller effects. Finally, we evaluated differences between patients and controls at each site and found overlapping patterns in 3 of the 4 sites. The differences at the Iowa site may be related to a cohort effect, smaller sample size of patients, a more rural setting, or greater variability due to scanner differences such as obtaining only 6 directions.
Despite these limitations, we report global differences in WM microstructure in patients compared with controls in a large, multicenter study of FE and chronic schizophrenia. Regional FA differences are only observed in the cerebrum but involve all 4 lobes. The frontal lobe is the only region that is significantly different between the FE and chronic patient groups, with the lower FA being more pronounced in the chronic cohort. Finally, lower FA appears to be more related to antipsychotic medications; however, due to multicolinearities, it is difficult to separate ADY from DOI. Longitudinal studies of WM microstructure will be important to better understand whether these FA differences are a result of the DOI, medication, environmental effects, or adaptive processes within the brain as an attempt to compensate for the illness. Future studies should also assess the functional consequences and prognostic indicators associated with lower cerebral FA.
Funding
U.S. Department of Energy (DE-F02-99ER62764-A012) to the Mind Research Network; the Morphometry Biomedical Informatics Research Network (U24 RR021382); National Institutes of Mental Health (K08 MH068540); National Institutes of Health (NS050568, P30NS057091, and P41 RR00807).
Acknowledgments
We acknowledge research staff who assisted with the imaging, database management, and diagnostic interviewers at each of the sites: Minn: Angela Guimaraes and Danushka Wanduragala; NMex: Tara Biehl, Erica Snider, Heather Hawk; Iowa: Frank Fleming. We thank Karl Helmer regarding his advice in addressing site-related variability and reliability of DTI on different scanner platforms. We thank the anonymous reviewers for their very helpful suggestions to the paper. None of the authors report any conflict of interests related to this work.
References
- 1.Hakak Y, Walker JR, Li C, et al. Genome-wide expression analysis reveals dysregulation of myelination- related genes in chronic schizophrenia. Proc Natl Acad Sci USA. 2001;98:4746–4751. doi: 10.1073/pnas.081071198. [DOI] [PMC free article] [PubMed] [Google Scholar]
- 2.Heckers S, Heinsen H, Geiger B, Beckmann H. Hippocampal neuron number in schizophrenia. A stereological study. Arch Gen Psychiatry. 1991;48:1002–1008. doi: 10.1001/archpsyc.1991.01810350042006. [DOI] [PubMed] [Google Scholar]
- 3.Lim KO, Adalsteinsson E, Spielman D, Sullivan EV, Rosenbloom MJ, Pfefferbaum A. Proton magnetic resonance spectroscopic imaging of cortical gray and white matter in schizophrenia. Arch Gen Psychiatry. 1998;55:346–352. doi: 10.1001/archpsyc.55.4.346. [DOI] [PubMed] [Google Scholar]
- 4.Kubicki M, McCarley R, Westin CF, et al. A review of diffusion tensor imaging studies in schizophrenia. J Psychiatr Res. 2007;41:15–30. doi: 10.1016/j.jpsychires.2005.05.005. [DOI] [PMC free article] [PubMed] [Google Scholar]
- 5.White T, Nelson M, Lim KO. Diffusion tensor imaging in psychiatric disorders. Top Magn Reson Imaging. 2008;19:97–109. doi: 10.1097/RMR.0b013e3181809f1e. [DOI] [PubMed] [Google Scholar]
- 6.Davis KL, Stewart DG, Friedman JI, et al. White matter changes in schizophrenia: evidence for myelin-related dysfunction. Arch Gen Psychiatry. 2003;60:443–456. doi: 10.1001/archpsyc.60.5.443. [DOI] [PubMed] [Google Scholar]
- 7.Friedman JI, Tang C, Carpenter D, et al. Diffusion tensor imaging findings in first-episode and chronic schizophrenia patients. Am J Psychiatry. 2008;165:1024–1032. doi: 10.1176/appi.ajp.2008.07101640. [DOI] [PubMed] [Google Scholar]
- 8.First M, Spitzer RL, Gibbon M, Williams JB. Structured Clinical Interview for DSM-IV-TR Axis I Disorders. Washington, DC: American Psychiatric Press, Inc.; 1997. [Google Scholar]
- 9.Andreasen NC, Flaum M, Arndt S. The Comprehensive Assessment of Symptoms and History (CASH). An instrument for assessing diagnosis and psychopathology. Arch Gen Psychiatry. 1992;49:615–623. doi: 10.1001/archpsyc.1992.01820080023004. [DOI] [PubMed] [Google Scholar]
- 10.Andreasen NC. The Scale for the Assessment of Positive Symptoms (SAPS) Iowa City, IA: The University of Iowa; 1984. [Google Scholar]
- 11.Andreasen NC. The Scale for the Assessment of Positive Symptoms (SAPS) Iowa City, IA: The University of Iowa; 1983. [Google Scholar]
- 12.Miller DD, Flaum M, Nopoulos P, Arndt S, Andreasen NC. The concept of dose years: a reliable method for calculating lifetime psychotropic drug exposure. Schizophr Res. 1995;15:159. [Google Scholar]
- 13.Magnotta VA, Harris G, Andreasen NC, O'Leary DS, Yuh WT, Heckel D. Structural MR image processing using the BRAINS2 toolbox. Comput Med Imaging Graph. 2002;26:251–64. doi: 10.1016/s0895-6111(02)00011-3. [DOI] [PubMed] [Google Scholar]
- 14.Harris G, Andreasen NC, Cizadlo T, et al. Improving tissue classification in MRI: a three-dimensional multispectral discriminant analysis method with automated training class selection. J Comput Assist Tomogr. 1999;23:144–154. doi: 10.1097/00004728-199901000-00030. [DOI] [PubMed] [Google Scholar]
- 15.Cheng P, Magnotta VA, Wu D, et al. Evaluation of the GTRACT diffusion tensor tractography algorithm: a validation and reliability study. Neuroimage. 2006;31:1075–1085. doi: 10.1016/j.neuroimage.2006.01.028. [DOI] [PubMed] [Google Scholar]
- 16.Basser PJ, Mattiello J, LeBihan D. Estimation of the effective self-diffusion tensor from the NMR spin echo. J Magn Reson B. 1994;103:247–254. doi: 10.1006/jmrb.1994.1037. [DOI] [PubMed] [Google Scholar]
- 17.Collins DL, Neelin P, Peters TM, Evans AC. Automatic 3D intersubject registration of MR volumetric data in standardized Talairach space. J Comput Assist Tomogr. 1994;18:192–205. [PubMed] [Google Scholar]
- 18.Buehren M. Matlab Central File Exchange—Functions for the rectangular assignment problem. 2008 vol. http://www.mathworks.com/matlabcentral/fileexchange/loadFile.do?objectId=6543&;objectType=file; 2004. [Google Scholar]
- 19.Jones DK, Catani M, Pierpaoli C, et al. Age effects on diffusion tensor magnetic resonance imaging tractography measures of frontal cortex connections in schizophrenia. Hum Brain Mapp. 2006;27:230–238. doi: 10.1002/hbm.20179. [DOI] [PMC free article] [PubMed] [Google Scholar]
- 20.Friston KJ, Frith CD. Schizophrenia: a disconnection syndrome? Clin Neurosci. 1995;3:89–97. [PubMed] [Google Scholar]
- 21.Ho BC, Andreasen NC, Nopoulos P, Arndt S, Magnotta V, Flaum M. Progressive structural brain abnormalities and their relationship to clinical outcome: a longitudinal magnetic resonance imaging study early in schizophrenia. Arch Gen Psychiatry. 2003;60:585–594. doi: 10.1001/archpsyc.60.6.585. [DOI] [PubMed] [Google Scholar]
- 22.DeLisi LE, Sakuma M, Tew W, Kushner M, Hoff AL, Grimson R. Schizophrenia as a chronic active brain process: a study of progressive brain structural change subsequent to the onset of schizophrenia. Psychiatry Res. 1997;74:129–140. doi: 10.1016/s0925-4927(97)00012-7. [DOI] [PubMed] [Google Scholar]
- 23.Giedd JN, Jeffries NO, Blumenthal J, et al. Childhood-onset schizophrenia: progressive brain changes during adolescence. Biol Psychiatry. 1999;46:892–898. doi: 10.1016/s0006-3223(99)00072-4. [DOI] [PubMed] [Google Scholar]
- 24.Lieberman J, Chakos M, Wu H, et al. Longitudinal study of brain morphology in first episode schizophrenia. Biol Psychiatry. 2001;49:487–499. doi: 10.1016/s0006-3223(01)01067-8. [DOI] [PubMed] [Google Scholar]
- 25.Rapoport JL, Giedd JN, Blumenthal J, et al. Progressive cortical change during adolescence in childhood-onset schizophrenia. A longitudinal magnetic resonance imaging study. Arch Gen Psychiatry. 1999;56:649–654. doi: 10.1001/archpsyc.56.7.649. [DOI] [PubMed] [Google Scholar]
- 26.Gur RE, Maany V, Mozley PD, Swanson C, Bilker W, Gur RC. Subcortical MRI volumes in neuroleptic-naive and treated patients with schizophrenia. Am J Psychiatry. 1998;155:1711–1717. doi: 10.1176/ajp.155.12.1711. [DOI] [PubMed] [Google Scholar]
- 27.Woods BT. Is schizophrenia a progressive neurodevelopmental disorder? Toward a unitary pathogenetic mechanism. Am J Psychiatry. 1998;155:1661–1670. doi: 10.1176/ajp.155.12.1661. [DOI] [PubMed] [Google Scholar]
- 28.Hulshoff Pol HE, Kahn RS. What happens after the first episode? A review of progressive brain changes in chronically ill patients with schizophrenia. Schizophr Bull. 2008;34:354–366. doi: 10.1093/schbul/sbm168. [DOI] [PMC free article] [PubMed] [Google Scholar]
- 29.Javitt DC, Zukin SR. Recent advances in the phencyclidine model of schizophrenia. Am J Psychiatry. 1991;148:1301–1308. doi: 10.1176/ajp.148.10.1301. [DOI] [PubMed] [Google Scholar]
- 30.Olney JW, Farber NB. Glutamate receptor dysfunction and schizophrenia. Arch Gen Psychiatry. 1995;52:998–1007. doi: 10.1001/archpsyc.1995.03950240016004. [DOI] [PubMed] [Google Scholar]
- 31.Coyle JT. The glutamatergic dysfunction hypothesis for schizophrenia. Harv Rev Psychiatry. 1996;3:241–253. doi: 10.3109/10673229609017192. [DOI] [PubMed] [Google Scholar]
- 32.Selemon LD, Rajkowska G, Goldman-Rakic PS. Abnormally high neuronal density in the schizophrenic cortex. A morphometric analysis of prefrontal area 9 and occipital area 17. Arch Gen Psychiatry. 1995;52 doi: 10.1001/archpsyc.1995.03950220015005. 805–18; discussion 819–820. [DOI] [PubMed] [Google Scholar]
- 33.Glantz LA, Lewis DA. Decreased dendritic spine density on prefrontal cortical pyramidal neurons in schizophrenia. Arch Gen Psychiatry. 2000;57:65–73. doi: 10.1001/archpsyc.57.1.65. [DOI] [PubMed] [Google Scholar]
- 34.Weinberger DR, McClure RK. Neurotoxicity, neuroplasticity, magnetic resonance imaging morphometry: what is happening in the schizophrenic brain? Arch Gen Psychiatry. 2002;59:553–558. doi: 10.1001/archpsyc.59.6.553. [DOI] [PubMed] [Google Scholar]
- 35.Mori T, Ohnishi T, Hashimoto R, et al. Progressive changes of white matter integrity in schizophrenia revealed by diffusion tensor imaging. Psychiatry Res. 2007;154:133–145. doi: 10.1016/j.pscychresns.2006.09.004. [DOI] [PubMed] [Google Scholar]