

Abstract
Objective: The present study reviewed voxel-based morphometry (VBM) studies on high-risk individuals with schizophrenia, patients experiencing their first-episode schizophrenia (FES), and those with chronic schizophrenia. We predicted that gray matter abnormalities would show progressive changes, with most extensive abnormalities in the chronic group relative to FES and least in the high-risk group. Method: Forty-one VBM studies were reviewed. Eight high-risk studies, 14 FES studies, and 19 chronic studies were analyzed using anatomical likelihood estimation meta-analysis. Results: Less gray matter in the high-risk group relative to controls was observed in anterior cingulate regions, left amygdala, and right insula. Lower gray matter volumes in FES compared with controls were also found in the anterior cingulate and right insula but not the amygdala. Lower gray matter volumes in the chronic group were most extensive, incorporating similar regions to those found in FES and high-risk groups but extending to superior temporal gyri, thalamus, posterior cingulate, and parahippocampal gryus. Subtraction analysis revealed less frontotemporal, striatal, and cerebellar gray matter in FES than the high-risk group; the high-risk group had less gray matter in left subcallosal gyrus, left amygdala, and left inferior frontal gyrus compared with FES. Subtraction analysis confirmed lower gray matter volumes through ventral-dorsal anterior cingulate, right insula, left amygdala and thalamus in chronic schizophrenia relative to FES. Conclusions: Frontotemporal brain structural abnormalities are evident in nonpsychotic individuals at high risk of developing schizophrenia. The present meta-analysis indicates that these gray matter abnormalities become more extensive through first-episode and chronic illness. Thus, schizophrenia appears to be a progressive cortico-striato-thalamic loop disorder.
Keywords: meta-analysis, brain structure, high-risk group, schizophrenia
Introduction
Several recent structural brain imaging meta-analytic studies have demonstrated brain abnormalities in patients with schizophrenia at different stages of the illness.1–5 In particular, patients with first-episode schizophrenia (FES) already have smaller whole-brain volume, with greater lateral ventricular volume.3 Frontal6–9 and temporolimbic7,8 volumes have been reported to be smaller at first episode, while the basal nuclei are also affected early in the illness.9,10 However, the extent of abnormalities observed in FES varies considerably from study to study. Similarly, in patients with chronic schizophrenia smaller mean cerebral volumes and greater total ventricular volumes, with a reduction in hippocampus and parahippocampi size bilaterally, have been reported.5,11,12 Bilateral volume deficits in amygdala, frontal lobe, and temporal lobe appear to persist to chronic stages12 with a recent comprehensive meta-analysis describing progression of neocortical but not limbic cortical gray matter decrease with illness.4
Whether structural abnormalities are found in nonpsychotic relatives of people with schizophrenia is much less clear-cut. Nonpsychotic relatives of patients may share a genetic liability to schizophrenia. Therefore, brain structure abnormalities have been predicted to extend to those nonpsychotic relatives but in a less severe form. Consistent with this, preliminary studies have shown that nonpsychotic relatives of patients with schizophrenia have regional volume reductions in frontotemporal regions,13–15 although other evidence suggests that features in these groups are rather mild16 or restricted to anterior cingulate17 or cerebellum.18 Considering data from patient relatives as a proxy measurement of subclinical or early disease, some authors have suggested that progressive gray matter reduction in schizophrenia is superimposed on a preexisting volume deficit.19 The implication is that schizophrenia results from an early predisposition or developmental insult that gradually worsens.20,21
Given the plethora of imaging data now available at different stages of the illness, it is timely to apply a meta-analytic approach to map hypothesized progressive developmental pathology. If the hypothesis holds, nonpsychotic relatives of patients with schizophrenia, sharing a genetic liability to schizophrenia, would be predicted to have brain structural abnormalities in similar regions to patients early in their illness. These abnormalities should be exacerbated by chronicity. We therefore conducted a meta-analytical analysis of voxel-based morphometric (VBM) studies of gray matter brain abnormalities in schizophrenia and high-risk individuals. The high-risk group was defined as first- or second-degree relatives to schizophrenia patients or meeting the criteria of Personal Assessment and Crisis Evaluation (PACE).22
Method
Article Selection
Studies were searched in the PubMed and MEDLINE database, using the key words “voxel-based morphometry” and “schizophrenia,” or “VBM” and “schizophrenia,” respectively. For high-risk group, we used additional key words such as “sibling,” “relative,” “twin,” or “high risk.” Among the up to 200 result articles, we choose studies considering the following inclusion criteria: (1) they were research articles, (2) they used VBM analysis to investigate gray matter density change of magnetic resonance imaging (MRI) dataset, (3) they directly compared a group of subjects with schizophrenia or high risk with a healthy control group, and (4) the results were normalized to a stereotactic standardized space such as Montreal Neurological Institute (MNI) space or Talairach space,23 and the coordination of the activation areas was explicitly reported. In addition, we searched the reference lists of the studies identified for inclusion.
The high-risk group was defined as first- or second-degree relatives of patients with schizophrenia, those meeting the criteria of PACE,22 or those with a modification of the catechol-O-methyltransferase gene.24 As a result, 8 studies with 601 high-risk individuals were included in the high-risk group of the activation likelihood estimation (ALE) meta-analysis.
The FES group was principally defined by the authors of any given study. Those included in the FES group of studies had a duration of illness less than 1 year. Two studies reporting results from patients with first-episode psychosis were also included.25,26 As a result, 14 studies with 466 patients were included in the FES group of the ALE meta-analysis.
Great care was taken to make sure that the group of studies on chronic schizophrenia did not include FES patients. Therefore, although other meta-analyses may have included a broader range of “chronic” studies,4 we excluded several for the following reasons. Some articles grouped together chronic and FES patients (eg, Hone et al16 and Antonova et al27). In other studies of chronic schizophrenia, if the lower range of the duration of illness was less than 1 year or mean duration was less than 5 years, studies were excluded.28–33 Articles that did not report the duration of illness explicitly were also excluded (eg, García-Martí et al,34 Moorhead et al35, and Tregellas et al36). Because there are so many more articles relating to chronic schizophrenia than first-episode or high-risk groups, this stricter criterion than previous4 had the advantage of lessening the impact of publication bias toward chronic studies. There were 19 studies comprising a total of 808 strictly defined chronic patients included in the ALE meta-analysis.
Anatomical Likelihood Estimation
The ALE analyses were conducted in the Talairach space. Anatomical coordinates reported in the MNI space were converted into Talairach space using Lancaster transform.62 Where Brett's formulation had been used to convert from MNI to Talairach,63 results were first converted back to MNI space and then transformed into Talairach space using Lancaster's method. Where information regarding the stereotactic space used to report the results was unclear, we contacted the authors for further details.
The activation likelihood estimation meta-analysis64 was carried out using GingerALE software.65 Although originally applied to functional imaging studies, the method has now been widely applied to examine anatomical image datasets.66 The idea behind ALE analysis is that peak coordinates reported in VBM studies should be viewed as probability distributions around these coordinates.64 Practically, the ALE map was constructed based on foci reported in table 1 for each specific contrast, with a smoothing kernel of full-width at half-maximum of 10 mm. Then, activation maps with randomly distributed foci equal to the number of foci in the ALE analysis were simulated by 5000 permutations to sample the null hypothesis.
Table 1.
Summary of Articles Included in the Meta-analysis
| Group | No. | Study | Number of |
Age (y) | Number of |
Duration of Illness | Medication | Scanner | Type | ||
| Patients | Male | Controls | Male | ||||||||
| Chronic | 1 | Ananth et al6 | 20 | 10 | 37.8 | 20 | 10 | 15.8 | All | 2.0 T | Chronic |
| 2 | Bassitt et al37 | 50 | 38 | 31.7 | 30 | 21 | 11.4 | All | 1.5 T | Chronic | |
| 3 | Cooke et al38 | 52 | 40 | 38.4 | 30 | 24 | 13.9 | All | 1.5 T | Chronic | |
| 4 | Giuliani et al39 | 41 | 32 | 39 | 34 | 17 | 17.3 | All | 1.5 T | Chronic | |
| 5 | Hirao et al40 | 20 | 10 | 36.7 | 20 | 10 | 10.6 | All | 3 T | Chronic | |
| 6 | Hulshoff Pol et al41 | 159 | 112 | 35.6 | 158 | 106 | 12.3 | All | 1.5 T | Chronic | |
| 7 | Marcelis et al18 | 31 | 15 | 30.7 | 27 | 12 | 8.5 | 28 y | 1.5 T | Chronic | |
| 8 | Martí-Bonmatí et al42 | 21 | 21 | 39 | 10 | 10 | 15 | All | 1.5 T | Chronic | |
| 9 | McIntosh et al13 | 26 | 13 | 36.9 | 49 | 23 | 15.3 | N/A | 1.5 T | Chronic | |
| 10 | Meisenzahl et al43 | 72 | 56 | 35.6 | 177 | 123 | 9.5 | 86.1% y | 1.5 T | Chronic | |
| 11 | Neckelmann et al44 | 12 | N/A | 19–51 | 12 | N/A | 8.7 | y | 1.5 T | Chronic | |
| 12 | Ohnishi et al45 | 47 | 24 | 44.2 | 76 | 30 | 19.3 | All | 1.5 T | Chronic | |
| 13 | Paillère-Martinot et al46 | 20 | 20 | 29 | 20 | 20 | 10 | 18 y | 1.5 T | Chronic | |
| 14 | Shapleske et al47 | 72 | 72 | 34.1 | 32 | 32 | 11.5 | All | 1.5 T | Chronic | |
| 15 | Sigmundsson et al48 | 27 | 26 | 34.9 | 27 | 25 | 13.9 | N/A | 1.5 T | Chronic | |
| 16 | Wilke et al49 | 48 | 27 | 33 | 48 | 27 | 8.59 | 43 y | 1.5 T | Chronic | |
| 17 | Wolf et al50 | 28 | 20 | 33.1 | 14 | 9 | 5.8 | 27 y | 1.5 T | Chronic | |
| 18 | Wright et al51 | 42 | 31 | 34.6 | 52 | 34 | 12.2 | N/A | 1.0 T | Chronic | |
| 19 | Yamada et al52 | 20 | 10 | 38.8 | 20 | 10 | 11.6 | All | 3 T | Chronic | |
| FES | 20 | Chua et al10 | 26 | 12 | 32 | 38 | 18 | 0.33 | None | 1.5 T | First episode |
| 21 | Douaud et al53 | 25 | 18 | 16.3 | 25 | 17 | 1.4 | All | 1.5 T | First episode | |
| 22 | Janssen et al26 | 25 | 19 | 15.4 | 51 | 35 | 0.29 | All | 1.5 T | First episode | |
| 23 | Jayakumar et al54 | 18 | 9 | 24.9 | 18 | 9 | 0.86 | None | 1.5 T | First episode | |
| 24 | Job et al7 | 34 | 23 | 21.4 | 36 | 17 | N/A | N/A | 1.0 T | First episode | |
| 25 | Kaspárek et al55 | 22 | 22 | 23.7 | 18 | 18 | T20-89d | None | 1.5 T | First episode | |
| 26 | Kubicki et al8 | 16 | 14 | 26.7 | 18 | 16 | 0.14 | All | 1.5 T | First episode | |
| 27 | Lui et al56 | 68 | 38 | 24.2 | 68 | 37 | 0.72 | None | 3 T | First episode | |
| 28 | Meisenzahl et al43 | 93 | 67 | 28.2 | 177 | 123 | 0.76 | 84.9% y | 1.5 T | First episode | |
| 29 | Prasad et al25 | 15 | a11 | a24.7 | 12 | a6 | 2.32 | None | 1.5 T | First episode | |
| 30 | Salgado-Pineda et al9 | 13 | 13 | 23.8 | 13 | 13 | N/A | None | 1.5 T | First episode | |
| 31 | Schaufelberger et al57 | 62 | 44 | 27.6 | 94 | 53 | 0.48 | 69% y | 1.5 T | First episode | |
| 32 | Whitford et al58 | 31 | 20 | 19.3 | 30 | 20 | <3 m | 27 y | 1.5 T | First episode | |
| 33 | Yoshihara et al59 | 18 | 9 | 15.8 | 18 | 9 | 1.2 | 17 y | 1.5 T | First episode | |
| High risk | 34 | Borgwardt et al14 | 35 | 22 | 23.7 | 22 | 13 | 1.5 T | PACE criteria | ||
| 35 | Honea et al16 | 213 | 89 | 36.5 | 212 | 103 | 1.5 T | Siblings | |||
| 36 | Job et al17 | 146 | 74 | 21.2 | 36 | 17 | 1.0 T | First- /second-degree relatives | |||
| 37 | Lui et al60 | 10 | 3 | 41.4 | 10 | 4 | 3 T | Parents | |||
| 38 | Marcelis et al18 | 32 | 14 | 35.5 | 27 | 12 | 1.5 T | First-degree relatives | |||
| 39 | McIntosh et al61 | 50 | 25 | 36.4 | 48 | 1.5 T | First- /second-degree relatives | ||||
| 40 | McIntosh et al24 | 75 | 57 | 22.0 | N/A | 1 T | COMT gene | ||||
| 41 | Meisenzahl et al15 | 40 | 25 | 25.0 | 75 | 46 | 1.5 T | BSABS and PACE | |||
Note: FES, first-episodic schizophrenia; BSABS, Bonn Scale for Assessment of Prodromal Symptoms; PACE, Personal Assessment and Crisis Evaluation; COMT, catechol-O-methyltransferase.
Three ALE maps were constructed. First, we examined gray matter in the high-risk group compared with controls reported in 8 articles (43 foci). Second, we examined gray matter in first-episode patients compared with healthy controls reported in 14 articles (156 foci). Third, we examined gray matter in chronic schizophrenia patients compared with healthy controls reported in 19 articles (223 foci). The clusters identified in each meta-analysis were obtained after controlling the false discovery rate at P < .01 and applying a cluster extent threshold of 100 voxels.
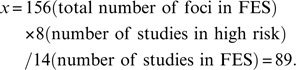
In order to compare gray matter differences between high-risk group and FES group, subtraction meta-analyses were performed. A subtraction meta-analysis yields an ALE map that shows regions in which the 2 groups of foci are significantly different. However, because there were more studies in the FES group (n = 14) than in the high-risk group (n = 8), more coordinates were reported by FES studies than high-risk studies. The different number of studies in 2 groups could therefore bias the analysis toward finding more extensive changes in FES group. Ellison-Wright et al4 addressed this problem by randomly selecting coordinates from the group of studies with more foci, making the number of foci the same as the number in the group reporting fewer coordinates. However, 2 factors could cause different numbers of coordinates in each group of studies. The first is a different number of studies in the 2 groups, and the second is a different mean number of foci reported in studies contained in the 2 groups. For example, in the current high-risk vs FES subtraction analysis, the mean number of foci in high-risk group was 43/8 = 5.375 and the mean number of foci in FES group was 156/14 = 11.14. This difference in mean number of foci in high-risk group and FES group potentially indicates more widespread abnormalities in FES group than high-risk group, and to retain this information in the subtraction ALE analysis we balanced the studies represented in each group by taking a proportion of data from the bigger study group as follows:
In the FES vs high-risk subtraction analysis, the proportion of coordinates “x” from FES studies compared with the high-risk data was
 |
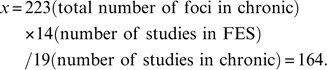
Similarly, the proportion of foci “x” from the chronic group used in the chronic vs FES subtraction analysis was
 |
Results
Demographic and medication informations are summarized in the table 1. The mean age of the patients in chronic group (mean 35.7 y) was much older than patients in FES group (mean 23.1 y) and high-risk group (mean 30.2 y). The individuals in the high-risk group were also older than in FES group. Most of the chronic patients received antipsychotic medication, while the patients in FES group were mixed. Six out of 14 studies of FES included patients who were antipsychotic naive, but in the remainder most of the patients received antipsychotic medication.
High-Risk Group
As illustrated in figure 1 and table 2, compared with healthy control group, there was significantly less gray matter in bilateral anterior cingulate gyrus (Brodmann area [BA] 32/24), right insula (BA 13), left amygdala, left subcallosal gyrus (BA 34), and left inferior frontal gyrus (BA 47) of high-risk individuals. Of these regions, the left amygdala, subcallosal gyrus, and inferior frontal gyrus were also smaller than in the FES group, see figure 2 and table 3.
Fig. 1.

Control Comparison Analyses. Gray matter volumes lower in high-risk group (red), first episodic group (blue), and chronic group (green) compared with healthy controls. Significance thresholded with a false discovery rate at P < .01. z represents the z coordinates in Talairach space. L, left; R, right; A, anterior; P, posterior.
Table 2.
ALE Results of Gray Matter Reduction in High-risk, FES, and Chronic Individuals
| Volume (mm3) | Peak ALE Value | Peak coordinates |
Label | ||
| x | y | z | |||
| High-risk group | |||||
| 824 | 0.010949 | 42 | −28 | 16 | R insula (BA 13) |
| 800 | 0.011203 | −28 | −8 | −12 | L amygdala |
| 560 | 0.011405 | −6 | 36 | 16 | L anterior cingulate (BA 32) |
| 560 | 0.007998 | 4 | 30 | 20 | R anterior cingulate (BA 24) |
| 0.007454 | 6 | 30 | 26 | R anterior cingulate (BA 32) | |
| 536 | 0.012022 | −22 | 6 | −14 | L subcallosal gyrus (BA 34) |
| 432 | 0.010776 | −48 | 26 | −2 | L inferior frontal gyrus (BA 47) |
| FES group | |||||
| 2616 | 0.018719 | −46 | −20 | 12 | L transverse temporal gyrus (BA 41) |
| 0.016219 | −52 | −8 | 6 | L superior temporal gyrus (BA 22) | |
| 0.015184 | −58 | −28 | 12 | L superior temporal gyrus (BA 42) | |
| 1576 | 0.015055 | 50 | −10 | 12 | R precentral gyrus (BA 13) |
| 0.013404 | 48 | −24 | 18 | R insula (BA 13) | |
| 1392 | 0.024821 | 34 | 16 | 10 | R insula (BA 13) |
| 1000 | 0.0236 | −34 | 20 | 6 | L insula (BA 13) |
| 1000 | 0.015507 | 6 | 16 | 38 | R cingulate gyrus (BA 32) |
| 0.011044 | 8 | 26 | 32 | R cingulate gyrus (BA 32) | |
| 976 | 0.015917 | −54 | 2 | −4 | L superior temporal gyrus (BA 22) |
| 0.010599 | −40 | 6 | 0 | L insula | |
| 768 | 0.014903 | −20 | −4 | −18 | L amygdala |
| 528 | 0.01845 | 24 | 34 | −8 | R inferior frontal gyrus (BA 47) |
| 504 | 0.017395 | 52 | −8 | −8 | R superior temporal gyrus (BA 22) |
| 456 | 0.017448 | −32 | 34 | −6 | L middle frontal gyrus (BA 47) |
| 416 | 0.014218 | −48 | 6 | 22 | L inferior frontal gyrus (BA 44) |
| 288 | 0.012031 | −8 | 46 | 8 | L medial frontal gyrus (BA 10) |
| 224 | 0.011605 | 10 | 10 | 12 | R caudate |
| 216 | 0.011588 | 52 | −20 | 44 | R postcentral gyrus (BA 2) |
| 200 | 0.011739 | −60 | −18 | 20 | L postcentral gyrus (BA 40) |
| 192 | 0.012533 | 2 | 36 | −16 | R medial frontal gyrus (BA 11) |
| 184 | 0.011727 | 28 | −44 | −34 | R cerebellum |
| 176 | 0.012417 | −38 | −14 | −30 | L uncus (BA 20) |
| Chronic schizophrenia group | |||||
| 4832 | 0.022295 | −36 | 16 | −4 | L inferior frontal gyrus (BA 47) |
| 0.021812 | −46 | 8 | 0 | L insula (BA 13) | |
| 0.012372 | −40 | 0 | 8 | L insula (BA 13) | |
| 0.012334 | −38 | 0 | 14 | L insula (BA 13) | |
| 2976 | 0.019676 | −4 | 52 | 12 | L medial frontal gyrus (BA 10) |
| 0.018219 | −6 | 34 | −14 | L medial frontal gyrus (BA 11) | |
| 0.017656 | 0 | 38 | −4 | L anterior cingulate (BA 32) | |
| 2336 | 0.029234 | 40 | 10 | 4 | R insula (BA 13) |
| 0.014545 | 54 | 4 | 0 | R superior temporal gyrus | |
| 1832 | 0.031679 | −2 | 6 | −2 | L anterior cingulate (BA 25) |
| 1744 | 0.018575 | −6 | 18 | 34 | L cingulate gyrus (BA 32) |
| 0.018075 | 2 | 18 | 32 | R cingulate gyrus (BA 32) | |
| 0.012224 | −2 | 8 | 40 | L cingulate gyrus (BA 32) | |
| 1648 | 0.028163 | −2 | −18 | 6 | L thalamus |
| 1208 | 0.019934 | −44 | 8 | 36 | L middle frontal gyrus (BA 9) |
| 0.017604 | −50 | 6 | 30 | L inferior frontal gyrus (BA 9) | |
| 840 | 0.024792 | −16 | −6 | −12 | L amygdala |
| 792 | 0.023959 | 56 | −20 | 18 | R postcentral gyrus (BA 40) |
| 584 | 0.019595 | 18 | −4 | −12 | R amygdala |
| 416 | 0.014732 | 30 | 54 | 10 | R superior frontal gyrus (BA 10) |
| 392 | 0.017153 | 42 | 4 | 38 | R middle frontal gyrus (BA 6) |
| 328 | 0.013756 | −40 | −22 | 14 | L insula (BA 13) |
| 160 | 0.013739 | −32 | −8 | −32 | L uncus (BA 20) |
| 160 | 0.013219 | 12 | −36 | 0 | R parahippocampal gyrus (BA 27) |
| 136 | 0.011935 | 26 | 28 | −2 | R inferior frontal gyrus (BA 47) |
Note: Abbreviations are explained in the first footnote to table 1. ALE, activation likelihood estimation; R, right; L, left; BA, Brodmann area.
Fig. 2.

Subtraction Analysis in First-Episode Schizophrenia (FES) Vs High-Risk Group. Red: lower gray matter volume in FES group. Blue: lower gray matter volume in high-risk group. Significance thresholded with a false discovery rate at P < .01. z represents the z coordinate in the Talairach space. L., left; R., right.
Table 3.
Subtraction ALE Results of Gray Matter Reduction in High-Risk and FES Individuals
| Volume (mm3) | Peak ALE Value | Peak Coordinates |
Label | ||
| x | y | z | |||
| Greater GM reduction in high-risk group compared with FES | |||||
| 224 | −0.01077 | −50 | 26 | −2 | L inferior frontal gyrus (BA 47) |
| 184 | −0.01151 | −22 | 6 | −14 | L subcallosal gyrus (BA 34) |
| 128 | −0.00977 | −30 | −8 | −12 | L amygdala |
| 128 | −0.00988 | −6 | 36 | 18 | L anterior cingulate (BA 32) |
| Less GM reduction in high-risk group compared with FES | |||||
| 1728 | 0.016143 | −52 | −8 | 6 | L superior temporal gyrus (BA 22) |
| 0.011673 | −46 | −20 | 12 | L transverse temporal gyrus (BA 41) | |
| 1184 | 0.023268 | −34 | 20 | 6 | L insula (BA 13) |
| 448 | 0.012066 | 6 | 18 | 38 | R cingulate gyrus (BA 32) |
| 400 | 0.013157 | 48 | −10 | 12 | R precentral gyrus (BA 13) |
| 368 | 0.012289 | −18 | −2 | −22 | L uncus (BA 34) |
| 320 | 0.011672 | 28 | −44 | −34 | R cerebellum |
| 272 | 0.01241 | −38 | −14 | −30 | L uncus (BA 20) |
| 224 | 0.010423 | 10 | 8 | 14 | R caudate |
| 192 | 0.009565 | −2 | −14 | 4 | L thalamus |
| 192 | 0.009968 | −12 | 6 | 12 | L caudate |
Note: Abbreviations are explained in the first footnote to table 1.
First Episodic Schizophrenia
As illustrated in figure 1 and table 2, the FES group, compared with healthy control group, had significantly less gray matter in the anterior cingulate right insula (BA 13). However, FES gray matter volume deficits involved more of the left lateral prefrontal lobe (BAs 10, 44) in addition to right BA 8, bilateral postcentral gyrus (BA 1/2/40), left temporal lobe (BAs 41, 42, 34), left insula (BA 13), right cerebellum, and right caudate nucleus. The result was similar when FES was compared with the high-risk group, see figure 2 and table 3.
Chronic Schizophrenia
Patients with chronic schizophrenia had lower gray matter volumes in the anterior cingulate and right insula compared with controls and FES. In addition, patients with chronic schizophrenia had less gray matter in the temporal lobe (bilateral BA 22, right parahippocampus, left amygdala), left frontal lobe (BAs 9, 11, 8, 32), left insula, thalamus, and left posterior cingulate gyrus compared with controls. Volumes of many of these regions were also lower in chronic disease than FES (figure 3 and table 4). However, the volume of the right postcentral gyrus (BA 2) was lower in FES than chronic schizophrenia.
Fig. 3.

Subtraction Analysis Chronic Vs First-Episode Schizophrenia (FES) Group. Red: lower gray matter volume in chronic schizophrenia. Blue: lower gray matter volume in FES. Significance thresholded with a false discovery rate at P < .01. z represents the z coordinate in the Talairach space. L, left; R, right.
Table 4.
Subtraction ALE Results of Gray Matter Reduction in FES and Chronic Individuals
| Volume (mm3) | Peak ALE Value | Peak Coordinates |
Label | ||
| x | y | z | |||
| Greater GM reduction in FES compared with chronic group | |||||
| 944 | −0.01541 | −52 | −8 | 6 | L superior temporal gyrus (BA 22) |
| −0.01546 | −46 | −18 | 10 | L transverse temporal gyrus (BA 41) | |
| 664 | −0.0225 | −34 | 20 | 6 | L insula (BA 13) |
| 512 | −0.0171 | 34 | 16 | 12 | R insula (BA 13) |
| 448 | −0.01491 | −58 | −28 | 12 | L superior temporal gyrus (BA 42) |
| 408 | −0.01723 | 52 | −8 | −8 | R superior temporal gyrus (BA 22) |
| 320 | −0.01427 | −56 | 2 | −4 | L superior temporal gyrus (BA 22) |
| 208 | −0.01331 | −48 | 6 | 22 | L inferior frontal gyrus (BA 44) |
| 168 | −0.01463 | 24 | 34 | −8 | R inferior frontal gyrus (BA 47) |
| 136 | −0.01261 | −32 | 32 | −4 | L inferior frontal gyrus (BA 47) |
| 120 | −0.01217 | 50 | −12 | 12 | R precentral gyrus (BA 13) |
| 120 | −0.01197 | 6 | 14 | 38 | R cingulate gyrus (BA 32) |
| Greater GM reduction in chronic compared with FES group | |||||
| 1896 | 0.031174 | −2 | 6 | −2 | L anterior cingulate (BA 25) |
| 984 | 0.022839 | 42 | 10 | 2 | R insula (BA 13) |
| 544 | 0.015637 | −4 | 52 | 14 | L medial frontal gyrus (BA 9) |
| 392 | 0.015613 | −6 | 34 | −14 | L medial frontal gyrus (BA 11) |
| 272 | 0.013896 | −34 | 16 | −6 | L inferior frontal gyrus (BA 47) |
| 168 | 0.012403 | −2 | −70 | −4 | L cerebellum |
| 160 | 0.015129 | 56 | −22 | 16 | R postcentral gyrus (BA 40) |
| 144 | 0.012727 | 38 | −12 | −30 | R uncus (BA 20) |
Note: Abbreviations are explained in the first footnote to table 1.
Discussion
The high-risk group had lower anterior cingulate and right insula volumes than controls. Gray matter in these same regions was also lower in FES and the chronic condition relative to controls. The FES group had lower gray matter volumes in frontal, temporal, striatal, and cerebellar regions compared with both controls and high-risk groups. The chronic group had lower gray matter volumes in similar frontotemporal regions compared with controls and FES groups. However, gray matter volumes in left dorsolateral prefrontal lobe and the thalamus were also lower compared with FES and controls.
Previous meta-analyses of brain volume changes in schizophrenia have generally considered “region-of-interest” (ROI)–based MRI studies.1–3,5 However, ROI studies are challenging because they tend to rely on manual tracing methods. The region to be quantified therefore must have identifiable boundaries and be large enough to visualize and trace. Thus, measurement is restricted to relatively coarse or lobar targets, and more subtle anatomical differences cannot be easily resolved. Moreover, targets for quantification in ROI are necessarily limited to measurement of a priori determined regions, and unpredicted differences will be missed. Automated “voxel-based” studies, which quantify every “volume element” in whole brain, overcome these limitations to some degree. However, until techniques such as ALE became available, it has not been possible to integrate data from voxel-based studies of schizophrenia into meta-analyses. Nevertheless, there are broad similarities between the results reported here and those found by more conventional means. In particular, Shenton et al5 reviewed 193 studies of schizophrenia and concluded that there was moderate to strong evidence for frontal lobe, medial temporal lobe, basal ganglia, and thalamic abnormalities that fits the patterns described here.5 Moreover, a “progression of pathology with illness chronicity similar to that presented here has been suggested by ROI meta-analyses.” For example, Vita et al2 also found that the amygdala is unaffected in FES, while Wright et al12 found amygdala deficits in more chronic patients, again similar to our findings.
Interestingly, the seminal ALE study of FES and chronic schizophrenia conducted by Ellison-Wright et al4 did not find evidence to support extension of pathology to the amygdala with chronic illness. Otherwise, our studies generated fairly consistent results concerning FES and chronic patients. Both studies found caudate deficits in FES that were absent later in the disease and more extensive frontal (especially anterior cingulate) and insula deficits in chronic illness. In the present study, we defined “chronic” illness quite strictly. Thus, we excluded chronic studies if they included patients whose duration of illness was less than 1 year or if the mean duration was less than 5 years.28–33 We also excluded studies that did not state duration of illness (eg, García-Martí et al,34 Moorhead et al,35 and Tregellas et al36). This meant that the number of studies of chronic schizophrenia was fewer than in Ellison-Wright's.4 The more constrained analysis aimed to minimize potential overlap between FES and chronic patient samples and may have contributed to the differences between our 2 studies.4
The present results also suggest a link between predisposition to schizophrenia and structural anomalies of the anterior cingulate and right insula. Compared with control groups, there was less gray matter in the vicinity of these regions at each stage of illness. Because control group contrasts were entirely separate analyses involving multiple different samples, the coordinates generated were unlikely to fully overlap. That is, from the control group contrasts we cannot say for sure if the pattern is truly progressive. Results from the subtraction analysis help address this issue. The FES/high-risk subtraction analysis indicated that gray matter volumes in the dorsal anterior cingulate gryus became lower from high risk to acute illness (figure 2, level z = 36) and right insula (figure 2, level z = 0). The chronic/FES subtraction analysis showed even more extensive gray matter change throughout the ventral-dorsal anterior cingulate (figure 3, z = 4 through 28) and right insular cortex (figure 3, z = −4 through 4) with chronicity. This subtraction analysis also indicated that gray matter deficits in chronic condition became extensive in the left amygdala and thalamus compared with FES.
The anterior cingulate is a critical node integrating the emotion and executive function performance of the limbic and frontal lobe, respectively.67,68 As such, it is central to cognition69 and is needed for response selection,70–72 error detection,73,74 and monitoring of reward contingencies.75 Adolescents with schizotypal personality disorder (considered at high risk for developing schizophrenia) who have “negative” symptoms also have executive dysfunction.76 Smaller volumes of the anterior cingulate are associated with greater executive function difficulty77 and with more severe Schneiderian first-rank symptoms.78 Thus, there appears to be a convergence of evidence for a link between smaller anterior cingulate volumes, cognitive difficulties, and the schizophrenia phenotype.
The results from this meta-analysis contradict other findings of larger anterior cingulate volumes in schizophrenia.79 Interestingly, that study showed that the greatest cingulate cortical thickness correlated with the duration of exposure to typical antipsychotic medication and was unrelated to chronicity. This raises the important issue of the impact drug treatment may have on brain morphology. Antipsychotic medications may act to increase regional brain volumes, especially in the caudate nucleus and anterior cingulate.80–83 Such antipsychotic-induced hypertrophy82 may perhaps contribute to these divergent findings, but the present meta-analysis suggests that, in general, anterior cingulate volumes are lower in people predisposed to and suffering from schizophrenia.
The basal ganglia appear to be especially sensitive to medication. Prior to exposure to antipsychotic medication, patients with schizophrenia have smaller caudate nuclei, putamen, and nucleus accumbens.9,10,82–85 Following treatment, subcortical enlargement occurs,80–83,86 although the effect may be more pronounced with typical rather than atypical drug options.82 This reversal of caudate volume deficits with exposure to medication may explain why caudate deficits were not found in the chronic samples. That lower caudate size was only noted in FES and not the high-risk group in our study agrees with a recent proposal that small caudate volumes may serve as a useful biological marker for onset of psychosis the size of which is thereafter modified by antipsychotic drug treatment.10,80
Our finding that both predisposition to schizophrenia and progression of schizophrenia is associated with lower right insula volumes is important. The insula may act as a relay or interface between the frontal and temporal lobes, and its involvement in schizophrenia has been suggested to be an “extension” of primary frontal and temporal lobe pathology in schizophrenia.87 Decreased activation of the insula during the classic frontal lobe task (verbal fluency) in schizophrenia is consistent with this hypothesis.88 The insula has been reported to activate during instances of response inhibition failure,89,90 and this role in behavior suppression is in conjunction with the anterior cingulate.90,91 The insula also has a well-recognized role in emotion processing, especially in assigning emotional meaning to bodily feelings or emotion simulation.92,93 Patients with schizophrenia have difficulty with socioemotional simulation or mental representation of emotions,94 and increased insular activation has been linked to somatic hallucinations in schizophrenia.95 Thus, our finding of a preexisting insular anomaly in high-risk samples may explain accumulating evidence for emotional difficulties in high-risk individuals that are similar to, if milder than, full-blown clinical disease.96
We suggest that the present meta-analysis is consistent with the conceptualization of schizophrenia as a progressive disorder.20,21 The results here confirm structural brain abnormalities in those at high risk of the disorder, which are likely to be genetically determined. Brain abnormalities at first presentation include similar regions, but additional fronto-striatal-temporal pathology emerges. Finally, by chronic illness, the gray matter volume lowering has progressed further not only within the same regions but also involving more prefrontal cortical and thalamic loci. This cortico-thalamic pathology maps convincingly to the neurochemical circuitry systems implicated in schizophrenia, namely, cortico-thalamic loop systems, regulated through a complex interplay of glutmate, γ-aminobutyric acid, and dopamine neurotransmission.97
Abnormalities in glutamate receptors are thought to contribute especially to the cognitive difficulties and negative symptoms of schizophrenia.98 Because glutamate receptor signaling is a critical regulator of neuronal development and cell death, abnormalities in glutamate transmission could therefore partly explain the neurodevelopmental origins, progressive loss of gray matter, and cognitive impairment found in schizophrenia. In their revised excitotoxic hypothesis of schizophrenia, Deutsch et al99 predicted that progressive cell loss in cortical areas occurs via disinhibition of glutamate projections. They suggested that support for this hypothesis would come from “anatomic evidence” of progression along with the increasing cognitive impairment and negative symptomatology in chronic illness.99 In the absence of substantial long-term follow-up studies, the present meta-analysis fits with their prediction and offers a series of targets to further investigate neurochemical perturbation in schizophrenia. A more recent evaluation of neurochemistry in schizophrenia also highlighted the potential for glutamate excitotoxicity in schizophrenia.100 Thus, further investigation of a hypothethical link between excitotoxic levels of cortical glutamate and macroscopic gray matter differences in brain regions identified here may provide new leads and options for treatment.
We acknowledge that our study is not without limitations. While we have interpreted our findings as reflecting “progression,” we use this term quite loosely. To truly observe progression, longitudinal studies are needed. Moreover, we acknowledge that, given the high-risk individuals included in our analysis were older than the first-episode group, these “high-risk” patients would be unlikely to develop schizophrenia. At most, we can interpret the contribution of findings from this group of studies as pertinent to shared genetic factors. The patients in first-episode and chronic studies would presumably have these shared genetic factors in addition to other disease-specific genetic or environmental factors. Although the large majority of the first-episode studies did investigate only patients with schizophrenia, and excluded other psychosis, some did not. Prasad et al25 included patients with schizoaffective disorder, and Janssen et al26 included patients with affective psychosis and other psychoses. In the latter study, the authors followed up their cohort and found common gray matter deficits in schizophrenia and bipolar patients that they interpreted as consistent with a shared pathology. Thus, it is possible that patients without a strict diagnosis of schizophrenia may have contributed partly to the results we reported, but given they were a relatively small proportion of the total patient number, we expect that the influence was minimal. An additional concern is that the mean age of individuals in the chronic studies was much older than the other groups making age and important confounder. At present, the ALE method does not accommodate covariables in the analysis. Lastly, the individual studies incorporated are of different sample sizes and use variable statistical thresholds for reporting results that are not accounted for in the meta-analysis reported here. Our hope is that future versions of the software will help us address these outstanding issues.
The quantitative meta-analytic method adopted allows a fast synthesis of large amounts of detailed neuroimaging data; the method is subject to the general limitation common to all meta-analysis, namely, that studies with negative findings are less likely to be published and therefore cannot influence the meta-analysis results. Related to this is the problem that many fewer articles comparing high-risk groups with controls have been published compared with studies of people with full-blown illness. This means that fewer foci can be included from high-risk groups. The ALE method is known to be sensitive to the number of included foci, but the optimal number for analyses has not yet been determined.65 However, a sizeable number of foci from high-risk control comparison studies45 were included in the present analysis, and the substraction analysis attempted to balance the foci contained in the analysis to counter this bias.
In conclusion, mapping the progressive changes in schizophrenia, from shared genetic factors through to chronic illness, goes some way toward clarifying potential markers for disease risk (anterior cingulate and right insula volume reduction), disease onset (caudate volume reduction), and progression to chronic stages (thalamic involvement). We therefore hope that this approach can open new avenues for research by highlighting targets for treatment both early and late in the illness.
Funding
Project-Oriented Hundred Talents Programme (O7CX031003); Knowledge Innovation Project of the Chinese Academy of Sciences (KSCX2-YW-R-131); National Natural Science Foundation of China (30770723 to R.C.K.C.); National Basic Research Programme (973 Programme No. 2007CB512302 and 2007CB512305).
Acknowledgments
We thank several researchers who provided extra information about their studies (Drs A. McIntosh, T. Moorhead, L. Marti-Bonmati, G. Garcia, M. Schaufelberger, K. Hugdahl). The funding agents had no further role in the study design; in the collection, analysis, and interpretation of the data; in the writing of the manuscript; and in the decision to submit the article for publication. Articles in the “References” section numbered 6–10, 14–18, 24–26, 37–61 are included in the meta-analysis.
References
- 1.Steen RG, Mull C, McClure R, Hamer RM, Lieberman JA. Brain volume in first-episode schizophrenia: systematic review and meta-analysis of magnetic resonance imaging studies. Br J Psychiatry. 2006;188:510–518. doi: 10.1192/bjp.188.6.510. [DOI] [PubMed] [Google Scholar]
- 2.Vita A, De Peri L, Silenzi C, Dieci M. Brain morphology in first-episode schizophrenia: a meta-analysis of quantitative magnetic resonance imaging studies. Schizophr Res. 2006;82:75–88. doi: 10.1016/j.schres.2005.11.004. [DOI] [PubMed] [Google Scholar]
- 3.Vita A, De Peri L. Hippocampal and amygdala volume reductions in first-episode schizophrenia. Br J Psychiatry. 2007;190:271. doi: 10.1192/bjp.190.3.271. [DOI] [PubMed] [Google Scholar]
- 4.Ellison-Wright I, Glahn D, Laird AR, Thelen S, Bullmore E. The anatomy of first-episode and chronic schizophrenia: an anatomical likelihood estimation meta-analysis. Am J Psychiatry. 2008;165:1015–1023. doi: 10.1176/appi.ajp.2008.07101562. [DOI] [PMC free article] [PubMed] [Google Scholar]
- 5.Shenton ME, Dickey CC, Frumin M, McCarley RW. A review of MRI findings in schizophrenia. Schizophr Res. 2001;49:1–52. doi: 10.1016/s0920-9964(01)00163-3. [DOI] [PMC free article] [PubMed] [Google Scholar]
- 6.Ananth H, Popescu I, Critchley HD, Good CD, Frackowiak RSJ, Dolan RJ. Cortical and subcortical gray matter abnormalities in schizophrenia determined through structural magnetic resonance imaging with optimized volumetric voxel-based morphometry. Am J Psychiatry. 2002;159:1497–1505. doi: 10.1176/appi.ajp.159.9.1497. [DOI] [PubMed] [Google Scholar]
- 7.Job DE, Whalley HC, McConnell S, Glabus M, Johnstone EC, Lawrie SM. Structural gray matter differences between first-episode schizophrenics and normal controls using voxel-based morphometry. NeuroImage. 2002;2:880–889. [PubMed] [Google Scholar]
- 8.Kubicki M, Shenton ME, Salisbury DF, et al. Voxel-based morphometric analysis of gray matter in first episode schizophrenia. NeuroImage. 2002;17:1711–1719. doi: 10.1006/nimg.2002.1296. [DOI] [PMC free article] [PubMed] [Google Scholar]
- 9.Salgado-Pineda P, Baeza I, Pérez-Gómez M, et al. Sustained attention impairment correlates to gray matter decreases in first episode neuroleptic-naive schizophrenic patients. NeuroImage. 2003;19:365–375. doi: 10.1016/s1053-8119(03)00094-6. [DOI] [PubMed] [Google Scholar]
- 10.Chua SE, Cheung C, Cheung V, et al. Cerebral grey, white matter and CSF in never-medicated, first-episode schizophrenia. Schizophr Res. 2007;89:12–21. doi: 10.1016/j.schres.2006.09.009. [DOI] [PubMed] [Google Scholar]
- 11.Lawrie SM, Abulkmeil SS. Brain abnormality in schizophrenia: a systematic and quantitative review of volumetric magnetic resonance imaging studies. Br J Psychiatry. 1998;172:110–120. doi: 10.1192/bjp.172.2.110. [DOI] [PubMed] [Google Scholar]
- 12.Wright IC, Rabe-Hesketh S, Woodruff PWR, David AS, Murray RM, Bullmore ET. Meta-analysis of regional brain volumes in schizophrenia. Am J Psychiatry. 2000;157:16–25. doi: 10.1176/ajp.157.1.16. [DOI] [PubMed] [Google Scholar]
- 13.McIntosh AM, Job DE, Moorhead TW, et al. Voxel-based morphometry of patients with schizophrenia or bipolar disorder and their unaffected relatives. Biol Psychiatry. 2004;56:544–552. doi: 10.1016/j.biopsych.2004.07.020. [DOI] [PubMed] [Google Scholar]
- 14.Borgwardt SJ, Riecher-Rössler A, Dazzan P, et al. Regional gray matter volume abnormalities in the at risk mental state. Biol Psychiatry. 2007;61:1148–1156. doi: 10.1016/j.biopsych.2006.08.009. [DOI] [PubMed] [Google Scholar]
- 15.Meisenzahl EM, Koutsouleris N, Gaser C, et al. Structural brain alterations in subjects at high-risk of psychosis: a voxel-based morphometric study. Schizophr Res. 2008;102:150–162. doi: 10.1016/j.schres.2008.02.023. [DOI] [PubMed] [Google Scholar]
- 16.Honea RA, Meyer-Lindenberg A, Hobbs KB, et al. Is gray matter volume an intermediate phenotype for schizophrenia? A voxel-based morphometry study of patients with schizophrenia and their healthy siblings. Biol Psychiatry. 2008;63:465–474. doi: 10.1016/j.biopsych.2007.05.027. [DOI] [PMC free article] [PubMed] [Google Scholar]
- 17.Job DE, Whalley HC, McConnell S, Glabus M, Johnstone EC, Lawrie SM. Voxel-based morphometry of grey matter densities in subjects at high risk of schizophrenia. Schizophr Res. 2003;64:1–13. doi: 10.1016/s0920-9964(03)00158-0. [DOI] [PubMed] [Google Scholar]
- 18.Marcelis M, Suckling J, Woodruff P, Hofman P, Bullmore E, van Os J. Searching for a structural endophenotype in psychosis using computational morphometry. Psychiatry Res. 2003;122:153–167. doi: 10.1016/s0925-4927(02)00125-7. [DOI] [PubMed] [Google Scholar]
- 19.Lawrie SM, Whalley HC, Abukmeil SS, et al. Brain structure, genetic liability and psychotic symptoms in subjects at high risk of developing schizophrenia. Biol Psychiatry. 2001;49:811–823. doi: 10.1016/s0006-3223(00)01117-3. [DOI] [PubMed] [Google Scholar]
- 20.Woods BT. Is schizophrenia a progressive neurodevelopmental disorder? Toward a unitary pathogenetic mechanism. Am J Psychiatry. 1998;155:1661–1670. doi: 10.1176/ajp.155.12.1661. [DOI] [PubMed] [Google Scholar]
- 21.de Haan L, Bakker JM. Overview of neuropathological theories of schizophrenia: from degeneration to progressive developmental disorder. Psychopathology. 2004;37:1–7. doi: 10.1159/000077013. [DOI] [PubMed] [Google Scholar]
- 22.Yung AR, Phillips LJ, McGorry PD, et al. Prediction of psychosis. A step towards indicated prevention of schizophrenia. Br J Psychiatry Suppl. 1998;172:14–20. [PubMed] [Google Scholar]
- 23.Talairach J, Tournoux P. Co-planar Stereotactic Atlas of the Human Brain: 3-Dimensional Proportional System—An Approach to Cerebral Imaging. New York, NY: Thieme Medical Publishers; 1988. [Google Scholar]
- 24.McIntosh AM, Baig BJ, Hall J, et al. Relationship of catechol-O-methyltransferase variants to brain structure and function in a population at high risk of psychosis. Biol Psychiatry. 2007;61:1127–1134. doi: 10.1016/j.biopsych.2006.05.020. [DOI] [PubMed] [Google Scholar]
- 25.Prasad KM, Shirts BH, Yolken RH, Keshavan MS, Nimgaonkar VL. Brain morphological changes associated with exposure to HSV1 in first-episode schizophrenia. Mol Psychiatry. 2007;12:105–113. doi: 10.1038/sj.mp.4001915. [DOI] [PubMed] [Google Scholar]
- 26.Janssen J, Reig S, Parellada M, et al. Regional gray matter volume deficits in adolescents with first-episode psychosis. J Am Acad Child Adolesc Psychiatry. 2008;47:1311–1320. doi: 10.1097/CHI.0b013e318184ff48. [DOI] [PubMed] [Google Scholar]
- 27.Antonova E, Kumari V, Morris R, et al. The relationship of structural alterations to cognitive deficits in schizophrenia: a voxel-based morphometry study. Biol Psychiatry. 2005;58:457–467. doi: 10.1016/j.biopsych.2005.04.036. [DOI] [PubMed] [Google Scholar]
- 28.Ha TH, Youn T, Ha KS, et al. Gray matter abnormalities in paranoid schizophrenia and their clinical correlations. Psychiatry Res. 2004;132:251–260. doi: 10.1016/j.pscychresns.2004.05.001. [DOI] [PubMed] [Google Scholar]
- 29.Kawasaki Y, Suzuki M, Nohara S, et al. Structural brain differences in patients with schizophrenia and schizotypal disorder demonstrated by voxel-based morphometry. Eur Arch Psychiatry Clin Neurosci. 2004;254:406–414. doi: 10.1007/s00406-004-0522-1. [DOI] [PubMed] [Google Scholar]
- 30.Kawasaki Y, Suzuki M, Kherif F, et al. Multivariate voxel-based morphometry successfully differentiates schizophrenia patients from healthy controls. NeuroImage. 2007;34:235–242. doi: 10.1016/j.neuroimage.2006.08.018. [DOI] [PubMed] [Google Scholar]
- 31.Koutsouleris N, Gaser C, Jäger M, et al. Structural correlates of psychopathological symptom dimensions in schizophrenia: a voxel-based morphometric study. NeuroImage. 2008;39:1600–1612. doi: 10.1016/j.neuroimage.2007.10.029. [DOI] [PubMed] [Google Scholar]
- 32.Salgado-Pineda P, Junqué C, Vendrell P, et al. Decreased cerebral activation during CPT performance structural and functional deficits in schizophrenic patients. NeuroImage. 2004;21:840–847. doi: 10.1016/j.neuroimage.2003.10.027. [DOI] [PubMed] [Google Scholar]
- 33.Suzuki M, Nohara S, Hagino H, et al. Regional changes in brain gray and white matter in patients with schizophrenia demonstrated with voxel-based analysis of MRI. Schizophr Res. 2002;55:41–54. doi: 10.1016/s0920-9964(01)00224-9. [DOI] [PubMed] [Google Scholar]
- 34.García-Martí G, Aguilar EJ, Lull JJ, et al. Schizophrenia with auditory hallucinations: a voxel-based morphometry study. Prog Neuropsychopharmacol Biol Psychiatry. 2008;32:72–80. doi: 10.1016/j.pnpbp.2007.07.014. [DOI] [PubMed] [Google Scholar]
- 35.Moorhead TW, Job DE, Whalley HC, Sanderson TL, Johnstone EC, Lawrie SM. Voxel-based morphometry of comorbid schizophrenia and learning disability: analyses in normalized and native spaces using parametric and nonparametric statistical methods. NeuroImage. 2004;22:188–202. doi: 10.1016/j.neuroimage.2003.12.012. [DOI] [PubMed] [Google Scholar]
- 36.Tregellas JR, Shatti S, Tanabe JL, et al. Gray matter volume differences and the effects of smoking on gray matter in schizophrenia. Schizophr Res. 2007;97:242–249. doi: 10.1016/j.schres.2007.08.019. [DOI] [PubMed] [Google Scholar]
- 37.Bassitt DP, Neto MR, de Castro CC, Busatto GF. Insight and regional brain volumes in schizophrenia. Eur Arch Psychiatry Clin Neurosci. 2007;257:58–62. doi: 10.1007/s00406-006-0685-z. [DOI] [PubMed] [Google Scholar]
- 38.Cooke MA, Fannon D, Kuipers E, Peters E, Williams SC, Kumari V. Neurological basis of poor insight in psychosis: a voxel-based MRI study. Schizophr Res. 2008;103:40–51. doi: 10.1016/j.schres.2008.04.022. [DOI] [PMC free article] [PubMed] [Google Scholar]
- 39.Giuliani NR, Calhoun VD, Pearlson GD, Francis A, Buchanan RW. Voxel-based morphometry versus region of interest: a comparison of two methods for analyzing gray matter differences in schizophrenia. Schizophr Res. 2005;74:135–147. doi: 10.1016/j.schres.2004.08.019. [DOI] [PubMed] [Google Scholar]
- 40.Hirao K, Miyata J, Fujiwara H, et al. Theory of mind and frontal lobe pathology in schizophrenia: a voxel-based morphometry study. Schizophr Res. 2008;105:165–74. doi: 10.1016/j.schres.2008.07.021. [DOI] [PubMed] [Google Scholar]
- 41.Hulshoff Pol HE, Schnack HG, Mandl RCW, et al. Focal gray matter density changes in schizophrenia. Arch Gen Psychiatry. 2001;58:1118–1125. doi: 10.1001/archpsyc.58.12.1118. [DOI] [PubMed] [Google Scholar]
- 42.Martí-Bonmatí L, Lull JJ, García-Martí G, et al. Chronic auditory hallucinations in schizophrenic patients: MR analysis of the coincidence between functional and morphologic abnormalities. Radiology. 2007;244:549–556. doi: 10.1148/radiol.2442060727. [DOI] [PubMed] [Google Scholar]
- 43.Meisenzahl EM, Koutsouleris N, Bottlender R, et al. Structural brain alterations at different stages of schizophrenia: a voxel-based morphometric study. Schizophr Res. 2008;104:44–60. doi: 10.1016/j.schres.2008.06.023. [DOI] [PubMed] [Google Scholar]
- 44.Neckelmann G, Specht K, Lund A, et al. Mr morphometry analysis of grey matter volume reduction in schizophrenia: association with hallucinations. Int J Neurosci. 2006;116:9–23. doi: 10.1080/00207450690962244. [DOI] [PubMed] [Google Scholar]
- 45.Ohnishi T, Hashimoto R, Mori T, et al. The association between the Val158Met polymorphism of the catechol-O-methyl transferase gene and morphological abnormalities of the brain in chronic schizophrenia. Brain. 2006;129:399–410. doi: 10.1093/brain/awh702. [DOI] [PubMed] [Google Scholar]
- 46.Paillère-Martinot ML, Caclin A, Artiges E, et al. Cerebral gray and white matter reductions and clinical correlates in patients with early onset schizophrenia. Schizophr Res. 2001;50:19–26. doi: 10.1016/s0920-9964(00)00137-7. [DOI] [PubMed] [Google Scholar]
- 47.Shapleske J, Rossell SL, Chitnis XA, et al. A computational morphometric MRI study of schizophrenia: effects of hallucinations. Cereb Cortex. 2002;12:1331–1341. doi: 10.1093/cercor/12.12.1331. [DOI] [PubMed] [Google Scholar]
- 48.Sigmundsson T, Suckling J, Maier M, et al. Structural abnormalities in frontal, temporal, and limbic regions and interconnecting white matter tracts in schizophrenic patients with prominent negative symptoms. Am J Psychiatry. 2001;158:234–243. doi: 10.1176/appi.ajp.158.2.234. [DOI] [PubMed] [Google Scholar]
- 49.Wilke M, Kaufmann C, Grabner A, Pütz B, Wetter TC, Auer DP. Gray matter-changes and correlates of disease severity in schizophrenia: a statistical parametric mapping study. NeuroImage. 2001;13:814–824. doi: 10.1006/nimg.2001.0751. [DOI] [PubMed] [Google Scholar]
- 50.Wolf RC, Höse A, Frasch K, Walter H, Vasic N. Volumetric abnormalities associated with cognitive deficits in patients with schizophrenia. Eur Psychiatry. 2008;23:541–548. doi: 10.1016/j.eurpsy.2008.02.002. [DOI] [PubMed] [Google Scholar]
- 51.Wright IC, Ellison ZR, Sharma T, Friston KJ, Murray RM, McGuire PK. Mapping of grey matter changes in schizophrenia. Schizophr Res. 1999;35:1–14. doi: 10.1016/s0920-9964(98)00094-2. [DOI] [PubMed] [Google Scholar]
- 52.Yamada M, Hirao K, Namiki C, et al. Social cognition and frontal lobe pathology in schizophrenia: a voxel-based morphometric study. NeuroImage. 2007;35:292–298. doi: 10.1016/j.neuroimage.2006.10.046. [DOI] [PubMed] [Google Scholar]
- 53.Douaud G, Smith S, Jenkinson M, et al. Anatomically related grey and white matter abnormalities in adolescent-onset schizophrenia. Brain. 2007;130:2375–2386. doi: 10.1093/brain/awm184. [DOI] [PubMed] [Google Scholar]
- 54.Jayakumar PN, Venkatasubramanian G, Gangadhar BN, Janakiramaiah N, Keshavan MS. Optimized voxel-based morphometry of gray matter volume in first-episode, antipsychotic-naive schizophrenia. Prog Neuropsychopharmacol Biol Psychiatry. 2005;29:587–591. doi: 10.1016/j.pnpbp.2005.01.020. [DOI] [PubMed] [Google Scholar]
- 55.Kaspárek T, Prikryl R, Mikl M, Schwarz D, Cesková E, Krupa P. Prefrontal but not temporal grey matter changes in males with first-episode schizophrenia. Prog Neuropsychopharmacol Biol Psychiatry. 2007;31:151–157. doi: 10.1016/j.pnpbp.2006.08.011. [DOI] [PubMed] [Google Scholar]
- 56.Lui S, Deng W, Huang X, et al. Association of cerebral deficits with clinical symptoms in antipsychotic-naive first-episode schizophrenia: an optimized voxel-based morphometry and resting state functional connectivity study. Am J Psychiatry. 2009;166:196–205. doi: 10.1176/appi.ajp.2008.08020183. [DOI] [PubMed] [Google Scholar]
- 57.Schaufelberger MS, Duran FL, Lappin JM, et al. Grey matter abnormalities in Brazilians with first-episode psychosis. Br J Psychiatry. 2007;191:s117–s122. doi: 10.1192/bjp.191.51.s117. [DOI] [PubMed] [Google Scholar]
- 58.Whitford TJ, Farrow TF, Gomes L, Brennan J, Harris AW, Williams LM. Grey matter deficits and symptom profile in first episode schizophrenia. Psychiatry Res. 2005;139:229–238. doi: 10.1016/j.pscychresns.2005.05.010. [DOI] [PubMed] [Google Scholar]
- 59.Yoshihara Y, Sugihara G, Matsumoto H, et al. Voxel-based structural magnetic resonance imaging (MRI) study of patients with early onset schizophrenia. Ann Gen Psychiatry. 2008;7:25. doi: 10.1186/1744-859X-7-25. [DOI] [PMC free article] [PubMed] [Google Scholar]
- 60.Lui s Deng W, Huang X, Jiang L, et al. Neuroanatomical differences between familial and sporadic schizophrenia and their parents: an optimized voxel-based morphometry study. Psychiatry Res. 2009;171:71–81. doi: 10.1016/j.pscychresns.2008.02.004. [DOI] [PubMed] [Google Scholar]
- 61.McIntosh AM, Job DE, Moorhead WJ, et al. Genetic liability to schizophrenia or bipolar disorder and its relationship to brain structure. Am J Med Genet B Neuropsychiatr Genet. 2006;141:76–83. doi: 10.1002/ajmg.b.30254. [DOI] [PubMed] [Google Scholar]
- 62.Lancaster JL, Tordesillas-Gutiérrez D, Martinez M, et al. Bias between MNI and Talairach coordinates analyzed using the ICBM-152 brain template. Hum Brain Mapp. 2007;28:1194–1205. doi: 10.1002/hbm.20345. [DOI] [PMC free article] [PubMed] [Google Scholar]
- 63.Brett M. The MNI Brain and the Talairach Atlas, Cambridge Imagers. 1999. http://imaging.mrc-cbu.cam.ac.uk/imaging/MniTalairach. Accessed July 30, 2009. [Google Scholar]
- 64.Turkeltaub PE, Eden GF, Jones KM, Zeffiro TA. Meta-analysis of the functional neuroanatomy of single-word reading: method and validation. NeuroImage. 2002;16:765–780. doi: 10.1006/nimg.2002.1131. [DOI] [PubMed] [Google Scholar]
- 65.Laird AR, Fox M, Price CJ, et al. ALE meta-analysis: controlling the false discovery rate and performing statistical contrasts. Hum Brain Mapp. 2005;25:155–164. doi: 10.1002/hbm.20136. [DOI] [PMC free article] [PubMed] [Google Scholar]
- 66.Fox PT, Laird AR, Lancaster JL. Coordinate-based voxel-wise meta-analysis: dividends of spatial normalization. Report of a virtual workshop. Hum Brain Mapp. 2005;25:1–5. doi: 10.1002/hbm.20139. [DOI] [PMC free article] [PubMed] [Google Scholar]
- 67.Allman JM, Hakeem A, Erwin JM, Nimchinsky E, Hof P. The anterior cingulate cortex. The evolution of an interface between emotion and cognition. Ann N Y Acad Sci. 2001;935:107–117. [PubMed] [Google Scholar]
- 68.Bush G, Luu P, Posner MI. Cognitive and emotional influences in anterior cingulate cortex. Trends Cogn Sci. 2000;4:215–222. doi: 10.1016/s1364-6613(00)01483-2. [DOI] [PubMed] [Google Scholar]
- 69.Drevets WC, Raichle ME. Reciprocal suppression of regional cerebral blood flow during emotional versus higher cognitive processes: implications for interactions between emotion and cognition. Cogn Emot. 1998;12:353–385. [Google Scholar]
- 70.Paus T, Petrides M, Evans AC, Meyer E. Role of the human anterior cingulate cortex in the control of oculomotor, manual, and speech responses: a positron emission tomography study. J Neurophysiol. 1993;70:453–469. doi: 10.1152/jn.1993.70.2.453. [DOI] [PubMed] [Google Scholar]
- 71.Badgaiyan RD, Posner MI. Mapping the cingulate cortex in response selection and monitoring. NeuroImage. 1998;7:255–260. doi: 10.1006/nimg.1998.0326. [DOI] [PubMed] [Google Scholar]
- 72.Turken AU, Swick D. Response selection in the human anterior cingulate cortex. Nat Neurosci. 1999;2:920–924. doi: 10.1038/13224. [DOI] [PubMed] [Google Scholar]
- 73.Gehring WJ, Knight RT. Prefrontal-cingulate interactions in action monitoring. Nat Neurosci. 2000;3:516–520. doi: 10.1038/74899. [DOI] [PubMed] [Google Scholar]
- 74.Luu P, Flaisch T, Tucker DM. Medial frontal cortex in action monitoring. J Neurosci. 2000;20:464–469. doi: 10.1523/JNEUROSCI.20-01-00464.2000. [DOI] [PMC free article] [PubMed] [Google Scholar]
- 75.Bush G, Vogt BA, Holmes J, et al. Dorsal anterior cingulate cortex: a role in reward-based decision making. Proc Natl Acad Sci U S A. 2002;99:523–528. doi: 10.1073/pnas.012470999. [DOI] [PMC free article] [PubMed] [Google Scholar]
- 76.Diforio D, Walker EF, Kestler LP. Executive functions in adolescents with schizotypal personality disorder. Schizophr Res. 2000;42:125–134. doi: 10.1016/s0920-9964(99)00119-x. [DOI] [PubMed] [Google Scholar]
- 77.Szeszko PR, Bilder RM, Lencz T, et al. Reduced anterior cingulate gyrus volume correlates with executive dysfunction in men with first-episode schizophrenia. Schizophr Res. 2000;43:97–108. doi: 10.1016/s0920-9964(99)00155-3. [DOI] [PubMed] [Google Scholar]
- 78.Suzuki M, Zhou S-Y, Hagino H, et al. Morphological brain changes associated with Schneider's first-rank symptoms in schizophrenia: a MRI study. Psychol Med. 2005;35:549–560. doi: 10.1017/s0033291704003885. [DOI] [PubMed] [Google Scholar]
- 79.Kopelman A, Andreasen NC, Nopoulos P. Morphology of the anterior cingulate gyrus in patients with schizophrenia: relationship to typical neuroleptic exposure. Am J Psychiatry. 2005;162:1872–1878. doi: 10.1176/appi.ajp.162.10.1872. [DOI] [PubMed] [Google Scholar]
- 80.Chua SE, Deng Y, Chen EYH, et al. Early striatal hypertrophy in first-episode psychosis within three weeks of initiating antipsychotic drug treatment. Psychol Med. 2009;39:793–800. doi: 10.1017/S0033291708004212. [DOI] [PubMed] [Google Scholar]
- 81.Chakos MH, Lieberman JA, Bilder RM, et al. Increase in caudate nuclei volumes of first-episode schizophrenic patients taking antipsychotic drugs. Am J Psychiatry. 1994;151:1430–1436. doi: 10.1176/ajp.151.10.1430. [DOI] [PubMed] [Google Scholar]
- 82.Gur RE, Maany V, Mozley PD, Swanson C, Bilker W, Gur RC. Subcortical MRI volumes in neuroleptic-naive and treated patients with schizophrenia. Am J Psychiatry. 1998;155:1711–1717. doi: 10.1176/ajp.155.12.1711. [DOI] [PubMed] [Google Scholar]
- 83.Corson PW, Nopoulos P, Miller DD, Arndt S, Andreasen NC. Change in basal ganglia volume over 2 years in patients with schizophrenia: typical versus atypical neuroleptics. Am J Psychiatry. 1999;156:1200–1204. doi: 10.1176/ajp.156.8.1200. [DOI] [PubMed] [Google Scholar]
- 84.Dazzan P, Morgan K, Orr K, et al. The structural brain correlates of neurological soft signs in ÆSOP first-episode psychoses study. Brain. 2004;127:143–153. doi: 10.1093/brain/awh015. [DOI] [PubMed] [Google Scholar]
- 85.Girgis RR, Diwadkar VA, Nutche JJ, Sweeney JA, Keshavan MS, Hardan AY. Risperidone in first-episode psychosis: a longitudinal, exploratory voxel-based morphometric study. Schizophr Res. 2006;82:89–94. doi: 10.1016/j.schres.2005.10.019. [DOI] [PubMed] [Google Scholar]
- 86.Massana G, Salgado-Pineda P, Junque C, et al. Volume changes in gray matter in first-episode neuroleptic-naïve schizophrenic patients treated with risperidone. J Clin Psychopharmacol. 2005;25:111–117. doi: 10.1097/01.jcp.0000155818.29091.53. [DOI] [PubMed] [Google Scholar]
- 87.Jang D, Kim JJ, Chung T, et al. Shape deformation of the insula in schizophrenia. NeuroImage. 2006;32:220–227. doi: 10.1016/j.neuroimage.2006.01.032. [DOI] [PubMed] [Google Scholar]
- 88.Curtis VA, Bullmore ET, Brammer MJ, et al. Attenuated frontal activation during a verbal fluency task in patients with schizophrenia. Am. J Psychiatry. 1998;155:1056–1063. doi: 10.1176/ajp.155.8.1056. [DOI] [PubMed] [Google Scholar]
- 89.Ramautar JR, Slagter HA, Kok A, Ridderinkhof KR. Probability effects in the stop-signal paradigm: the insula and the significance of failed inhibition. Brain Res. 2006;1105:143–154. doi: 10.1016/j.brainres.2006.02.091. [DOI] [PubMed] [Google Scholar]
- 90.Menon V, Adleman NE, White CD, Glover GH, Reiss AL. Error-related brain activation during a Go/NoGo response inhibition task. Hum Brain Mapp. 2001;12:131–143. doi: 10.1002/1097-0193(200103)12:3<131::AID-HBM1010>3.0.CO;2-C. [DOI] [PMC free article] [PubMed] [Google Scholar]
- 91.Lerner A, Bagic A, Hanakawa T, et al. Involvement of insula and cingulate cortices in control and suppression of natural urges. Cereb Cortex. 2009;19:218–223. doi: 10.1093/cercor/bhn074. [DOI] [PMC free article] [PubMed] [Google Scholar]
- 92.Jabbi M, Bastiaansen J, Keysers C. A common anterior insula representation of disgust observation, experience and imagination shows divergent functional connectivity pathways. PLoS ONE. 2008;3:e2939. doi: 10.1371/journal.pone.0002939. [DOI] [PMC free article] [PubMed] [Google Scholar]
- 93.Calder AJ, Keane J, Manes F, Antoun N, Young AW. Impaired recognition and experience of disgust following brain injury. Nat Neurosci. 2000;3:1077–1078. doi: 10.1038/80586. [DOI] [PubMed] [Google Scholar]
- 94.Park S, Matthews S, Gibson C. Imitation, simulation, and schizophrenia. Schizophr Bull. 2008;34:698–707. doi: 10.1093/schbul/sbn048. [DOI] [PMC free article] [PubMed] [Google Scholar]
- 95.Shergill SS, Cameron LA, Brammer MJ, Williams SCR, Murray RM, McGuire PK. Modality specific neural correlates of auditory and somatic hallucinations. J Neurol Neurosurg Psychiatry. 2001;71:688–690. doi: 10.1136/jnnp.71.5.688. [DOI] [PMC free article] [PubMed] [Google Scholar]
- 96.Phillips LK, Seidman LJ. Emotion processing in persons at risk for schizophrenia. Schizophr Bull. 2008;34:888–903. doi: 10.1093/schbul/sbn085. [DOI] [PMC free article] [PubMed] [Google Scholar]
- 97.Carlsson A, Waters N, Holm-Waters S, Tedroff J, Nilsson M, Carlsson ML. Interactions between monoamines, glutamate, and GABA in schizophrenia: new evidence. Annu Rev Pharmacol Toxicol. 2001;41:237–260. doi: 10.1146/annurev.pharmtox.41.1.237. [DOI] [PubMed] [Google Scholar]
- 98.Meador-Woodruff JH, Kleinman JE. Neurochemistry of schizophrenia: glutamergic abnormalities. In: Davis KL, Charney D, Coyle JT, Nemeroff C, editors. Neuropsychopharmacology: The Fifth Generation of Progress. Philadelphia: Lippincott, Williams and Wilkins; 2002. [Google Scholar]
- 99.Deutsch SI, Rosse RB, Schwartz BL, Mastropaolo J. A revised excitotoxic hypothesis of schizophrenia: therapeutic implications. Clin Neuropharmacol. 2001;24:43–49. doi: 10.1097/00002826-200101000-00008. [DOI] [PubMed] [Google Scholar]
- 100.Stone JM, Morrison PD, Pilowsky LS. Glutamate and dopamine dysregulation in schizophrenia: a synthesis and selective review. J Psychopharmacol. 2007;21:440–452. doi: 10.1177/0269881106073126. [DOI] [PubMed] [Google Scholar]