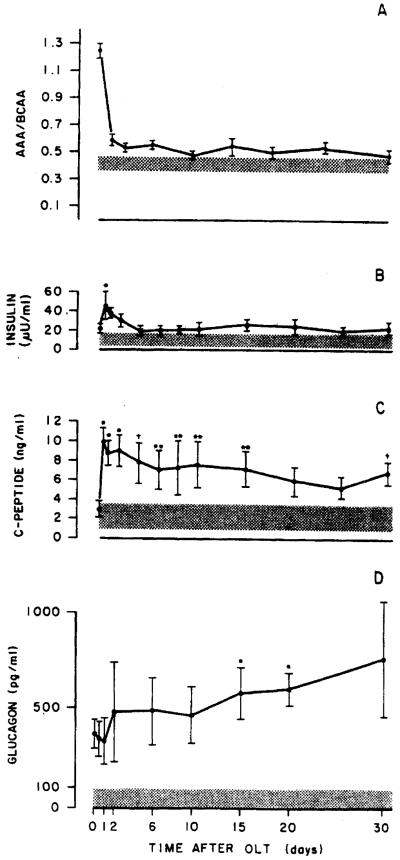
Figure 6.
Schematic figure showing the sequential changes in the ratio of AAA to BCAA, insulin, C-peptide, and glucagon in 8 patients undergoing OLT but not having a mismatch in terms of liver size. The shaded orea is the range for normal individuals; the hrockets represent the SEM. The asterisk in panel B represents the single point at which it was statistically different (p < 0.051 from that observed at time zero. In panel C, a single asterisk indicates p < 0.005, a double asterlsk indicates p < 0.05, and a cross indicates p < 0.01 from that obtained at time zero. In panel D the asterlsk identifies the two times at which the glucagon level was significantly different from the level obtained at time zero. In panel A, all points obtained after time zero are significantly different from the data obtained at time zero.

