Abstract
Here we use the fluorescence from a genetically encoded unnatural amino acid, L-(7-hydroxycoumarin-4-yl)ethylglycine (HCE-Gly) replacing an amino acid in the regulatory site of Escherichia coli aspartate transcarbamoylase (ATCase) to decipher the molecular details of regulation of this allosteric enzyme. The fluorescence of HCE-Gly is exquisitely sensitive to the binding of all four nucleotide effectors. Although ATP and CTP are primarily responsible for influencing enzyme activity, the results of our fluorescent binding studies indicate that UTP and GTP bind with similar affinities, suggesting a dissociation between nucleotide binding and control of enzyme activity. Furthermore, while CTP is the strongest regulator of enzyme activity, it binds selectively to only a fraction of regulatory sites, allowing UTP to effectively fill the residual ones. Our results suggest that CTP and UTP are not competing for the same binding sites, but instead reveal an asymmetry between the two allosteric sites on the regulatory subunit of the enzyme. Correlation of binding and activity measurements explain how ATCase uses asymmetric allosteric sites to achieve regulatory sensitivity over a broad range of heterotropic effector concentrations.
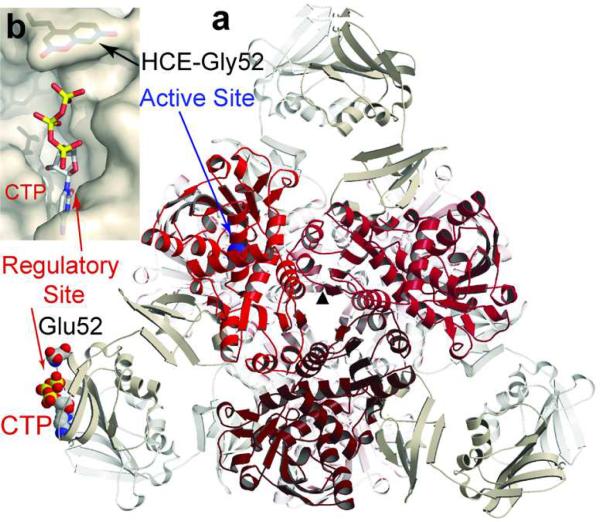
Enzymes responsible for catalyzing the committed step of critical metabolic pathways, such as aspartate transcarbamoylse (ATCase) in pyrimidine nucleotide biosynthesis, are often regulated by allosteric mechanisms. Allosteric regulation provides a rapid means for turning a pathway on or off dictated by the specific needs of the cell at any point in time. Escherichia coli ATCase has been investigated extensively and has come to serve as a paradigm for allosteric enzymes (1). ATCase is regulated by both homotropic and heterotropic effectors involving the cooperative binding of the second substrate, aspartate, at the active site and nucleotide binding at the allosteric site. The active and allosteric sites are located ~60Å apart on different polypeptide chains of the holoenzyme, a dodecamer composed of six catalytic chains (c) and six regulatory chains (r) (Figure 1, panel a), which can be dissociated into two catalytically active trimers (c3) and three nucleotide-binding regulatory dimers (r2) (2).
Figure 1.
Structural model of CTP bound to HCE-Gly52R ATCase. a) The structure of ATCase viewed down the three-fold axis (σ). The three c chains of the top trimer are shown in shades of red, three of the six r chains closer to the viewer are shown in tan. The three c and three r chains more distal are shown in light gray. For an adjacent c and r chain, the active and regulatory sites are labeled. Also shown is the location of Glu52 and CTP bound to the regulatory site in one r chain. b) Surface representation of the allosteric site with CTP bound, and HCE-Gly52R modeled in position.
Kinetic studies revealed activation by ATP, inhibition by CTP, and the synergistic inhibition of UTP in the presence of CTP (3). However, the elucidation of the allosteric mechanism of regulation in ATCase has been exceedingly difficult with many conflicting results. The interactions of the regulatory nucleotides with the enzyme have been investigated using a variety of methods including equilibrium dialysis (4–8), continuous-flow dialysis (9), nuclear magnetic resonance (10, 11), site-specific mutagenesis (8, 10–13), and X-ray crystallography (14, 15). Some of these experiments indicate two classes of nucleotide binding sites with differing affinities suggesting either a non-equivalence of binding sites or negative cooperativity (7). However, these methods lack the sensitivity to accurately measure weak interactions such as the binding of UTP, as well as the binding of nucleotides to the low-affinity sites. Also, the current methods do not allow differentiation between the binding of nucleotides to the allosteric site and nonspecific binding at the active site unless the active site is blocked. However, the ligands used to block the active sites are known to induce conformational changes that may indirectly alter the affinity of the allosteric sites (16). In addition, allosteric regulation must respond rapidly to the fluctuating conditions in the cell, but current methods do not allow time-dependent measurements to investigate the rates of nucleotide binding.
The work by Schultz and coworkers (17), to incorporate unnatural amino acids into the structure of proteins, has provided new tools to study complex processes in biological systems. Here we use these tools to introduce a fluorescent amino acid in the regulatory site of ATCase, providing us a means to directly monitor and dissect nucleotide binding to the enzyme without the complexities and limitations of current methods. These experiments validate the usefulness of the methods developed by Schultz and coworkers to incorporate an unnatural amino acid into not only ATCase but other systems as well. In particular, we applied the methodology of Wang et al. (18) to incorporate the amino acid L-(7-hydroxycoumarin-4-yl)ethylglycine (HCE-Gly) site-specifically into the regulatory chain of ATCase at the allosteric binding pocket to create a fluorescent version of the enzyme that is exquisitely sensitive to nucleotide binding. The 7-hydroxycoumarin side chain is ideal to monitor nucleotide binding because it displays a high fluorescence quantum yield, relatively large Stoke's shift and is sensitive to pH and solvent polarity. This fluorescent ATCase provides not only a tool to monitor nucleotide binding to both the high and low affinity sites, but also a means to measure time-dependent binding through the use of stopped-flow spectrofluorimetry.
RESULTS AND DISCUSSION
Selection of HCE-Gly Incorporation Site
The ideal location to place HCE-Gly in the allosteric site of ATCase would be one in which its location does not influence the binding of the nucleotides to the allosteric site, but nucleotide binding should perturb the local environment of the HCE-Gly in such a fashion that its fluorescence would be altered. Candidate positions were selected by visual inspection and tested by model building and energy minimization to determine if the HCE-Gly significantly altered the regulatory binding pocket (Figure 1, panel b). From these studies two sites were selected for incorporation of HCE-Gly; Glu52R or Leu58R.
Expression and Purification of HCE-Gly ATCase
The expression and suppression system required the use of two plasmids. The first had the E. coli pyrBI operon, coding for the catalytic and regulatory chains of ATCase, in plasmid pBAD/JYAMB-4TAG-Myo (18), replacing the portion containing the myoglobin gene and the codons at position 52 or 58 in the r chain of ATCase site-specifically altered to TAG, the amber stop codon. This plasmid also carried the gene encoding the special Methanococcus jannaschii tyrosyl amber suppressor tRNA (18). The second plasmid, pBK-CouRS-D8 (18), contains the gene for the mutant M. jannaschii tRNA synthetase specific for HCE-Gly. The expression was performed by growth of Top10 cells (Invitrogen) containing both of the above plasmids in media supplemented by 1.0 mM HCE-Gly, which was synthesized as described previously (18). Purification was accomplished in two steps. The first employed metal affinity chromatography to purify the enzyme. However, this resulted in a mixture of holoenzyme (c6r6) and excess catalytic subunit (c3) (Figure 2, panel a). The holoenzyme was purified to homogeneity by hydrophobic interaction chromatography (Figure 2, panel b). The levels of suppression of the TAG codon were significantly different between the two sites with position 52 proving to be better.
Figure 2.
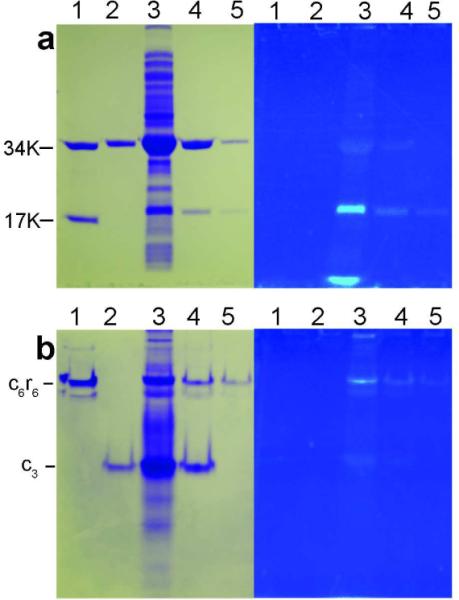
Purification of HCE-Gly52R ATCase. SDS PAGE (a) and nondenaturing PAGE (b) visualized by coomassie blue stain (a and b, left) or fluorescence (a and b, right) of the purification of the HCE-Gly52R ATCase. Lanes 1, wild-type ATCase; Lanes 2, E. coli ATCase c3 containing a C-terminal His tag; Lanes 3, total soluble protein from cell lysate; Lanes 4, HCE-Gly52R ATCase after column purification employing Chelating Sepharose Fast Flow (GE Healthcare) charged with Ni2+; Lanes 5, HCE-Gly52R ATCase after column purification employing Phenyl Sepharose (GE Healthcare).
Kinetic Properties of HCE-Gly52R ATCase
The HCE-Gly52R ATCase was subjected to a battery of kinetic measurements which verified that the mutant enzyme exhibited similar kinetic parameters to the wild-type enzyme including maximal velocity, half saturation of aspartate, Hill coefficient, and activation and inhibition by ATP and CTP respectively (Table 1, Supplementary Figures 1 & 2). Thus, the incorporation of the HCE-Gly at position 52 produced a functional ATCase with kinetic properties very similar to the wild-type enzyme, making the HCE-Gly52R ATCase a model for the wild-type holoenzyme, albeit with the addition of a fluorescence sensor in the regulatory binding site.
TABLE 1.
Kinetic parameters of the wild-type and HCE-Gly52R ATCasea
| pH | Vmaxb | [Asp]0.5 | nHc | |
|---|---|---|---|---|
| Wild-type | 8.3 | 16.6 ± 0.4 | 12.6 ± 0.1 | 3.1 ± 0.4 |
| 7.0 | 10.4 ± 0.1 | 7.5 ± 0.2 | 2.1 ± 0.2 | |
| HCE-Gly52R | 8.3 | 16.8 ± 2.2 | 12.6 ± 0.7 | 2.7 ± 0.3 |
| 7.0 | 8.7 ± 0.3 | 7.7 ± 0.5 | 1.7 ± 0.3 |
All experiments were performed at 25 °C in 50 mM Tris-acetate buffer (pH 8.3) or 20 mM Bis-Tris, 20 mM Tris, 20 mM CAPS buffer (pH 7.0) at a saturating CP concentration (4.8 mM). The values reported are the average deviation of four determinations.
The maximal observed velocity (mmol h−1 mg−1)
Hill coefficient
HCE-Gly52R ATCase Fluorescence Sensitivity to Nucleotides
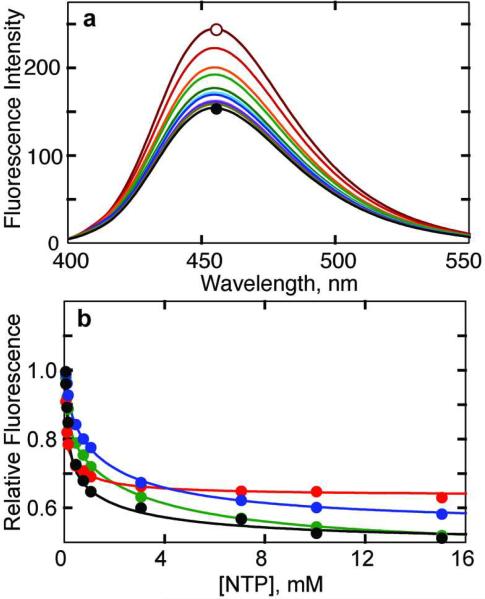
Upon addition of ATP or CTP to the HCE-Gly52R ATCase there was a dramatic alteration in fluorescence intensity with little or no shift in the emission maximum (Figure 3, panel a). Crystallography studies have shown that the ribose triphosphate portions of ATP and CTP bind in essentially the same part of the nucleotide-binding site. Therefore one might expect to also observe an interaction of the enzyme with other nucleotides such as UTP and GTP, although it has been reported that these nucleotides do not alter the activity of the enzyme alone or in nucleotide combinations (19). Nevertheless, UTP or GTP alone was able to drastically alter the fluorescence intensity of the HCE-Gly52R ATCase (Figure 3, panel b; Supplementary Table 1). The biphasic nature of nucleotide binding is particularly apparent in the data for ATP, UTP and GTP. These data clearly establish the binding of UTP and GTP to the enzyme with affinity comparable to ATP and suggest two classes of binding sites with differing affinity. The reduction in fluorescence induced by CTP is less than the other nucleotides, and for CTP these data suggest only one class of binding sites or if there are two classes of sites the affinity of the weaker sites is too low to be detected.
Figure 3.
Monitoring nucleotide binding to HCE-Gly52R ATCase by fluorescence. a) Fluorescence spectrum of HCE-Gly52R ATCase as a function of the CTP concentrations. 50 μg ml−1 of HCE-Gly52R ATCase in 50 mM Tris-acetate pH 8.3 at 25 °C was excited at 360 nm and the emission spectrum was measured from 400–550 nm. The open circle represents the spectrum of enzyme in the absence of CTP. As the CTP concentration was increased to 15 mM (closed circle) in 12 aliquots, the emission intensity at 455 nm decreased significantly. b) Alteration in the fluorescence of the HCE-Gly52R ATCase upon the binding of ATP (green), CTP (red), and UTP (blue), and GTP (black). The fluorescence intensity at 455 nm was normalized to the highest value (0 mM NTP) and plotted versus the nucleotide concentration. Conditions similar to those used in part a.
pH Dependence of HCE-Gly
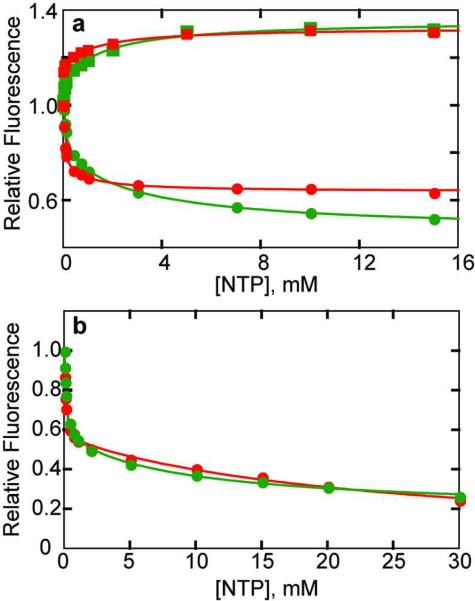
The alteration in the fluorescence of the HCE-Gly52R ATCase is dramatically different at pH 7 and pH 8.3. Each nucleotide caused a reduction in the fluorescence at 8.3, while each caused an increase in fluorescence at pH 7 (Figure 4, panel a). The altered response due to nucleotide binding at these two pH values can be partially attributed to the pH dependence of the HCE-Gly, the 7-hydroxyl group of which has a pKa=7.8 (20). The decrease in fluorescence due to NTP binding at pH 8.3 can be attributed to an increase in the pKa of the HCE-Gly induced by close proximity of the negative charges of the phosphates of the NTPs to the position of the HCE-Gly52R (Figure 1, panel b). At pH 7, the situation is somewhat different since the 7-hydroxyl group of HCE-Gly should be almost fully protonated. Under these pH conditions, the binding of the nucleotide acts to increase the local hydrophilicity of the environment of the HCE-Gly52R, which would cause an increase in fluorescence intensity. Thus, different aspects of nucleotide binding to the enzyme can be probed depending upon the pH at which the experiment is performed.
Figure 4.
ATP and CTP binding to HCE-Gly52R ATCase and the isolated regulatory subunit. a) Alteration in the fluorescence of the HCE-Gly52R ATCase upon the binding of ATP (green) and CTP (red) at pH 7.0 (squares) and 8.3 (circles). 50 μg ml−1 of HCE-Gly52R ATCase in 50 mM Tris-acetate buffer at pH 8.3 or 20 mM Bis-Tris, 20mM Tris, 20mM CAPS buffer at pH 7.0 at 25 °C was excited at 360 or 330 nm respectively. The fluorescence intensity at 455 nm was normalized to the first data point (0 mM NTP) and plotted versus the nucleotide concentration. b) Alteration in the fluorescence of the HCE-Gly52R r2 species upon the binding of ATP (green) and CTP (red) at pH 8.3. Conditions similar to those part a.
Binding of ATP and CTP to the Isolated Regulatory Subunit
Previous binding studies of ATP and CTP to the isolated regulatory subunit (r2) indicated that only one molecule of nucleotide bound per homodimeric regulatory subunit (6). As seen in Figure 4, panel b, when the binding of ATP or CTP to the HCE-Gly52R r2 was monitored, the fluorescence response of each nucleotide exhibited a biphasic binding isotherm, consistent with high and low affinity sites. Furthermore, both nucleotides exhibit similar affinity to both classes of binding sites, however, the difference in affinity between the high and low affinity sites is even greater than that observed for the binding of these nucleotides to the holoenzyme (compare Figure 4, panel a and b). Although these experiments do not distinguish between a preexisting or induced asymmetry, the observed asymmetry does exist upon the binding of nucleotides and allows the two binding sites on one regulatory subunit to be distinguished.
Competitive or Synergic Binding of CTP and UTP
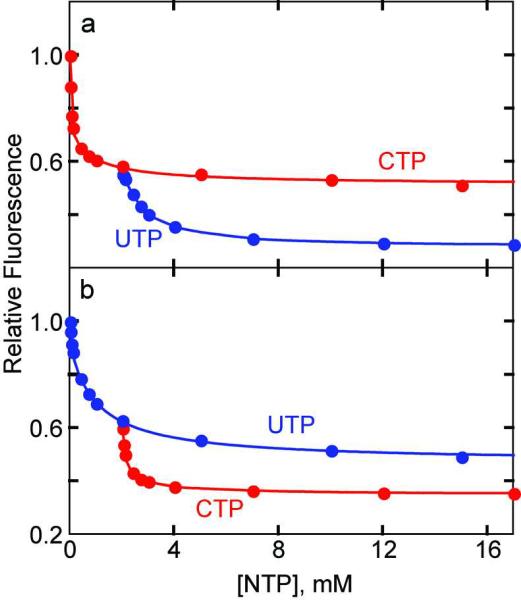
The functional significance of the enzyme having two classes of regulatory sites, which are distinguishable by their different affinity, may explain why UTP can only inhibit the enzyme in the presence of CTP (3). To test this, the fluorescence response to the binding of CTP and UTP alone and in combination was measured (Figure 5). The binding of CTP (Figure 5, panel a) or UTP (Figure 5, panel b) alone to the HCE-Gly52R holoenzyme results in a biphasic reduction in relative fluorescence intensity, with maximal reductions of 49% and 51% for CTP and UTP, respectively at the highest nucleotide concentration tested, 15 mM. The binding affinity of CTP was higher than UTP for the high affinity sites. In separate experiments, the binding UTP in the presence of 2 mM CTP (Figure 5, panel a) and the binding of CTP in the presence of 2 mM UTP (Figure 5, panel b) were determined. The second nucleotide dramatically reduced the fluorescence intensity, with UTP reducing the intensity of the enzyme•CTP complex an additional 22% and CTP reduced the intensity of the enzyme•UTP complex an additional 14%. The binding of CTP to the enzyme•UTP complex resulted in a less substantial reduction in fluorescence that may also be obtained with much higher saturation of UTP alone. However, the total inhibition with the combination of both nucleotides was significantly higher than observed for any one nucleotide binding in isolation at the concentrations tested. Thus, at the concentration that CTP exhibits maximal inhibition, (1–2 mM), UTP can still bind and cause a further diminution in fluorescence.
Figure 5.
Interaction of ATCase with CTP and UTP. a) Alteration in the fluorescence of the HCE-GLy52R ATCase at pH 8.3 upon the binding of UTP to the enzyme•CTP complex. The red circles represent saturation with CTP only, and the blue circles represent saturation with UTP in the presence of 2 mM CTP. b) Alteration in the fluorescence of the HCE-Gly52R ATCase upon the binding of CTP to the enzyme•UTP complex. The blue circles represent saturation with UTP only, and the red circles represent the saturation with CTP in the presence of 2 mM UTP. 50 μg mL−1 of HCE-Gly52R ATCase in 50mM Tris-acetate buffer at pH 8. at 25 °C was excited at 360 nm. The fluorescence intensity at 455 nm was normalized to the first data point (0 mM NTP) and plotted versus the nucleotide concentration.
Notably, CTP binds to the enzyme with similar affinity regardless of the presence of UTP and vice versa. If CTP and UTP were competing for the same binding site, the affinity would be drastically reduced in the presence of the competing nucleotide. Instead, our results suggest the two allosteric sites on a regulatory dimer are asymmetric. Whether or not the asymmetry is induced or preexisting, our data indicates that irrespective of which nucleotide binds first, the binding of the second occurs independently. It is tempting to speculate that the two essentially identical allosteric sites are functionally asymmetric.
Relationship between Allosteric Site Saturation and Enzyme Activity
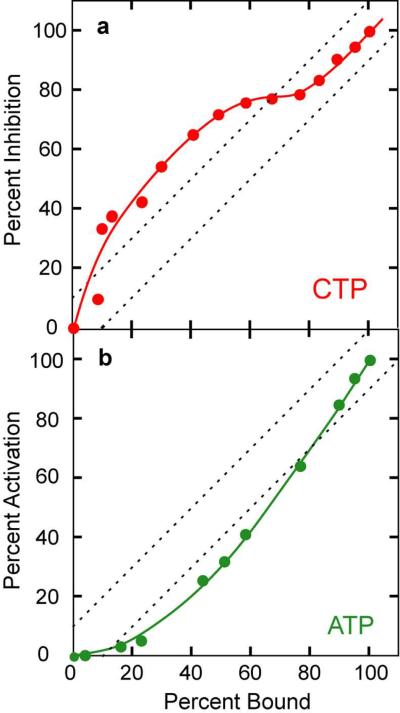
Functional asymmetry is supported by our experiments investigating the relationship between nucleotide binding and the corresponding extent of inhibition or activation of the enzyme. By comparing our fluorescent binding and our kinetic data for HCE-Gly52R ATCase, determined under identical conditions, the percent saturation of regulatory sites to the percent of inhibition by CTP or activation by ATP was determined (Figure 6). These data indicate a cooperative relationship between binding and activity. Notably, for CTP (Figure 6, panel a), significantly more inhibition occurs at low saturation of the allosteric sites, while for ATP (Figure 6, panel b) significantly more activation occurs at high saturation of the allosteric sites. It is tempting to speculate that the sites causing CTP inhibition are not the same sites that are causing the ATP activation.
Figure 6.
Relationship between the saturation of allosteric sites by CTP or ATP and inhibition or activation of enzyme activity. a) Percent saturation of regulatory sites versus the percent of maximum inhibition by CTP (red circles). The dashed lines delineate the approximate width of a 45° line due to experimental uncertainties. b) Percent saturation of regulatory sites versus the percent of maximum activation by ATP (green circles). Kinetic and fluorescence measurements performed at pH 8.3 as described in METHODS.
The typical cellular concentrations of CTP (0.5 mM) and ATP (6.0 mM) would be expected to be saturating in isolation, however there is significant sensitivity of ATCase to these nucleotides in their physiological range due to competition with other nucleotides present in the cell (19). Our data can be used to explain how ATCase displays sensitivity over a broad range of nucleotide concentrations, since significant activation requires nearly full saturation of the allosteric sites by ATP, while significant inhibition by CTP requires only about half saturation of the allosteric sites. Thus it is possible that the response of the nucleotides may be related to their specific binding to one or the other of the asymmetric allosteric sites within each regulatory dimer of the enzyme.
These experiments present a practical application for unnatural amino acid mutagenesis and help to decipher the complex nature of allosteric regulation. The incorporation of HCE-Gly into the allosteric site of ATCase provides an extremely sensitive method to measure nucleotide binding at both the high and low affinity sites, even for UTP which binds with relatively weak affinity. Binding measurements revealed similar affinities for all four nucleotides indicating that strength of binding does not necessarily dictate the extent of allosteric activation or inhibition of enzyme activity. This observation was confirmed by relating binding measurements with kinetic measurements that showed CTP being able to effectively inhibit enzyme activity at low percent binding, whereas ATP effectively enhances enzyme activity only at high percent binding. Due to the multimeric nature of ATCase, allosteric inhibition can be accomplished by CTP binding to only a few of the six regulatory sites, but ATP has to bind to many to enhance it. In addition, CTP binds selectively to only a fraction of regulatory sites with UTP able to fill the residual ones with similar affinity regardless of the presence of CTP. These findings suggest that the two essentially identical allosteric binding sites of each regulatory dimer appear to be functionally asymmetric.
METHODS
Selection of a site for incorporation of the HCE-Gly to monitor the binding of the regulatory nucleotides
Initial evaluation of possible positions of for placement of the HCE-Gly was performed visually using the structure of the ATCase•CTP complex determined to 2.2 Å resolution (PDB entry 1ZA1) (21). Candidate positions required that the side chain of the HCE-Gly would not interfere with the binding of CTP or cause a shift in the backbone of the structure. Positions 3, 48, 52, and 58 were selected as possible locations for incorporation of the HCE-Gly. For each candidate position the HCE-Gly was built into the structure followed by conjugate-gradient energy minimization using CNS (22). During the minimization the position of the CTP and the backbone were fixed. For comparison, a base structure was determined by minimizing the wild-type structure. Next, each of the minimized HCE-Gly structures was compared to the minimized base structure. An acceptable site for incorporation of the HCE-Gly required that the side chain of the HCE-Gly fit into the structure with no bad contacts, no significant alterations in the positions of nearby side chains, and no direct interactions with CTP.
Based upon the examination of the coordinates from these minimized structures, position 52 was selected for incorporation of the fluorescent amino acid because it is in close proximity to the allosteric site (approximately 5Å from the δ phosphate of CTP), it is not highly conserved among species, and the space occupied by the large Glu52 side chain could accommodate the side chain of HCE-Gly.
Mutagenesis and construction of expression plasmids
A TAG stop codon was introduced at the position corresponding to Glu52 of the regulatory chain of ATCase on plasmid pEK351 (23) by site-specific mutagenesis employing the Quick-Change Site-Directed Mutagenesis Kit (Qiagen) to produce plasmid pEK664. This plasmid contains the E. coli pyrBI operon with a His-tail added to the C-terminus of the catalytic chain. Site-directed mutagenesis was performed on pEK664 to introduce a Nco I site overlapping the ATG initiation codon of the pyrB gene to create pEK679. Finally, pEK679 and pBAD/JYAMB-4TAG-Myo (24) were digested with Nco I and Kpn I. The 1550 base pair Nco I to Kpn I fragment from pEK679 carrying the pyrBI gene and the backbone of pBAD/JYAMB-4TAG-Myo (24) were isolated after agarose gel electrophoresis using the QIAquick Gel Extraction Kit from Qiagen. These fragments were mixed and treated with T4 DNA Ligase in 1XT4 DNA ligase buffer supplied by New England Biolabs at 16 °C for 16 hours to create plasmid pEK684. To generate a plasmid to express only the fluorescent regulatory chain, the 1000 base pair pyrB region was removed from pEK684 by digesting with NdeI, isolating the backbone after agarose gel electrophoresis using the QIAquick Gel Extraction Kit from Qiagen, and treating with T4 DNA Ligase in 1XT4 DNA ligase buffer supplied by New England Biolabs at 16 °C for 16 hours to create plasmid pEK692. The plasmids pEK684 and pEK692 have the pyrBI, or pyrI operon, respectively, under the control of the arabinose promotor, the gene for resistance to tetracycline, and the gene for the Methanococcus janaschii amber suppressor tRNA that uniquely specifies HCE-Gly in response to the TAG codon.
Synthesis of L-(7-hydroxycoumarin-4-yl)ethylglycine
The synthesis of the fluorescent amino acid HCE-Gly was completed as described previously (24). The product was analyzed using 1H-NMR and LC-MS (ESI).
Expression and purification of HCE-Gly52R ATCase and HCE-Gly52R regulatory Dimers
Plasmid pEK684 (to express the holoenzyme) or plasmid pEK692 (to express the regulatory chain) was cotransformed with pBK-CouRS-D8 into competent Top10 cells (Invitrogen) and plated on 2 YT plates (25) with 50 μg/ml kanamycin and 12.5 μg/ml tetracycline. A starter culture with the same antibiotics was used to inoculate 500 ml of liquid M9 glycerol minimal media supplemented with 0.5% casamino acids (Bacto), appropriate antibiotics, and 1.0 mM HCE-Gly. Cells were then grown at 37 °C to an OD600 of 0.5 and protein expression was induced by the addition of 0.2% arabinose. After further incubation at 37 °C for 12 hours, cells were harvested by centrifugation and lysed by sonication. This system has been reported to have a minimum of 95% incorporation purity for HCE-Gly into myoglobin determined by ESI protein mass spectrometric analysis (24).
Because the gene for the regulatory chain (pyrI) follows the gene for the catalytic chain (pyrB) on the pyrBI operon, excess catalytic chain was produced due to the inefficiency of suppression of the amber codon in the pyrI gene. The large excess of catalytic chain, in conjunction with the location of the His-tag on the catalytic chain complicated the purification of the HCE-Gly52R ATCase holoenzyme, requiring a three-step purification to be developed. The HCE-Gly52R ATCase was first purified by column chromatography employing Chelating Sepharose Fast Flow (GE Healthcare) that was charged with Ni2+. The HCE-Gly52R ATCase holoenzyme and contaminating ATCase catalytic subunit were eluted with 400 mM imidazole. The catalytic subunits were removed by column chromatography employing Phenyl Sepharose (GE Healthcare). The fractions containing the fluorescent HCE-Gly52R ATCase were pooled and extensively dialyzed against 50 mM Tris-acetate buffer at pH 8.3. Purity was verified by both SDS (26) and nondenaturing (27, 28) PAGE.
The HCE-Gly52R regulatory dimers were first purified by precipitation with 65% saturated ammonium sulfate. The precipitated material was suspended in buffer containing 50 mM Tris pH 8.3, 2 mM 2-mercaptoethanol, and 50 μM zinc chloride. The solution was further purified using ion-exchange chromatography employing Quaternary Fast Flow (GE Healthcare) by elution with 0.5 M NaCl. A second step of column chromatography employing Phenyl Sepharose purified the regulatory dimers to homogeneity. Purity was verified by SDS (26) PAGE (Supplementary Figure 1).
Aspartate transcarbamoylase activity assay
The activity of ATCase was measured at 25 °C by the colorimetric method (29). Aspartate saturation curves (Supplementary Figure 2), ATP activation curves, and CTP inhibition curves (Supplementary Figure 3) were performed in duplicate. Assays were performed in 50 mM Tris acetate buffer, pH 8.3, or in a tripart buffer at pH 7.0 containing 20 mM Bis Tris, 20 mM Tris, and 20 mM Caps buffer, in the presence of a saturating concentration of carbamoyl phosphate (4.8 mM). Data analysis of the steady-state kinetics was carried out as described previously (30). Fitting of the experimental data to theoretical equations was accomplished by non-linear regression. The data was analyzed using an extension of the Hill equation that included a term for substrate inhibition (31).
Steady-state fluorescence measurements for nucleotide binding to HCE-Gly52R ATCase and HCE-Gly52R regulatory dimers
All steady-state measurements were performed using a JASCO spectrofluorometer FP-6300 in a quartz SUPRASIL fluorescence cell (Hellma) with a slit width of 5 nm at 25 °C in 50 mM Tris-acetate buffer pH 8.3, or the tripart buffer at pH 7.0, and HCE-Gly52R ATCase or r2 at a concentration of 50 μg ml−1. An excitation spectrum from 300–500 nm was acquired to determine the maximum excitation wavelength. Using an excitation wavelength of 360 nm at pH 8.3 or 330 nm at pH 7.0, a fluorescence spectrum from 400–600nm was acquired in the absence of nucleotides with maximum emission at 455 nm. Microliter amounts of the nucleotides ATP, CTP, UTP, or GTP were added to the fluorescence cell up to a concentration of 15 mM. At each concentration of nucleotide, a fluorescence spectrum was measured. These tests were repeated using the same volume of buffer in place of the nucleotides to adjust for dilution. The tests were also repeated using free amino acid HCEGly and nucleotides in the absence of the HCE-Gly52R ATCase. The maximum fluorescence intensity at each concentration was determined and the data fit by non-linear least squares to an equation for binding at two classes of sites (Supplementary Table 1 & 2).
Supplementary Material
Acknowledgements
The authors wish to thank Dr. P. Schultz for providing the plasmids for the HCE-Gly incorporation and to Dr. J. Wang for helpful discussions. This research was supported by the U. S. National Institutes of Health grant GM026237.
REFERENCE
- 1.Lipscomb WN. Aspartate Transcarbamoylase from Escherichia coli: Activity and Regulation. Adv. Enzymol. 1994;68:67–151. doi: 10.1002/9780470123140.ch3. [DOI] [PubMed] [Google Scholar]
- 2.Gerhart JC, Holoubek H. The purification of aspartate transcarbamylase of Escherichia coli and separation of its protein subunits. J. Biol. Chem. 1967;242:2886–2892. [PubMed] [Google Scholar]
- 3.Wild JR, Loughrey-Chen SJ, Corder TS. In the presence of CTP, UTP becomes an allosteric inhibitor of aspartate transcarbamylase. Proc. Natl. Acad. Sci. U.S.A. 1989;86:46–50. doi: 10.1073/pnas.86.1.46. [DOI] [PMC free article] [PubMed] [Google Scholar]
- 4.Changeux J-P, Gerhart JC, Schachman HK. Allosteric Interactions in Aspartate Transcarbamoylase: Binding of Specific Ligands to the Native Enzyme and Isolated Subunits. Biochemistry. 1968;7:531–538. doi: 10.1021/bi00842a007. [DOI] [PubMed] [Google Scholar]
- 5.Matsumoto S, Hammes GG. Equilibrium binding study of the interaction of aspartate transcarbamoylase with cytidine 5'-triphosphate and adenosine 5'-triphosphate. Biochemistry. 1973;12:1388–1394. doi: 10.1021/bi00731a019. [DOI] [PubMed] [Google Scholar]
- 6.Suter P, Rosenbusch JP. Asymmetry of binding and physical assignments of CTP and ATP sites in aspartate transcarbamoylase. J. Biol. Chem. 1977;252:8136–8141. [PubMed] [Google Scholar]
- 7.Winlund CC, Chamberlin MJ. Binding of cytidine triphosphate to aspartate transcarbamylase. Biochem. Biophys. Res. Commun. 1970;40:43–49. doi: 10.1016/0006-291x(70)91043-0. [DOI] [PubMed] [Google Scholar]
- 8.Zhang Y, Kantrowitz ER. The synergistic inhibition of Escherichia coli aspartate carbamoyltransferase by UTP in the presence of CTP is due to the binding of UTP to the low affinity CTP sites. J. Biol. Chem. 1991;266:22154–22158. [PubMed] [Google Scholar]
- 9.England P, Hervé G. Synergistic Inhibition of Escherichia coli Aspartate Transcarbamoylase by CTP and UTP: Binding Studies Using Continuous-Flow Dialysis. Biochemistry. 1992;31:9725–9732. doi: 10.1021/bi00155a028. [DOI] [PubMed] [Google Scholar]
- 10.London RE, Schmidt PG. Nuclear Magnetic Resonance Study of the Interaction of Inhibitory Nucleosides with Escherichia coli Aspartate Transcarbamylase and its Regulatory Subunit. Biochemistry. 1974;13:1170–1179. doi: 10.1021/bi00703a018. [DOI] [PubMed] [Google Scholar]
- 11.Moore AC, Browne DT. Binding of Regulatory Nucleotides to Aspartate Transcarbamoylase: Nuclear Magnetic Resonance Studies of Selectively Enriched Carbon-13 Regulatory Subunit. Biochemistry. 1980;19:5768–5773. doi: 10.1021/bi00566a016. [DOI] [PubMed] [Google Scholar]
- 12.Zhang Y, Kantrowitz ER. Lysine-60 in the regulatory chain of Escherichia coli aspartate transcarbamylase is important for the discrimination between CTP and ATP. Biochemistry. 1989;28:7313–7318. doi: 10.1021/bi00444a025. [DOI] [PubMed] [Google Scholar]
- 13.Zhang Y, Ladjimi MM, Kantrowitz ER. Site-directed mutagenesis of a residue located in the regulatory site of Escherichia coli aspartate transcarbamylase. J. Biol. Chem. 1988;263:1320–1324. [PubMed] [Google Scholar]
- 14.Gouaux JE, Stevens RC, Lipscomb WN. Crystal structures of aspartate carbamoyltransferase ligated with phosphonoacetamide, malonate and CTP or ATP at 2.8 Å resolution and neutral pH. Biochemistry. 1990;29:7702–7715. doi: 10.1021/bi00485a020. [DOI] [PubMed] [Google Scholar]
- 15.Stevens RC, Gouaux JE, Lipscomb WN. Structural consequences of effector binding to the T state of aspartate carbamoyltransferase: Crystal structures of the unligated and ATP- and CTP-complexed enzymes at 2.6 Å Resolution. Biochemistry. 1990;29:7691–7701. doi: 10.1021/bi00485a019. [DOI] [PubMed] [Google Scholar]
- 16.Wang J, Stieglitz KA, Cardia JP, Kantrowitz ER. Structural basis for ordered substrate binding and cooperativity in aspartate transcarbamoylase. Proc. Natl. Acad. Sci. U. S. A. 2005;102:8881–8886. doi: 10.1073/pnas.0503742102. [DOI] [PMC free article] [PubMed] [Google Scholar]
- 17.Wang L, Xie J, Schultz PG. Expanding the genetic code. Annu Rev Biophys Biomol Struct. 2006;35:225–249. doi: 10.1146/annurev.biophys.35.101105.121507. [DOI] [PubMed] [Google Scholar]
- 18.Wang J, Xie J, Schultz P. A genetically encoded fluorescent amino acid. J. Am. Chem. Soc. 2006;128:8738–8739. doi: 10.1021/ja062666k. [DOI] [PubMed] [Google Scholar]
- 19.Rabinowitz JD, Hsiao JJ, Gryncel KR, Kantrowitz ER, Feng XJ, Li G, Rabitz H. Dissecting enzyme regulation by multiple allosteric effectors: nucleotide regulation of aspartate transcarbamoylase. Biochemistry. 2008;47:5881–5888. doi: 10.1021/bi8000566. [DOI] [PMC free article] [PubMed] [Google Scholar]
- 20.Adamczyk M, Cornwell M, Huff J, Rege S, Rao T. Novel 7-Hydroxyfoumarin Based Fluorescent Labels. Bioorganic & Medicinal Chemistry Letters. 1997;7:1985–1988. [Google Scholar]
- 21.Wang J, Stieglitz KA, Cardia JP, Kantrowitz ER. Structural basis for ordered substrate binding and cooperativity in aspartate transcarbamoylase. Proc Natl Acad Sci U S A. 2005;102:8881–8886. doi: 10.1073/pnas.0503742102. [DOI] [PMC free article] [PubMed] [Google Scholar]
- 22.Brunger AT, Adams PD, Clore GM, Delano WL, Gros P, Grosse-Kunstleve RW, Jiang JS, Kuszewski J, Nilges M, Pannu NS, Read RJ, Rice LM, Simonson T, Warren GL. Crystallography & NMR system: A new software suite for macromolecular structure determination. Acta Crystallogr D Biol Crystallogr. 1998;54:905–921. doi: 10.1107/s0907444998003254. [DOI] [PubMed] [Google Scholar]
- 23.Sakash JB, Chan RS, Tsuruta H, Kantrowitz ER. Three of the six possible intersubunit stabilizing interactions involving Glu239 are sufficient for restoration of the homotropic and heterotropic properties of Escherichia coli aspartate transcarbamoylase. J. Biol. Chem. 2000;275:752–758. doi: 10.1074/jbc.275.2.752. [DOI] [PubMed] [Google Scholar]
- 24.Wang J, Xie J, Schultz PG. A genetically encoded fluorescent amino acid. J Am Chem Soc. 2006;128:8738–8739. doi: 10.1021/ja062666k. [DOI] [PubMed] [Google Scholar]
- 25.Miller JH. Experiments in Molecular Genetics. Cold Spring Harbor Laboratory; NY, Cold Spring Harbor: 1972. [Google Scholar]
- 26.Laemmli UK. Cleavage of structural proteins during the assembly of the head of bacteriophage T4. Nature. 1970;227:680–685. doi: 10.1038/227680a0. [DOI] [PubMed] [Google Scholar]
- 27.Davis BJ. Disc electrophoresis-II Method and application to human serum proteins. Ann. N.Y. Acad. Sci. 1964;121:680–685. doi: 10.1111/j.1749-6632.1964.tb14213.x. [DOI] [PubMed] [Google Scholar]
- 28.Ornstein L. Disc electrophoresis-I. Background and theory. Ann. N.Y. Acad. Sci. 1964;121:321–349. doi: 10.1111/j.1749-6632.1964.tb14207.x. [DOI] [PubMed] [Google Scholar]
- 29.Pastra-Landis SC, Foote J, Kantrowitz ER. An improved colorimetric assay for aspartate and ornithine transcarbamylases. Anal. Biochem. 1981;118:358–363. doi: 10.1016/0003-2697(81)90594-7. [DOI] [PubMed] [Google Scholar]
- 30.Silver RS, Daigneault JP, Teague PD, Kantrowitz ER. Analysis of two purified mutants of Escherichia coli aspartate transcarbamylase with single amino acid substitutions. J. Mol. Biol. 1983;168:729–745. doi: 10.1016/s0022-2836(83)80072-2. [DOI] [PubMed] [Google Scholar]
- 31.Pastra-Landis SC, Evans DR, Lipscomb WN. The Effect of pH on the Cooperative Behavior of Aspartate Transcarbamylase from Escherichia coli. J. Biol. Chem. 1978;253:4624–4630. [PubMed] [Google Scholar]
Associated Data
This section collects any data citations, data availability statements, or supplementary materials included in this article.


