Abstract
Major pathways in the antibacterial activity and eukaryotic toxicity of nano-silver involve the silver cation and its soluble complexes, which are well established thiol toxicants. Through these pathways, nano-silver behaves in analogy to a drug delivery system, in which the particle contains a concentrated inventory of an active species, the ion, which is transported to and released near biological target sites. Although the importance of silver ion in the biological response to nano-silver is widely recognized, the drug delivery paradigm has not been well developed for this system, and there is significant potential to improve nano-silver technologies through controlled release formulations. This article applies elements of the drug delivery paradigm to nano-silver dissolution and presents a systematic study of chemical concepts for controlled release. After presenting thermodynamic calculations of silver species partitioning in biological media, the rates of oxidative silver dissolution are measured for nanoparticles and macroscopic foils and used to derive unified area-based release kinetics. A variety of competing chemical approaches are demonstrated for controlling the ion release rate over four orders of magnitude. Release can be systematically slowed by thiol and citrate ligand binding, formation of sulfidic coatings, or the scavenging of peroxy-intermediates. Release can be accelerated by pre-oxidation or particle size reduction, while polymer coatings with complexation sites alter the release profile by storing and release inventories of surface-bound silver. Finally, the ability to tune biological activity is demonstrated through bacterial inhibition zone assay carried out on selected formulations of controlled release nano-silver.
Keywords: nano-silver, antimicrobial activity, biological partitioning, drug delivery, controlled release
Nano-silver (nAg) is being manufactured in large quantities and incorporated into consumer and medical products as a broad-spectrum antimicrobial agent.1–3 Products containing nano-silver include textiles, food storage containers, antiseptic sprays, catheters, and bandages.2 With large production volume come concerns about potential adverse effects on human health4,5 and the environment,2,6 because many products release silver in the form of nanoparticles, aggregates, or soluble ions during use, washing, abrasion or disposal.2,3 There is significant interest in optimizing the formulations of nAg for both product performance and safety.2,7–9
The biological activity of nano-silver has been attributed to the associated silver cation and its soluble complexes,10,11 with a likely additional contribution from particle surface reactions that generate reactive oxygen species (ROS) or catalyze oxidation of cellular components.4,12,13 Silver ion binds to biological thiol groups in enzymes, such as NADH dehydrogenase, and disrupts the bacterial respiratory chain generating reactive oxygen species (ROS) that can lead to oxidative stress and cell damage.12,14 Nanosilver particles have been reported to generate peroxide intermediates during reactive dissolution, which could oxidize lipids following particle attachment to cell membranes, but there remains some controversy about the importance of these particle-based mechanisms.15–17 In contrast, there is broad agreement that ion release is a major pathway for the biological activity of nano-silver. The function of nAg particles in these ion-based toxicity pathways is: (i) to generate a sustained flux of Ag+ ions from an inventory of nAg particles bound on substrates or imbedded matrices, or (ii) to transport active Ag+ to sensitive biological targets on cell membranes or within cells following particle attachment or endocytosis respectively. Recent studies have shown that the majority of silver ion comes from oxidation of the zero-valent metallic particle, typically by reaction with dissolved O2 and mediated by protons and other components in the surrounding fluid phase.16,17
In ionic delivery pathways, nano-silver acts in an analogous fashion to a drug delivery system, in which the nanoparticle contains a concentrated inventory of an active species, here the ion, which is transported to and released at or near biological target sites. Although the importance of silver cation in the biological response to nano-silver is widely recognized, the drug delivery paradigm has not been well developed for this system, and there is significant potential to improve nano-silver technologies through controlled release formulations. The specific benefits of controlled release nano-silver formulations include:
dose control to achieve desired bactericidal or bacteriostatic effects;
dose limitation to avoid eukaryotic toxicity that can, for example, slow wound healing in bandage applications;7
control of product lifetime, before dissolution and diffusion end antibacterial activity;
minimization of environmental release through excess ion production beyond that necessary for product performance;2, 3
optimization of release profile for targeted delivery to specific tissue or intracellular targets.7,10
Nanostructured silver shows tremendous variability in size, shape, and surface chemistry (e.g. Fig. 1), and it is likely that this variability can be exploited to tune the biological activity and applied dose of nano-silver products. There are published studies on release from silver-polymer composites,18–22 but no fundamental systematic studies of controlled release chemistry for colloidal nano-silver surfaces. The present article therefore applies elements of the drug delivery paradigm to nano-silver dissolution, and presents a systematic study of competing chemical concepts for controlled release. Because the major ion source is oxidation, we hypothesize that ion release can be controlled through manipulation of the oxidation pathways, involving surface area (size), ligand binding, polymeric coatings, sulfidic films, scavenging of peroxy-intermediates, and pre-oxidation treatments. After presenting thermodynamic calculations of silver species partitioning in biological media, the article examines and evaluates each of these competing chemical approaches for achieving controlled release nano-silver.
Figure 1.
Examples of silver nano- and micro-structures of varying size and shape. (A) equi-axed particles physically deposited on titanium surface following colloidal synthesis, (B) Silver flakes nucleated on active sites along mechanically scratched Ti surface, (C) Higher magnification of silver flake cluster.
RESULTS AND DISCUSSION
Silver Partitioning in Biological Media
Before developing nAg formulations for controlled ion release, it will be useful to consider the environment into which this release occurs and the subsequent speciation and partitioning of soluble silver in biological media. A previous publication discussed the equilibrium partitioning of nano-silver in environmental media,17 where ultralow concentrations typically favor complete solubility as Ag+, AgCl(aq) or AgClx1-x(aq) following irreversible oxidation of metallic Ag to Ag(I). Speciation in biological systems is complicated by the possibility of higher silver concentrations and the presence of biological thiols and chloride. In general, silver speciation is governed by the media composition and the coordination chemistry of silver complexes. Silver binds to anionic ligands that include Cl−, inorganic sulfide (S2−), and organosulfur compounds (thiols -SH), and this binding can drive free silver ion (Ag+) to very low concentrations.2 Chloride is reported to dramatically reduce AgNO3 toxicity by precipitation and complexation,23 and silver-thiol complex formation24 has been reported to inactivate AgNO3 antimicrobial activity.
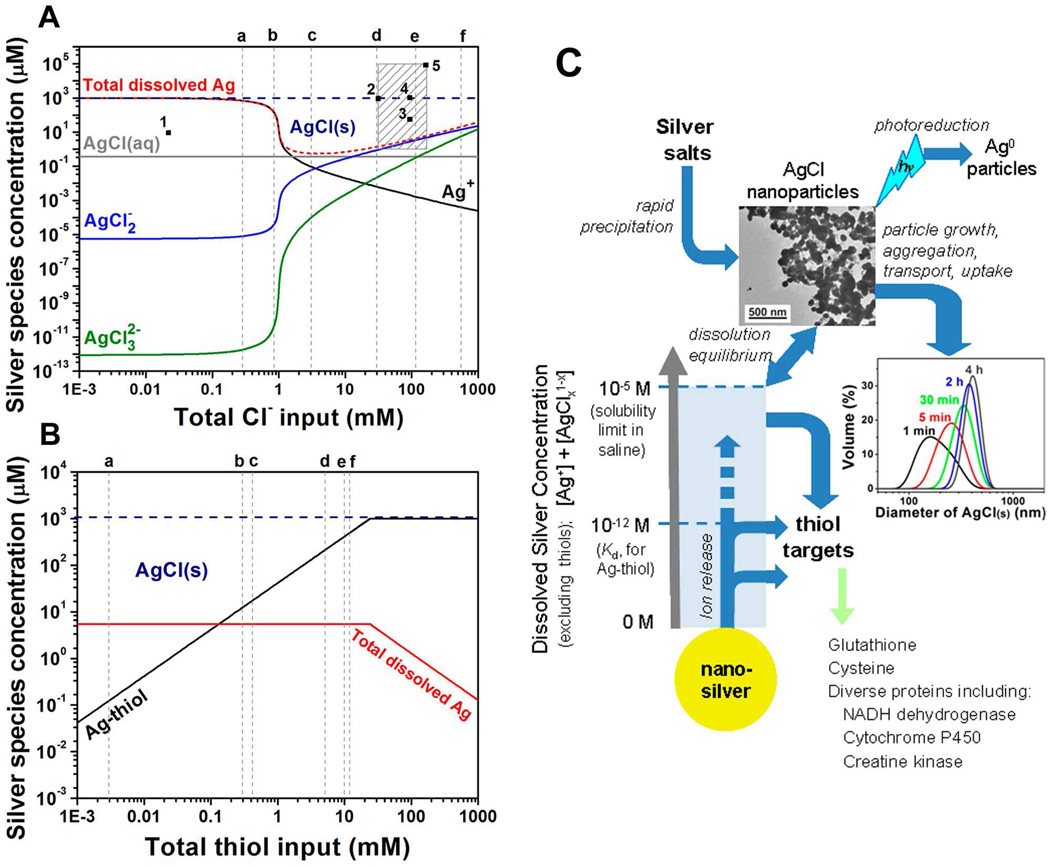
Here, we performed equilibrium speciation calculations in biological media using visual MINTEQ (version 3.0) augmented with thermodynamic parameters for silver-thiol interaction (Fig. 2). In simple NaCl solutions, free silver ion (Ag+) is the dominant soluble silver species at low Cl− (Fig. 2A), but drops rapidly with increasing chloride. Further increase of Cl− causes AgClx1-x to rise, which enhances total dissolved silver (Agdis). Many experimental studies of silver in biological systems are seen to take place in the supersaturated region (Fig. 2A), where the majority of silver precipitates as AgCl(s). Indeed we observe precipitation upon addition of silver salts to cell culture medium and saline solution to form AgCl nanoparticles, which aggregate over time (Fig. 2C).
Figure 2.
Equilibrium speciation and chemical pathways of silver in biological media. (A) Silver speciation as a function of total input chloride concentration with total input silver fixed at 1 mM. The red dashed curve gives total dissolved silver (Agdis), which passes through a minimum at 3 mM Cl−. Gray dashed lines give typical chloride concentrations in environmental and biological scenarios: (a) groundwater;27 (b) surface freshwater;28 (c) mitochondria;29 (d) cytoplasm;29 (e) extracellular spaces; and (f) seawater. The shaded square gives typical total silver and chloride concentrations used in example biological studies on: (1) nitrifying bacteria;30 (2) E. coli;16 (3) primary human skin fibroblasts;31 (4) keratinocytes;32 (5) methicillin-resistant Staphylococcus aureus.33 It is clear that many biological studies take place in a supersaturated region where the primary equilibrium species is AgCl as a solid precipitate. (B) Silver speciation in thiol-containing saline at pH 7.4 and 1 mM total silver. The red Agdis curve represents all soluble silver species other than silver-thiol complexes. The gray dashed lines gives typical thiol concentrations in biological systems: (a) total glutathione in human blood plasma;34 (b) extracellular total thiol;35 (c) total glutathione in epithelial lining fluid in human lungs;34 (d) physiological cysteine in Gram-positive bacteria;36 (e) glutathione in lung epithelial cells;37 (f) intracellular total thiol.35 Silver thiol binding is very favorable, and above 0.2 mM thiol, the soluble silver fraction is dominated by Ag-thiol complexes.38 (C) Chemical pathways for nano-silver vs. conventional silver salts in biological systems based on calculations in A and B. Light blue shaded area represents biologically active, soluble Ag+ and AgClx1-x complexes. Silver salt addition to media (top) causes rapid precipitation of AgCl nanoparticles, which is a complicating factor in the interpretation of silver salt toxicity data. Nanoparticle precipitation will be followed by dynamic aggregation, settling, and cellular uptake, or even photoreductive processes that have not been properly defined or studied, but mediate the cellular response to silver salts. In contrast, metallic nanosilver addition (bottom) causes gradual ion release. The high affinity binding of Ag to thiols (Ka ~ 1012, or Kd ~ 10−12) causes direct thiol transfer at concentrations below the AgCl precipitation threshold. Thiol targets can be sufficiently abundant (typical intracellular total thiol concentration is 12 mM) to receive all of this silver, and thus avoid AgCl precipitation. The TEM shows AgCl nanoparticles that result from mixing equal amounts of 0.2 mM AgNO3 and NaCl solutions. Particle size distribution data is obtained by dynamic light scattering following adding of AgNO3 into saline (silver 0.1 mM).
Thiols in living systems play a key role in antioxidant defenses, protein synthesis and structure, redox-sensitive signal transduction, xenobiotic metabolism, and immune regulation. Thiol-containing proteins have been reported to be the major targets for silver ion toxicity.2,25 Figure 2B shows the effect of thiols on Ag(I) partitioning in saline. The gray dashed lines represent typical physiological thiol concentrations, and most of these concentrations fall in a range where Ag-thiol complexes dominate the soluble silver fraction due to the high-affinity of thiols for Ag+ (log Kf = 11.9 for cysteine as an example).26 The grey dashed lines also show that thiol concentrations are often equal to or higher than total Ag doses, so silver-thiol complexes become major sinks that drive equilibrium Ag biopartitioning.
Based on the calculations in Fig. 2A and 2B, we propose Fig. 2C as a representation of the main chemical pathways for nano-silver and conventional silver salts in in vitro biological studies (see caption).
Controlled Release Approaches: Particle Size
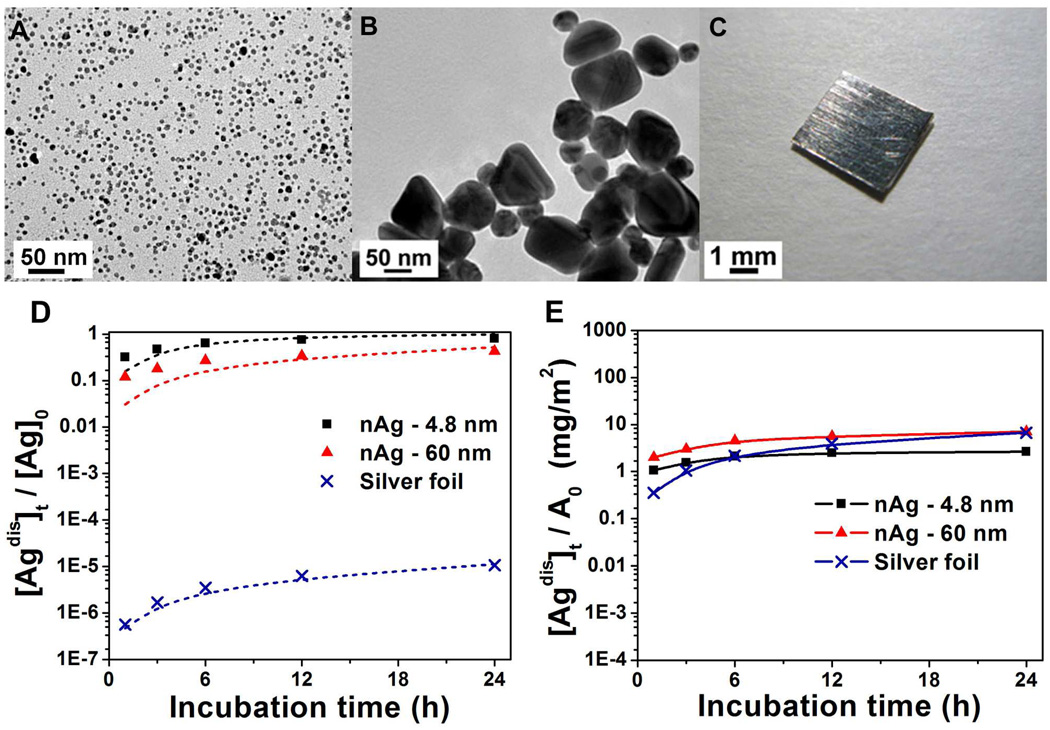
The release of soluble silver from nAg surfaces is primarily a heterogeneous oxidation reaction involving the cooperative effects of dissolved oxygen and protons.17 This suggests surface area dependence and the potential to control release through particle size control. The limiting case of large particle size is a macroscopic silver body, and there is interest in how ion release from such surfaces compares to ion release from nAg reported on an equal area basis. Figure 3 shows soluble silver release from two nAg samples of different size (4.8 and 60 nm) and a macroscopic silver foil sample. Both nAg preparations use citrate anion stabilization at 3/1 citrate/Ag+ molar ratio to approximate materials with similar surface chemistry but different surface area. The data show a mass-specific release rate ranking of 4.8 nm > 60 nm ≫ foil, as expected, with first-order rate constants k, from − (dm/dt) = k · m, as 4.1 day−1 for 4.8 nm nAg, 0.74 day−1 for 60 nm nAg, and 1.1×10⁻⁵ day−1 for silver foil. Surface area re-normalization collapses the data from five orders of magnitude variation to less than one, demonstrating the dominant effect of area. Interestingly, this implies a typical surface recession rate of about 2 nm/day for all three silver solids under these conditions, which for macroscopic surfaces extrapolates to about 0.7 µm/yr, a rate that would preserve the size and shape integrity of macroscopic silver bodies over their lifetime while provide a continuous source of antibacterial ions to adjacent fluid phases.
Figure 3.
Effect of particle size on silver release rates. (A) Typical TEM image of nAg-4.8 nm synthesized by reduction of AgClO4 with NaBH4 in presence of trisodium citrate, showing mono-dispersed spherical silver nanoparticles with an average diameter of 4.8±1.6 nm. (B) Typical TEM image of nAg-60 nm synthesized by reducing AgNO3 with trisodium citrate while boiling, showing pseudospherical and truncated triangular nanoparticles in a size range of 40~80 nm. (C) Image of a macroscopic square silver foil (4 mm × 4 mm × 0.127 mm). (D) Time-resolved mass-based soluble silver release measurements in air-saturated acetate buffer (pH 4). Initial concentrations of nAg-4.8 nm and nAg-60 nm are 0.05 mg/L, while initial concentration of silver foil is 10,700 mg/L (a 4 mm×4 mm×0.127 mm piece in 2 mL buffer). The release can be described by first order kinetics: − (dm/dt) = k · m, shown by dashed lines. (E) Surface area-based soluble silver release renormalized from (D).
Controlled Release Approaches: Surface Modification
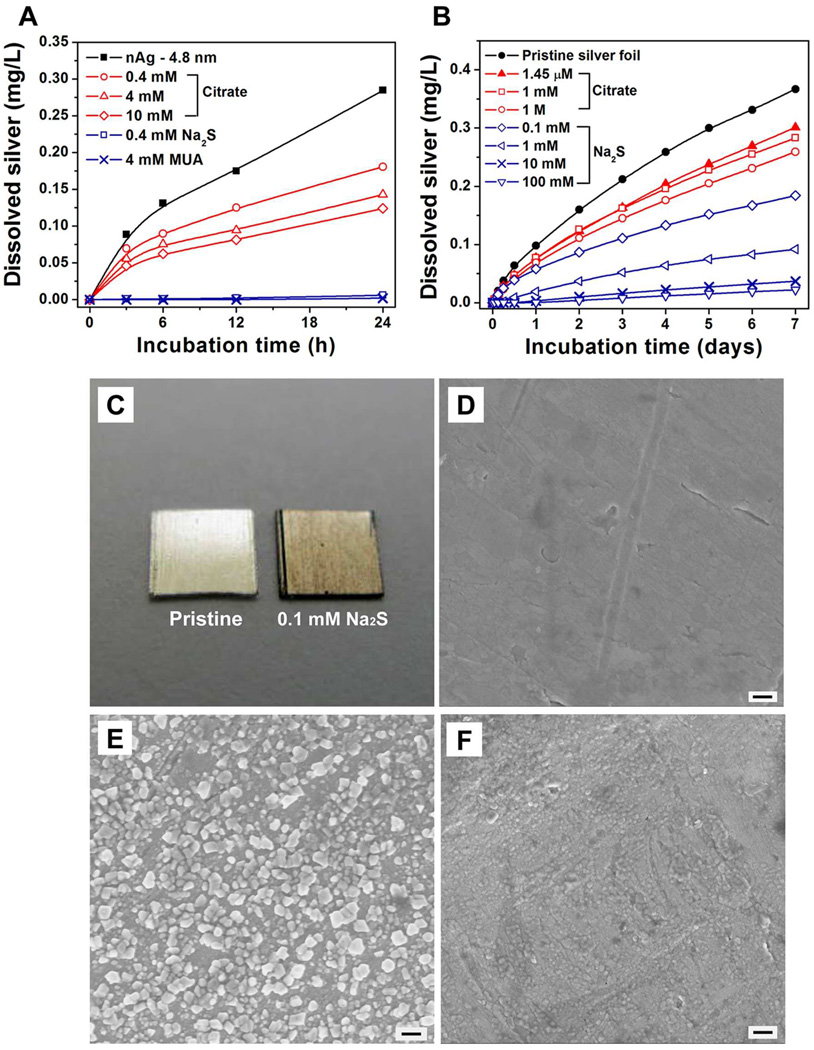
A second class of techniques uses surface modification to either inhibit or accelerate release. Figure 4A gives time-resolved soluble silver release from nAg-4.8 nm post-functionalized by addition of citrate anions, Na2S or 11-mercaptoundecanoic acid (MUA). In all cases, Ag+ release is inhibited, and some treatments with Na2S and MUA reduce release rates to undetectable values. Ion release is initiated by oxygen chemisorptions accompanied by electron transfer,39 and the citrate effect is likely due to occupation of these initial chemisorptions sites. Although the original nAg-4.8 nm particles are stabilized by citrate, two wash cycles in the original synthesis leave only tightly bound citrate anions on the surface, and post-functionalizing with additional citrate (10 mM) changes the ζ-potential from −45 mV to −48 mV suggesting additional surface coverage.
Figure 4.
Ion release control through surface modification. (A) Time-resolved silver ion release from modified nAg-4.8 nm suspensions. Purified nAg stock solution (40 mg/L) were treated with citrate, MUA or sodium sulfide and diluted to 2 mg/L for release kinetic measurements in air-saturated pH 5.6 acetate buffer in the dark at room temperature. (B) Cumulative silver ion release from modified silver foils. Release experiments were carried out in air-saturated pH 4 acetate buffer in the dark at room temperature (initial silver concentration: 10,700 mg/L). (C) Optical image of pristine and 0.1 mM Na2S-treated silver foil, showing scale formation. (D–F) SEM images of silver foil that is (D) pristine, (E) 0.1 mM Na2S modified, and (F) 100 mM Na2S modified. Scale bars are 200 nm.
A second inhibition mechanism is reversible surface binding of Ag+, which reduces the apparent release rate in the early stages as a surface inventory of silver is being accumulated. Munro et al40 reported orientation of citrate ion at nAg colloid surface that one terminal and the tertiary carboxylate groups of citrate complex to silver surface while the second terminal carboxylate remains unbound and available for Ag+ complexation. Geometric calculations show that about 190 citrate ions can be bound on each nAg-4.8 nm particle by assuming that the particle is covered by a monolayer of close-packed citrate ions, each ion occupying an area of 0.38 sq-nm.41 In a 2 mg/L nAg suspension, this corresponds to 0.1 mg/L maximum Ag adsorbed, or 5% of the total silver, which is a significant sink for silver ion. We believe the alkylthiol, MUA, inhibits by similar mechanisms, but is more effective due to higher affinity for silver surfaces and lower exchange rates42,43 that open transient active sites for oxygen attack. In the case of Na2S, there is evidence that the mechanism is sulfide film formation. As a soft metal, silver has high affinity to sulfur and can be readily sulfurized by Na2S44 to form Ag2S, which is highly insoluble in water (Ksp=5.92×10−51) protective of the underlying silver surface.
Confirmation of these mechanisms comes from experiments on well-defined silver foils. Treatment of the foil surfaces with citrate and Na2S both inhibit ion release (Fig. 4B). Note that 1.45 µM trisodium citrate treatment gives the same citrate/surface area ratio as in the synthesis of nAg-4.8 nm, allowing meaningful comparison. As with the nano-particles, sulfidation can completely suppress ion release from the foil surfaces. Figure 4C shows a dark scale after sulfidation and a distinctive surface morphology changes were observed by SEM (Figure 4D–F). The smooth surface on the pristine foil was transformed to irregular nodules and then to a continuous film as the Na2S concentration was increased in steps.
Many nAg formulations use macromolecular coatings such as dextran,45 starch,12 gum arabic,46 or synthetic polymers,47 which can block oxygen access.48 We observe here that polyacrylamide, polyacrylic acid and gum Arabic coatings serve as sinks for Ag+ in solution through complexation, and the bound Ag+ undergoes reversible adsorption-desorption influenced by Ag+ concentration and Na+ as a competing cation (Supporting Information Figure S1). These O- and N-containing polymer coatings can both delay and extend ion release by accumulating and releasing inventories of bound Ag+.
Controlled Release Approaches: Oxidant Availability
The nanoparticle-to-ion transformation is necessarily an oxidative process, so methods that enhance or disrupt oxidation pathways are a promising route to controlled release. There is evidence12,17,20 for a global reaction pathway of:
| (Eq. 1) |
which gives multiple entry points for intervention to inhibit or accelerate release. Release can be inhibited by scavenging reactive oxygen intermediates from the surrounding medium using antioxidant enzymes SOD or catalase (Supporting Information Figure S2), or by natural organic matter (NOM) in the environment.17,49 Release can be promoted by methods to pre-establish the chemisorbed oxygen complex, especially since the first step in this pathway is believed to be rate limiting.17
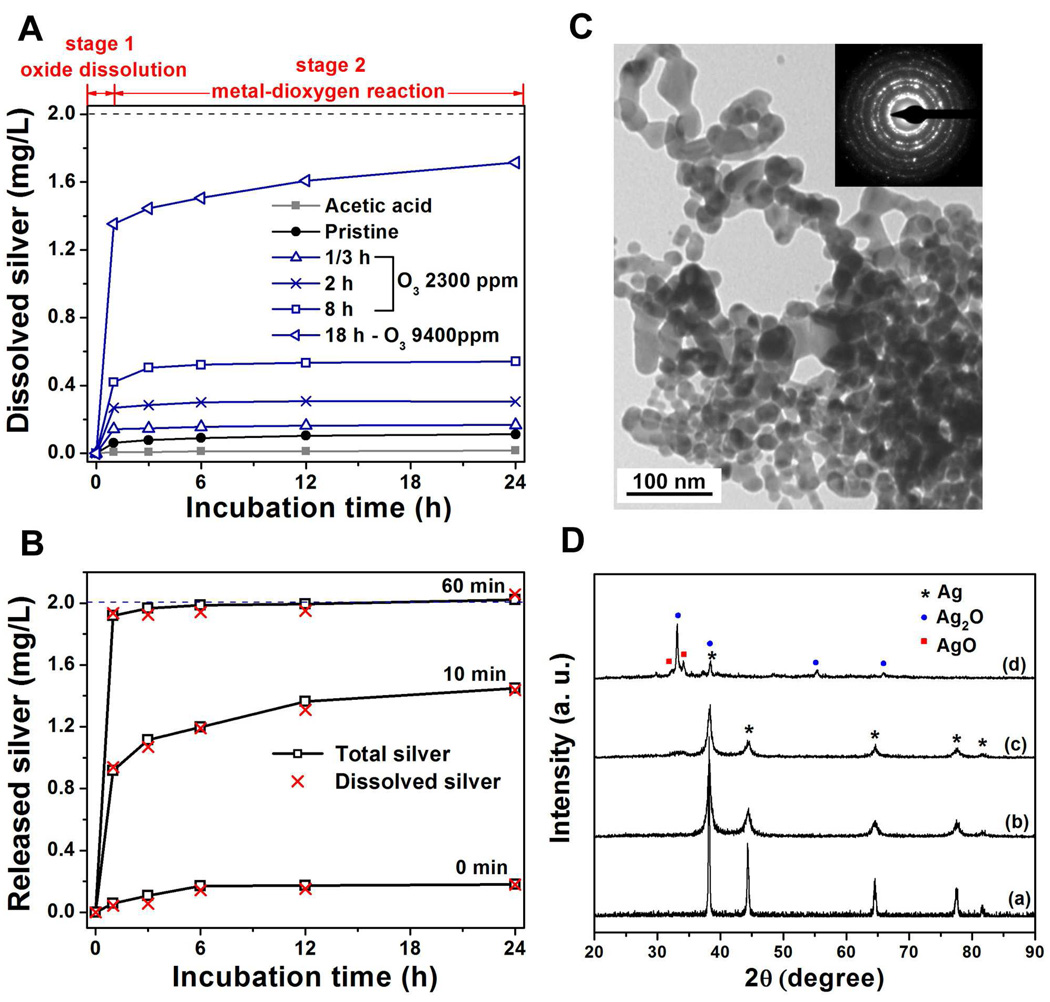
Figure 5 shows the effect of nAg pre-oxidation with dry ozone on the subsequent release of soluble silver from nAg surfaces. Ozone treatment greatly enhances ion release in a manner that can be tuned by varying the ozone contact conditions (Fig. 5A and 5B). Interestingly, ozone pre-oxidation gives a distinct two-stage (fast/slow) release behavior, which we interpret as rapid oxide dissolution followed by slow reaction between the remaining metal and dissolved dioxygen. The amount of silver release in these two distinct phases can be selected by adjusting ozone exposure conditions (Fig. 5A and 5B). The structural changes of nAg powders after acid wash and O3 treatment were detected by X-ray diffraction (XRD) analysis, as shown in figure 5D. After O3 oxidation, the FCC metallic silver peaks decrease while new peaks gradually appear corresponding to silver oxides – Ag2O and AgO.
Figure 5.
Programmable two-stage ion release profiles following dry ozone treatment of nano-silver. (A) Time-resolved silver ion release from O3 oxidized nAg powder. Experiments were carried out in air-saturated pH 5.6 acetate buffer in the dark at room temperature (initial nAg suspension: 2 mg/L, as shown by the dash line). (B) Ion release measurements from nAg-4.8 nm impregnated glass microfiber filter papers pre-oxidized with O3 (2300 ppm, 1 L/min) for 0, 10 and 60 min. Experiments were carried out in air-saturated pH 5.6 acetate buffer in the dark at room temperature. Open squares represent the total silver (nAg particles and soluble forms) leaching from substrates, while the red crosses give only dissolved silver concentration (initial nAg concentration: 2 mg/L, as shown by the dash line). (C) TEM image and selected area diffraction pattern of nAg powder, showing nAg are polycrystalline with diameter of 20~40 nm. (D) X-ray diffraction spectrum of nAg powders that is (a) acetic acid washed (to remove any existing oxide); (b) pristine; (c) pre-oxidized (2300 ppm O3, 1 L/min, 8 hours) and (d) preoxidized (9400 ppm O3, 1 L/min, 18 hours), showing the peaks of silver decrease while the peaks of Ag2O and AgO increase after O3 treatment. All data for nAg powder samples from QuantumSphere® (CA, USA).
Controlled Release Approaches: Media Composition
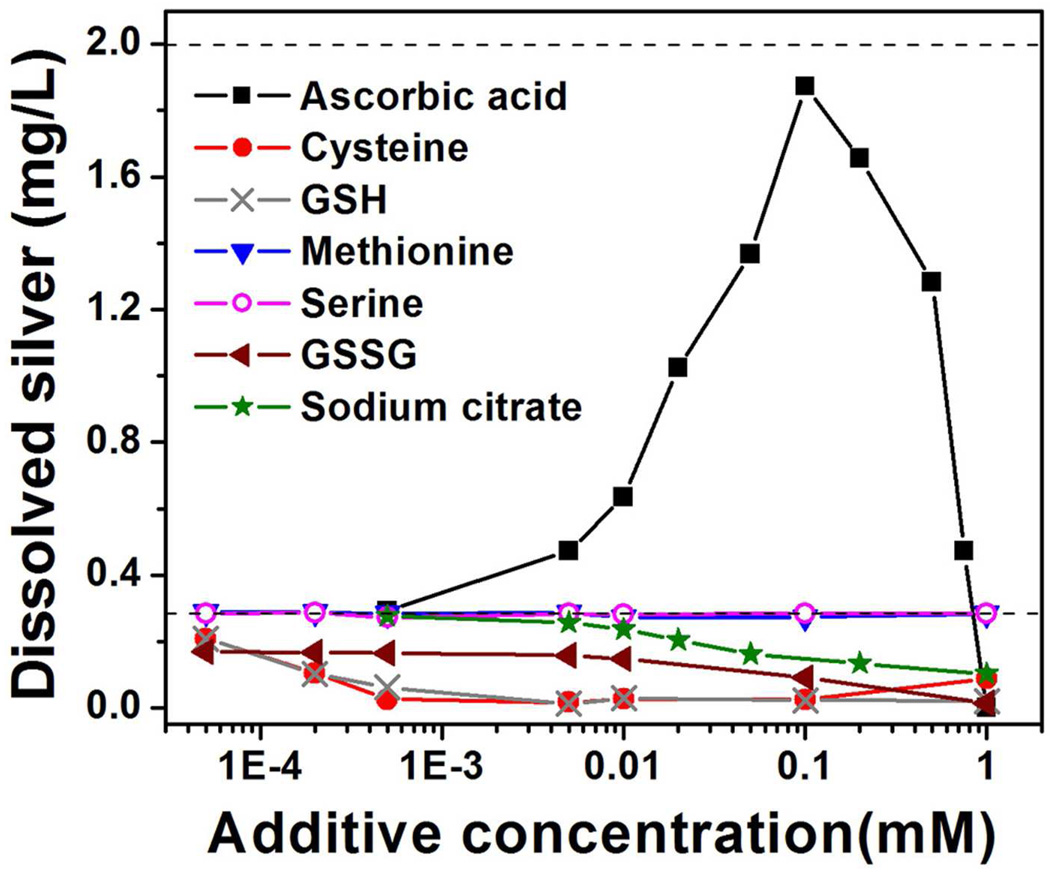
It is anticipated the fluid composition in the immediate vicinity of nAg particle surfaces will provide additional degrees of freedom for tailoring ion release rates in biological media. Figure 6 shows the effects of biological reductants and sulfur-containing biomolecules on silver ion release under standardized conditions. Compounds with free thiols (glutathione, cysteine) along with sodium citrate inhibit ion release presumably by surface binding and oxygen exclusion from active sites. The behavior of citrate is not a reduction of Ag+, because equal concentration of citrate added to Ag+ solutions had no effect. Serine and methionine had no measureable effect, while oxidized glutathione (GSSG) was intermediate. These trends are consistent with known binding affinities of silver. The strongest silver binding is with free thiol compounds, cysteine and glutathione (formation constants log Kf of 11.9 and 12.3, respectively).26 The disulfide compound GSSG can bind to nAg surfaces with the -S-S- bond cleavage and may therefore have a similar binding strength as glutathione. Methionine, with sulfur bonded to two methyl groups has a log Kf of 6.45 and serine with no sulfur has a log Kf of 3.7.50 We also found the addition of 5 µM cysteine or GSH to AgClO4 solution drives free silver ion to very low values, so re-reduction of silver ion back to Ag0 may be also contribute to the overall apparent release.
Figure 6.
Control of silver ion release by manipulation of media composition. One day release data are gathered after incubation of nAg-4.8 nm in air-saturated modified acetate buffer media (pH 5.6) in the dark at room temperature for one day (initial nAg 2 mg/L). Upper dashed line represents the total silver concentration (2 mg/L), and the lower dashed line gives a typical 1-day silver ion release in acetate buffer (0.28 mg/L) with no additive.
Ascorbic acid behaves in a surprising manner, greatly increasing silver ion release at low concentration, while completely inhibiting release above 1 mM. This behavior is not currently understood, but may be related to reactive oxygen species produced by metal-catalyzed ascorbate autoxidation51 or ascorbate chelation of silver ions that aid in its mobilization.
Demonstration of Controlled Release Nanosilver: Tuning Microbial Inhibition
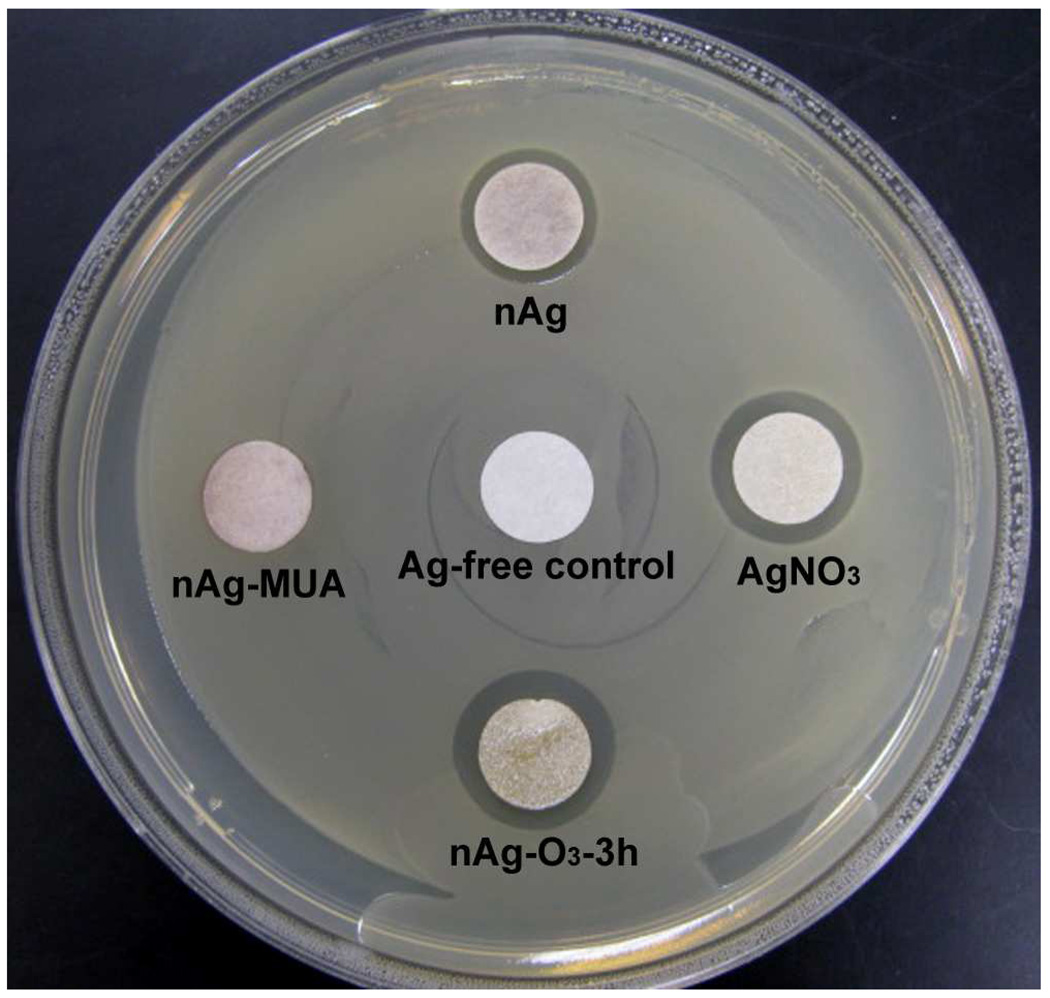
A central premise of this work was that the biological activity of nano-silver could be tuned by controlling the extent and timing of ion release. Having controlled release formulations we can test this premise by selecting representative samples (nAg-O3 for fast release, nAg-MUA for slow release) and applying a Kirby-Bauer bacterial zone inhibition assay. Figure 7 shows the response of E. coli to silver-doped filter papers, around which a clear zone of inhibition is observed whose size decreases in order: AgNO3 ≈ nAg-O3 > nAg ≫ nAg-MUA ≈ negative control. The inhibition zone size falls in strict rank order with the initial release rates (Fig. 4 and Fig. 5) confirming the biological relevance of these new formulations.
Figure 7.
Optical image of the results about the Kirby-Bauer antimicrobial susceptibility test applied to controlled-release nAg formulations (nAg-O3 for fast release; nAg-MUA for slow release) and controls. Silver-impregnated filter papers were placed on top of the E. coli inoculated agar plate and the image was taken after 18 hours incubation at 37 °C. Filter paper diameter is 10 mm.
SUMMARY
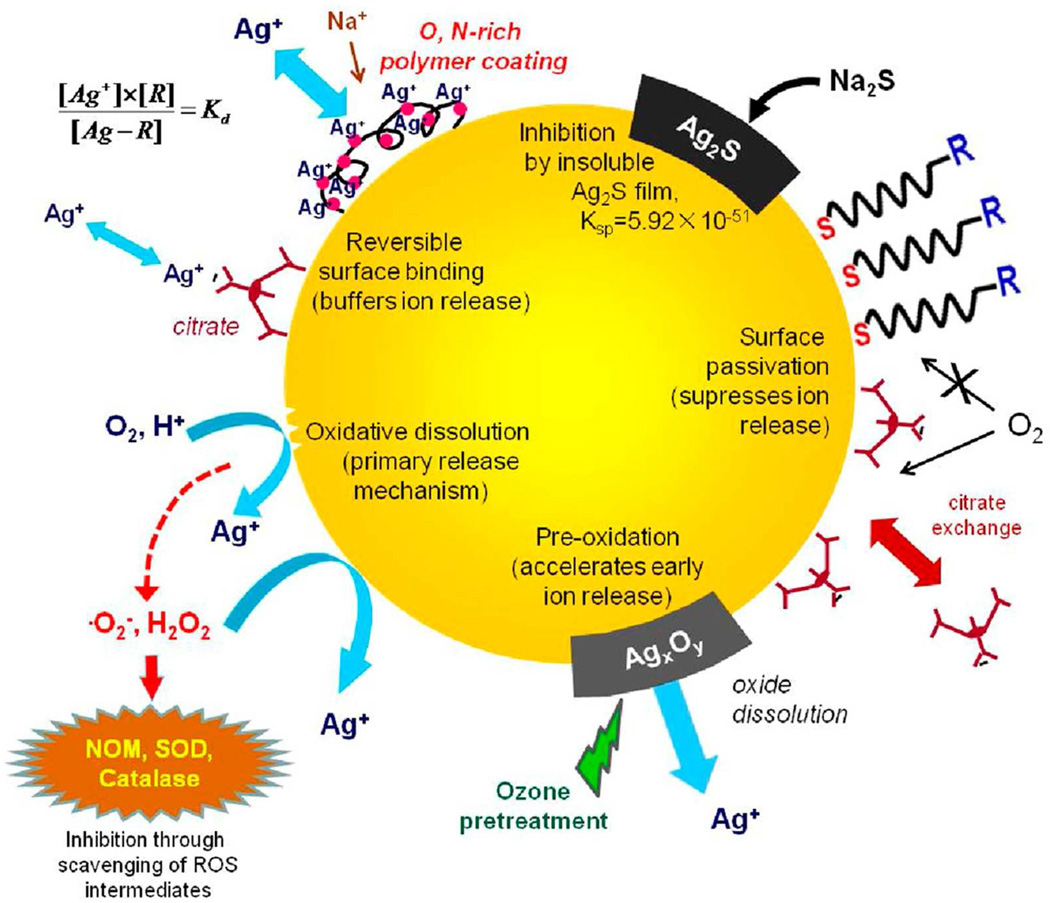
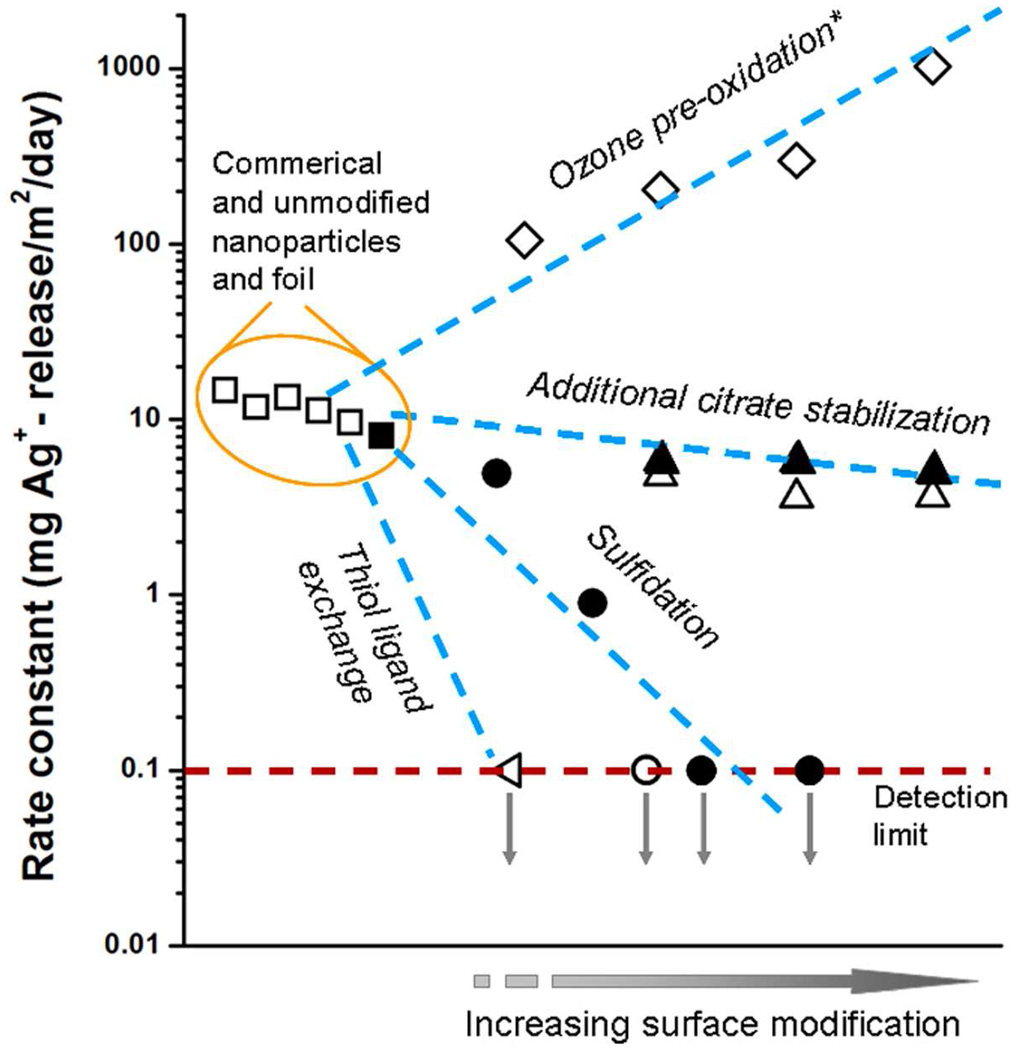
Figure 8 summarizes the various chemical approaches presented here for controlling the release of soluble, biologically active silver from nano-silver surfaces. The most effective approaches are surface modification techniques involving preoxidation, sulfidation, and thiol ligand exchange. The quantitative effects of these treatments on surface-normalized rate constants are summarized in Figure 9, using as references samples citrate-stabilized nAg and commercial nAg samples, some of which are supplied with coatings. Release rate constants are quite similar for the citrate base materials and the commercial materials, but can be varied over four orders of magnitude by the surface modification methods described here. Together these methods constitute a flexible tool kit for optimizing nano-silver formulations for the performance targets of a variety of medical and consumer antimicrobial applications.
Figure 8.
Pictorial summary of chemical approaches to control the release of biologically active silver from nano-silver surfaces.
Figure 9.
Unified comparison of ion release rate constants for a wide variety of modified nanoscale and macroscopic silver surfaces in this study. Open symbols: nanoparticles; solid symbols: foils. Release experiments in pH 4 acetate buffer (5 mM) at room temperature in dark (initial silver concentration for nAg samples is 0.05 mg/L and for silver foil samples is 10,700 mg/L). The unmodified silver samples from left to right are gum Arabic stabilized nAg (Strem Chemicals), gelatin stabilized nAg (Strem Chemicals), nAg-60 nm, nAg powder (QuantumSphere), nAg-4.8 nm, and silver foil (Strem Chemicals). Ion release rate can be described by − (dm/dt)t=0 = k ·A, integrated 0–12 h release data are used for rate constant calculation. Release rate constants can be varied over four orders of magnitude by the methods described here, especially ligand exchange, sulfide coating, and preoxidation. Asterisk indicates initial (1 hr) ion release rates because of the two-stage release behavior.
MATERIALS AND METHODS
The reagents used for nano-silver synthesis and modification were purchased from Sigma-Aldrich. The DI water (Millipore, 18.3 MΩ·cm) was used to prepare solutions.
Calculation of Equilibrium Silver Speciation
Silver speciation in biological media was calculated using visual MINTEQ (version 3.0) from Gustafsson.52 Because MINTEQ 3.0 does not include organothiol compounds, cysteine was adopted as a model thiol species and the code augmented with the silver-cysteine formation constant (log Kf = 11.9)26 and cysteine pKa values (1.71 for -COOH, 10.78 for -NH2 and 8.33 for –SH).53
Commercial Silver Samples
Silver foil (99.9% Ag, 50 mm×50 mm×0.127 mm), gum Arabic stabilized nAg (average diameter 5–10 nm) and gelatin stabilized nAg (average diameter 5–10 nm) were purchased from Strem Chemicals (MA, USA). Silver nanopowder (average diameter 20–40 nm), manufactured by vapor condensation process, was purchases from QuantumSphere® (CA, USA).
Synthesis and Characterization of nAg Stock Suspensions
(1) nAg-4.8 nm. The detailed procedure for synthesizing citrate stabilized nAg-4.8 nm stock solution (40 mg/l) was described previously.17 (2) nAg-60 nm was prepared according to the method reported by Lee and Meisel54 with modification. A 5 mL of 1 mM AgNO3 solution was brought to boiling, followed by addition of 0.45 mL 1% trisodium citrate solution. Boiling was continued for another 30 min, while pale yellow color gradually appeared reflecting the formation of nano-silver. The turbid brownish grey suspension was first filtered through a 0.2 µm syringe filter (Nalgene®) and then washed by centrifugal ultrafiltration (Amicon Ultra-4 3K, Millipore, MA) with DI water addition in two cycles to remove any soluble chemical residues. The silver concentration was determined to be 105 mg/L by atomic absorption spectroscopy. nAg stock suspensions were stored in the dark at 4 °C for later use.
The morphology and size of nAg were determined by transmission electron mictroscopy (TEM) on a Philips CM20 at 200 kV. Surface morphologies of silver foil samples were characterized on a LEO 1530 field-emission scanning electon microscope (FE-SEM) under low acceleration voltage (3–5 kV). Size distribution and ζ-potential of nAg were evaluated by dynamic light scattering methods, using a Zetasizer Nano ZS system (Malvern Instruments). The UV-vis spectra were obtained using a Shimadze UV-1700 PharmaSpec, and the X-ray powder diffraction patterns of samples were recorded on a Bruker AXS D8-Advanced diffreactometer with Cu Kα radiation (λ=1.5418 Å). Sulfur concentrations in modified nAg suspensions were analyzed by inductively coupled plasma emission spectrometer (ICP-ES) on Jobin Yvon Emission JY2000, and the silver concentrations were quantified by graphite furnace atomic absorption (AA) spectrometry (Perkin Elmer AAnalyst 600 GFAAs).
Surface Modification of nAg-4.8 nm and Silver Foil
Freshly prepared nAg suspensions (40 mg/L, 4 mL) were mixed with trisodium citrate to citrate concentration at 0.4 mM, 4 mM and 10 mM, the mixture solutions were incubated at 4 °C for 24 hours to allow the complexation of citrate ions at nAg surface. The unbound citrates were removed by centrifugal ultrafiltration (Amicon Ultra-4 3K), then nAg particles were re-dispersed in DI water at 40 mg/L. The surface charge as indicated by ζ-potential decreased from −45 mV to −48 mV for 10 mM citrate modified nAg, reflecting increasing surface coverage by citrate modification.
The sulfidation of nAg was achieved by incubating nAg (40 mg/L) with 0.4 mM Na2S solution for 30 min, followed by removal of excess Na2S through centrifugal ultrafiltration and 3 cycles of DI water wash. The final nAg concentration was brought to 40 mg/L. Free sulfur concentration measured by ICP was less than 0.002 mM after purification.
Ligand-exchange was used to modify nAg with 11-mercapto-undecanoic acid (MUA). A 0.3 mL MUA solution (0.4 M) in ethanol was added dropwise into freshly prepared nAg solution (40 mg/L, 30 mL) and stirred in dark at room temperature overnight. Then nAg was harvested, washed with DI water 3 cycles to remove excess thiol, and re-dispersed into water to a concentration of 40 mg/L. Free sulfur in nAg suspensions was less than 0.002 mM after purification. In these nAg surface modification, DLS measurements detected no particle size change.
Silver foil (99.9 % Ag) of 0.127 mm thickness was cut into 4 mm×4 mm pieces. In order to remove possible organic contaminants and oxide layers, the small foil sections were sonicated in acetone and ethanol consecutively, then dipped into 1 % HNO3 for 5 min before use. A 10 mL of trisodium citrate solutions (1.45 uM, 1 mM and 1M) and Na2S solutions (0.1 mM, 1mM, 10 mM and 100 mM) were used to modify silver foils. After incubating in trisodium citrate solution for 24 hours or Na2S solution for 1 hour, the silver foils were rinsed thoroughly with DI water and blotted dry. Upon Na2S treatment, the surface color gradually changed from shiny silver to near black, indicating surface sulfidation. The morphology of the Ag2S surface films was examined by scanning electron microscopy (SEM).
Ozonolysis of nAg
Ozone oxidation was carried out by placing a small glass beaker containing 0.1 g nAg powder (QuantumSphere®) into a quartz chamber, and introducing 1 L/min of 2300 ppm ozone into the chamber using a CD10/AD Corona discharge ozone generator (ClearWater Tech. LLC) fed by compressed air. The in-situ O3 concentration was detected by IN-2000 Locon ozone analyzer. A slight drop in exit O3 concentration was observed after introducing the samples, indicating the consumption of O3 by nAg oxidation. The nAg powder samples were oxidized by O3 at 2300 ppm for 20 min, 2 h and 8 h, respectively, or at 9400 ppm overnight (18 h).
Glass microfiber papers were nAg impregnated by loading 0.4 mL of 500 mg/L (200 µg) nAg-4.8 nm suspension onto the papers (25 mm diameter, glass microfiber, Whatman, type GF/D). After completely drying, a filter paper was placed in a tissue cassette, then inserted into the quartz chamber and oxidized by O3 at 2300 ppm (flow rate 1 L/min) for 10 min or 60 min.
Silver Ion Release Experiments
Ion release from nAg samples was quantified by ultrafiltration/atomic absorption as described previously.17 The method begins by diluting nAg stock suspensions or nAg powders with acetate buffer (5 mM) to a desired starting concentration, and then tracking the appearance of dissolved silver by graphite-furnace atomic absorption (AA) spectroscopy. The detection limit was 0.001 mg/L, and all AA analyses were done in duplicate. In addition, replicates from the full dissolution/separation/analysis procedure were done on selected samples. The dissolved silver phase was isolated by removing nAg particles using Amicon centrifugal ultrafilter devices (Ultra-4 3K, Millipore, cellulose membranes with 1–2 nm pore size), subjected to centrifugation for 25 min at 4000 rpm (Allegra X-15R, Beckman Coulter Inc.). Control experiments in absence of Ag+ ions show very low levels of silver post-filter, demonstrating highly effective removal of even the finest silver nanoparticles, as discussed previously and confirmed by TEM.17 No agglomeration took place during the incubation of nAg in acetate buffer over 1 day as detected by DLS. To investigate silver ion release from silver foil samples, a small foil piece (4 mm×4 mm×0.127 mm) was incubated in 2 mL of pH 4 acetate buffer. At a defined time the immersion liquid was exchanged completely with fresh buffer and soluble silver concentration was determined by graphite-furnace AA analysis. All the above ion release experiments were conducted at room temperature (20 °C) in 15 mL plastic tubes protected from light.
Ion release from microfiber papers was measured by placing papers loading with 200 µg nAg into a tissue cassette and then into 100 mL acetate buffer solution (pH 5.6) under magnetic stirring at 300 rpm. After the desired time interval, aliquots were taken for AA analysis. One aliquot was digested with HNO3 for determination of total released silver (nAg particles and soluble forms), another aliquot was filtered with centrifugal ultrafilter device for isolating the dissolved silver phase. The experiments were conducted at room temperature in dark.
To test the effects of media composition, a series of acetate buffers (pH 5.6) containing combination of trisodium citrate and ascorbic acid at 0.0005 ~ 1 mM, and cysteine, glutathione, oxidized glutathione, methionine, and serine at 0.00005 ~ 1 mM were prepared freshly. The nAg-4.8 nm stock suspension (40 mg/L) was diluted with these modified buffer media to 2 mg/L, and the released silver ion was quantified by centrifugal ultrafiltration and AA after 1 day incubation at room temperature in dark.
Antimicrobial Susceptibility Test
A modified Kirby-Bauer disk diffusion method55 was applied to investigate the antimicrobial activity of different controlled release formulations of nAg. Silver impregnated antibiotic discs were prepared by loading Whatman Grade 1 filter papers (10 mm diameter) with nAg-4.8 nm, MUA modified nAg-4.8 nm, and AgNO3 solutions at the same silver dose. Dried nAg impregnated filter papers were also preoxidized with O3 at 2300 ppm (flow rate 1 L/min) for 3 h. E. coli K12 strain TOP10 (Invitrogen) was cultured in LB medium at 37 °C in a shaking incubator overnight. The resulted bacterial suspension was diluted with LB medium to the approximate concentration of 1×10⁸ CFU/mL and used as inoculum. A quantity of this inoculation solution (150 µL) was placed and spread on Muller Hinton agar growth plates. After about 10 min to allow absorption of surface moisture, silver antibiotic discs were gently placed onto the top of agar, a clean filter paper was placed in the center as a negative control. After incubating overnight (18 h) at 37 °C, colonies were visualized, and digital images of the plates were captured.
Supplementary Material
Acknowledgement
This work was financially supported by EPA STAR grant R833862 and the Superfund Research Program grant P42ES013660 from the National Institute of Environmental Health Sciences. Although sponsored by the EPA and NIEHS, this work does not necessarily reflect the views of either agency. We gratefully acknowledge Charles Vaslet and Dr. Agnes Kane for assistance with the antimicrobial assay, and David Murray and Joseph Orchardo for the technical support in AA analysis.
Footnotes
Supporting Information Available: Additional details of results are included. This material is available free of charge via the internet at http://pubs.acs.org.
REFERENCES AND NOTES
- 1.Kim JS, Kuk E, Yu KN, Kim JH, Park SJ, Lee HJ, Kim SH, Park YK, Park YH, Hwang CY, et al. Antimicrobial Effects of Silver Nanoparticles. Nanomedicine: NBM. 2007;3:95–101. doi: 10.1016/j.nano.2006.12.001. [DOI] [PubMed] [Google Scholar]
- 2.Luoma SN. Silver Nanotechnologies and the Environment: Old problems or New Challenges? Washington, DC: Woodrow Wilson International Center for Schlars; 2008. [Google Scholar]
- 3.Benn TM, Westerhoff P. Nanoparticle Silver Released into Water from Commercially Available Sock Fabrics. Environ. Sci. Technol. 2008;42:4133–4139. doi: 10.1021/es7032718. [DOI] [PubMed] [Google Scholar]
- 4.Carlson C, Hussain SM, Schrand AM, Braydich-Stolle LK, Hess KL, Jones RL, Schlafer JJ. Unique Cellular Interaction of Silver Nanoparticles: Size-Dependent Generation of Reactive Oxygen Species. J. Phys. Chem. B. 2008;112:13608–13619. doi: 10.1021/jp712087m. [DOI] [PubMed] [Google Scholar]
- 5.Hussain SM, Schlager JJ. Safety Evaluation of Silver Nanoparticles: Inhalation Model for Chronic Exposure. Toxicol. Sci. 2009;108:223–224. doi: 10.1093/toxsci/kfp032. [DOI] [PubMed] [Google Scholar]
- 6.Wiesner MR, Lowry GV, Alvarez P, Dionysiou D, Biswas P. Assessing the Risks of Manufactured Nanomaterials. Environ. Sci. Technol. 2006;40:4336–4345. doi: 10.1021/es062726m. [DOI] [PubMed] [Google Scholar]
- 7.Atiyeh BS, Costagliola M, Hayek SN, Dibo SA. Effect of Silver on Burn Wound Infection Control and Healing: Review of the Literature. Burns. 2007;33:139–148. doi: 10.1016/j.burns.2006.06.010. [DOI] [PubMed] [Google Scholar]
- 8.Pal S, Tak YK, Song JM. Does the Antibacterial Activity of Silver Nanoparticles Depend on the Shape of the Nanoparticle? A Study of the Gram-Negative Bacterium. Escherichia coli. Appl. Environ. Microbiol. 2007;73:1712–1720. doi: 10.1128/AEM.02218-06. [DOI] [PMC free article] [PubMed] [Google Scholar]
- 9.Sharma VK, Yngard RA, Lin Y. Silver Nanoparticles: Green Synthesis and Their Antimicrobial Activities. Adv. Coll. Int. Sci. 2009;145:83–96. doi: 10.1016/j.cis.2008.09.002. [DOI] [PubMed] [Google Scholar]
- 10.Lubick N. Nanosilver Toxicity: Ions, Nanoparticles - or Both? Environ. Sci. Technol. 2008;42:8617. doi: 10.1021/es8026314. [DOI] [PubMed] [Google Scholar]
- 11.Kittler S, Greulich C, Diendorf J, Koller M, Epple M. Toxicity of Silver Nanoparticles Increases during Storage Because of Slow Dissolution under Release of Silver Ions. Chem. Mater. 2010;22:4548–4554. [Google Scholar]
- 12.Asharani PV, Mun GLK, Hande MP, Valiyaveettil S. Cytotoxicity and Genotoxicity of Silver Nanoparticles in Human Cells. ACS Nano. 2009;3:279–290. doi: 10.1021/nn800596w. [DOI] [PubMed] [Google Scholar]
- 13.Chen M, Yan L, He H, Chang Q, Yu Y, Qu J. Catalytic Sterilization of Escherichia coli K12 on Ag/Al2O3 Surface. J. Inorg. Biochem. 2007;101:817–823. doi: 10.1016/j.jinorgbio.2007.01.008. [DOI] [PMC free article] [PubMed] [Google Scholar]
- 14.Holt KB, Bard AJ. Interaction of Silver(I) Ions with the Respiratory Chain of Escherichia coli: An Electrochemical and Scanning Electrochemical Microscopy Study of the Antimicrobial Mechanism of Micromolar Ag+ Biochem. 2005;44:13214–13223. doi: 10.1021/bi0508542. [DOI] [PubMed] [Google Scholar]
- 15.Choi O, Hu Z. Size Dependent and Reactive Oxygen Species Related Nanosilver Toxicity to Nitrifying Bacteria. Environ. Sci. Technol. 2008;42:4583–4588. doi: 10.1021/es703238h. [DOI] [PubMed] [Google Scholar]
- 16.Lok C, Ho C, Chen R, He Q, Yu W, Sun H, Tam PK, Chiu J, Che C. Silver Nanoparticles: Partial Oxidation and Antibacterial Activities. J. Biol. Inorg. Chem. 2007;12:527–534. doi: 10.1007/s00775-007-0208-z. [DOI] [PubMed] [Google Scholar]
- 17.Liu J, Hurt RH. Ion Release Kinetics and Particle Persistence in Aqueous Nano-Silver Colloids. Environ. Sci. Technol. 2010;44:2169–2175. doi: 10.1021/es9035557. [DOI] [PubMed] [Google Scholar]
- 18.Kumar R, Münstedt H. Polyamide/Silver Antimicrobials: Effect of Crystallinity on the Silver Ion Release. Polym. Int. 2005;54:1180–1186. [Google Scholar]
- 19.Damm C, Münstedt H, Rösch A. Long-Term Antimicrobial Polyamide 6/Silver-Nanocomposites. J. Mater. Sci. 2007;42:6067–6073. [Google Scholar]
- 20.Damm C, Münstedt H, Rösch A. The Antimicrobial Efficacy of Polyamide 6/Silver-Nano and Microcomposites. Mater. Chem. Phys. 2008;108:61–66. [Google Scholar]
- 21.Damm C, Münstedt H. Kinetic Aspects of the Silver Ion Release from Antimicrobial Polyamide/Silver Nanocomposites. Appl. Phys. A. 2008;91:479–486. [Google Scholar]
- 22.Sánchez-Valdes S, Ortega-Ortiz H, Romos-de Valle LF, Medellín-Rodríguez FJ, Guedea-Miranda R. Mechanical and Antimicrobial Properties of Multilayer Films with Polyethylene/Silver Nanocomposite Layer. J. Appl. Polym. Sci. 2009;111:953–962. [Google Scholar]
- 23.Hogstrand C, Wood CM. Toward a Better Understanding of the Bioavailability, Physiology, and Toxicity of Silver in Fish: Implications for Water Quality Criteria. Environ. Toxicol. Chem. 1998;17:547–561. [Google Scholar]
- 24.Liau SY, Read DC, Pugh WJ, Furr JR, Russell AD. Interaction of Silver Nitrate with Readily Identifiable Groups: Relationship to the Antibacterial Action of Silver Ions. Lett. Appl. Microbiol. 1997;25:279–283. doi: 10.1046/j.1472-765x.1997.00219.x. [DOI] [PubMed] [Google Scholar]
- 25.Chen X, Schluesener HJ. Nanosilver: A Nanoproduct in Medical Application. Toxicol. Lett. 2008;176:1–12. doi: 10.1016/j.toxlet.2007.10.004. [DOI] [PubMed] [Google Scholar]
- 26.Adams NWH, Kramer JR. Potentiometric Determination of Silver Thiolate Formation Constants Using a Ag2S Electrode. Aqua. Geochem. 1999;5:1–11. [Google Scholar]
- 27.Thunqvist E-L. Regional Increase of Mean Chloride Concentration in Water Due to the Application of Deicing Salt. Sci. Total Environ. 2004;325:29–37. doi: 10.1016/j.scitotenv.2003.11.020. [DOI] [PubMed] [Google Scholar]
- 28.Kaushal SS, Groffman PM, Likens GE, Belt KT, Stack WP, Kelly VR, Band LE, Fisher GT. Increased Salinization of Fresh Water in the Northeastern United States. PNAS. 2005;102:13517–13520. doi: 10.1073/pnas.0506414102. [DOI] [PMC free article] [PubMed] [Google Scholar]
- 29.Acker H, Pietruschka F, Zierold K. Comparative Measurements of Potassium and Chloride with Ion-Sensitive Microelectrodes and X-ray Microanalysis in Cultured Skeletal Muscle Fibers. In vitro Cell. Develop. Biol. 1985;21:45–48. doi: 10.1007/BF02620913. [DOI] [PubMed] [Google Scholar]
- 30.Choi O, Deng KK, Kim N, Ross L, Surampalli RY, Hu Z. The Inhibitory Effects of Silver Nanoparticles, Silver Ions, and Silver Chloride Colloids on Microbial Growth. Water Res. 2008;42:3066–3074. doi: 10.1016/j.watres.2008.02.021. [DOI] [PubMed] [Google Scholar]
- 31.Cortese-Krott MM, Münchow M, Pirev E, Heβner F, Bozkurt A, Uciechowski P, Pallua N, Kröncke K, Suschek CV. Silver Ions Induce Oxidative Stress and Intracellular Zinc Release in Human Skin Fibroblasts. Free Radic. Biol. Med. 2009;47:1570–1577. doi: 10.1016/j.freeradbiomed.2009.08.023. [DOI] [PubMed] [Google Scholar]
- 32.Poon VKM, Burd A. In vitro Cytotoxity of Silver: Implication for Clinical Wound Care. Burns. 2004;30:140–147. doi: 10.1016/j.burns.2003.09.030. [DOI] [PubMed] [Google Scholar]
- 33.Ayala-Núñez NV, Villegas HHL, Turrent L, Padilla CR. Silver Nanoparticles Toxicity and Bactericidal Effect Against Methicillin-Resistant Staphylococcus aureus: Nanoscale Dose Matter. Nanobiotechnol. 2009;5:2–9. [Google Scholar]
- 34.Cantin AM, North SL, Hubbard RC, Crystal RG. Normal Alveolar Epithelial Lining Fluid Contains High Levels of Glutathione. J. Appl. Physiol. 1987;63:152–157. doi: 10.1152/jappl.1987.63.1.152. [DOI] [PubMed] [Google Scholar]
- 35.Albert BJ, Koide K. How Rapidly do Epoxides Nonspecifically from Covalent Bonds with Thiols in Water? Chembiochem. 2007;8:1912–1915. doi: 10.1002/cbic.200700365. [DOI] [PubMed] [Google Scholar]
- 36.Pitts KE, Summers AO. The Roles of Thiols in the Bacterial Organomercurial Lyase (MerB) Biochem. 2002;41:10287–10296. doi: 10.1021/bi0259148. [DOI] [PubMed] [Google Scholar]
- 37.Kloek J, Ark I, Bloksma N, Clerck FD, Nijkamp FP, Folkerts G. Glutathione and Other Low-Molecular-Weight Thiols Relax Guinea Pig Trachea ex vivo: Interactions with Nitric Oxide? Am. J. Physiol. Lung Cell Mol. Physiol. 2002;283:L403–L408. doi: 10.1152/ajplung.00376.2001. [DOI] [PubMed] [Google Scholar]
- 38.Wen L, Santschi PH, Gill GA, Tand D. Silver Concentrations in Colorado, USA, Watersheds Using Improved Methodology. Environ. Toxicol. Chem. 2002;21:2040–2051. [PubMed] [Google Scholar]
- 39.Schmidt M, Masson A, Bréchignac C. Oxygen and Silver Clusters: Transition from Chemisorption to Oxidation. Phys. Rev. Lett. 2003;91:243401–243404. doi: 10.1103/PhysRevLett.91.243401. [DOI] [PubMed] [Google Scholar]
- 40.Munro CH, Smith WE, Garner M, Clarkson J, White PC. Characterization of the Surface of a Citrate-Reduced Colloid Optimized for Use as a Substrate for Surface-Enhanced Resonance Raman Scattering. Langmuir. 1995;11:3712–3720. [Google Scholar]
- 41.Mabuchi M, Takenaka T, Fujiyoshi Y, Uyeda N. Surface Enhanced Raman Scattering of Citrate Ions Adsorbed on Gold Sol Particles. Surf. Sci. 1982;119:150–158. [Google Scholar]
- 42.Love JC, Estroff LA, Kriebel JK, Nuzzo RG, Whitesides GM. Self-Assembled Monolayers of Thiolates on Metals as a Form of Nanotechnology. Chem. Rev. 2005;105:1103–1170. doi: 10.1021/cr0300789. [DOI] [PubMed] [Google Scholar]
- 43.Romanska D, Mazur M. Electrochemical Preparation of Thiol-Coated Silver Nanostructures on Highly Oriented Pyrolytic Graphite. Langmuir. 2003;19:4532–4534. [Google Scholar]
- 44.Kulkarni AB, Uplane MD, Lokhande CD. Preparation of Silver Sulphide form Chemically Deposited Silver Films. Mater. Chem. Phys. 1995;41:75–58. [Google Scholar]
- 45.Ma Y, Yi J, Zhang L. A Facial Approach to Incorporate Silver Nanoparticles into Dextran-Based Hydrogels for Antibacterial and Catalytical Application. J. Macromol. Sci. Part A: Pure Appl. Chem. 2009;46:643–648. [Google Scholar]
- 46.Rao YN, Banerjee D, Datta A, Das SK, Guin R, Saha A. Gamma Irradiation Route to Synthesis of Highly Re-dispersible Nature Polymer Capped Silver Nanoparticles. Radia. Phy. Chem. 2010;79:1240–1246. [Google Scholar]
- 47.Chen M, Wang L, Han J, Zhang J, Li Z, Qian D. Preparation and Study of Polyacryamide-Stabilized Silver Nanoparticles through a One-Pot Process. J. Phy. Chem. B. 2006;110:11224–11231. doi: 10.1021/jp061134n. [DOI] [PubMed] [Google Scholar]
- 48.Grubbs RB. Roles of Polymer Ligands in Nanoparticle Stabilization. Polym. Rev. 2007;47:197–215. [Google Scholar]
- 49.Goldstone JV, Voelker BM. Chemistry of Superoxide Radical in Seawater: CDOM Associated Sink of Superoxide in Coastal Waters. Environ. Sci. Technol. 2000;34:1043–1048. [Google Scholar]
- 50.Pakhomov PM, Ovchinnikov MM, Khizhnyak SD, Lavrienko MV, Nierling W, Lechner MD. Study of Gelation in Aqueous Solutions of Cysteine and Silver Nitrate. Colloid. Jour. 2004;66:65–70. [Google Scholar]
- 51.Buettner GR, Jurkiewicz BA. Catalytic Metals, Ascorbate and Free Radicals: Combinations to Avoid. Radiat. Res. 1996;145:532–541. [PubMed] [Google Scholar]
- 52.Gustafsson JP. Visual MINTEQ version 3.0: A Chemical Equilibrium Speciation Code. Sweden: Department of Land and Water Resources Engineering, KTH; 2010. [Google Scholar]
- 53.Domínguez E, Marko-Varga G, Hahn-Hägerdal B, Gorton L. Activity of Immobilized Yeast Aldehyde Dehydrogenase in a Flow-Injection System. Anal. Chim. Acta. 1991;249:145–154. [Google Scholar]
- 54.Lee PC, Meisel D. Adsorption and Surface-Enhanced Raman of Dyes on Silver and Gold Sols. J. Phys. Chem. 1982;86:3391–3395. [Google Scholar]
- 55.Sambhy V, MacBride MM, Peterson BR, Sen A. Silver Bromide Nanoparticle/Polymer Composites: Dual Action Tunable Antimicrobial Material. J. Am. Chem. Soc. 2006;128:9798–9808. doi: 10.1021/ja061442z. [DOI] [PubMed] [Google Scholar]
Associated Data
This section collects any data citations, data availability statements, or supplementary materials included in this article.


