

Abstract
A Bax- and, apparently, mitochondria-dependent increase in superoxide (O2·−) and other reactive oxygen species (ROS) occurs in apoptotic superior cervical ganglion (SCG) and cerebellar granule (CG) neurons. Here we show that Bax also lies upstream of ROS produced in nonapoptotic neurons and present evidence that caspases partially mediate the pro-oxidant effect of Bax. We used the O2·−-sensitive dye MitoSOX to monitor O2·− in neurons expressing different levels of Bax and mitochondrial superoxide dismutase (SOD2). Basal and apoptotic O2·− levels in both SCG and CG neurons were reduced in SOD2 wild-type (WT) cells having lower Bax concentrations. Apoptotic and nonapoptotic neurons from Bax-WT/SOD2-null but not Bax-null/SOD2-null mice had increased O2·− levels. A caspase inhibitor inhibited O2·− in both apoptotic and nonapoptotic SCG neurons. O2·− production increased when WT, but not Bax-null, SCG neurons were permeabilized and treated with active caspase 3. There was no apoptosis and little increase in O2·− in SCG neurons from caspase 3-null mice exposed to an apoptotic stimulus. O2·− levels in nonapoptotic caspase 3-null SCG neurons were lower than in WT cells but not as low as in caspase inhibitor-treated cells. These data indicate that Bax lies upstream of most O2·− produced in neurons, that caspase 3 is required for increased O2·− production during neuronal apoptosis, that caspase 3 is partially involved in O2·− production in nonapoptotic neurons, and that other caspases may also be involved in Bax-dependent O2·− production in nonapoptotic cells.
Introduction
Species of oxygen that are more reactive than dioxygen (O2) are known as reactive oxygen species (ROS) (Punchard and Kelly, 1996). Biological organisms produce ROS by enzymatic mechanisms or as byproducts of mitochondrial metabolism. ROS have several physiologically important functions in cells but can also cause cellular injury if produced in excess (Halliwell and Gutteridge, 2007). ROS-induced oxidative stress is implicated in the neuronal damage occurring in ischemia (Abramov et al., 2007), Alzheimer's disease (Pratico et al., 2001; Lin and Beal, 2006), Parkinson's disease (Sherer et al., 2003; Keeney et al., 2006), and many other neuronal and non-neuronal pathologies (Halliwell and Gutteridge, 2007). Evidence also suggests that ROS have a role in the degenerative physical transformations occurring in the aging brain and other aging organ systems (Kokoszka et al., 2001; Pollack et al., 2002; Barja, 2004; Maklashina and Ackrell, 2004; Melov, 2004; Miller, 2004).
ROS include both free radical and non-free radical forms. The principal biologically produced free radical ROS is superoxide (O2·− ), and the major non-free radical ROS is hydrogen peroxide (H2O2). A primary source of O2·− is the mitochondrial electron transport chain where a fraction of the O2 consumed is reduced to O2·− by electrons that leak from the respiratory complexes (Turrens, 1997; Liu et al., 2002; Andreyev et al., 2005). The O2·− produced rapidly converts to H2O2 by a dismutation reaction catalyzed by superoxide dismutase (SOD) enzymes. The H2O2 can subsequently be converted to other ROS. However, most H2O2 rapidly converts to H2O via reactions catalyzed by the enzymes glutathione peroxidase and catalase.
Augmented production of ROS occurs in neurons undergoing apoptotic death (Tan et al., 1998). The increased ROS in apoptotic mouse superior cervical ganglion (SCG) and cerebellar granule (CG) neurons lie downstream of the proapoptotic protein Bax and appears to derive from the mitochondria electron transport chain (Kirkland and Franklin, 2001; Kirkland et al., 2002, 2007a,b). We previously provided evidence that these ROS are an important part of the apoptotic process in these cells (Kirkland and Franklin, 2001; Kirkland et al., 2002). Although a great deal is known about mechanisms for clearance of ROS from cells, very little is understood about how the production of ROS, particularly by mitochondria, is regulated (Halliwell and Gutteridge, 2007; Leitch et al., 2009). In this paper, we demonstrate that Bax lies upstream of most O2·− and other ROS produced not only in apoptotic but also in nonapoptotic SCG and CG neurons in cell culture. We also show that much of the pro-oxidant effect of Bax in apoptotic SCG neurons is mediated via activation of caspase 3 and that caspases in addition to caspase 3 may be involved in the pro-oxidant effect of Bax in nonapoptotic neurons. ROS, Bax, and caspases have all been implicated in many pathological conditions. Elucidation of the relationship between the three is important for understanding the etiology of these pathologies and may also contribute to an understanding of how healthy neurons regulate their redox state.
Materials and Methods
Reagents.
5-(and-6)-Chloromethyl-2,7-dichlorodihydrofluorescein diacetate (CM-H2DCFDA), MitoSOX Red, MitoTracker Green, rhodamine-labeled polydextran, and tetramethyl rhodamine methyl ester (TMRM+) were purchased from Invitrogen. Nerve growth factor 2.5S (NGF) was purchased from Harlan Bioproducts. Recombinant active mouse caspase 3 was obtained from MBL International. Recombinant truncated mouse Bax α (amino acids 38-171) was obtained from ProSpec-Tany TechnoGene Ltd. All other reagents were purchased from Sigma unless otherwise stated.
Mouse breeding and genotyping.
DNA for genotyping was extracted from the tail of each mouse pup using a Wizard Prep kit (Promega) or a Quick Extraction kit (Epicenter Biotechnologies). Mice deficient in both bax alleles (bax−/−) breed poorly (female) or not at all (male) (Knudson et al., 1995). Therefore, mice hemizygous for the bax allele (bax+/−; C57BL/6 genetic background) were mated to generate bax+/+, bax+/−, and bax−/− offspring. Founding breeders were obtained from The Jackson Laboratory. Both the mutant and the wild-type alleles were amplified by a single PCR. Primers and PCR protocol have been detailed by Kirkland et al. (2002). Mice hemizygous for sod2 (Sod2tm1Leb in a C57BL/6 genetic background) were obtained from The Jackson Laboratory. bax+/− mice were crossed with the hemizygous sod2 (sod2+/−) mice to generate bax+/−/sod2+/− breeders. Pups born to these breeders had the following genotypes: bax+/+/sod2+/+, bax+/+/sod2+/−, bax+/+/sod2−/−, bax+/−/sod2+/+, bax+/−/sod2+/−, bax+/−/sod2−/−, bax−/−/sod2+/+, bax−/−/sod2+/−, and bax−/−/sod2−/− in Mendelian ratios. PCR was used to amplify regions from both the wild-type and the mutant sod2 alleles. A forward primer (5′-GAA AGG ACG TTT ATG CGA ACC AAC-3′) and a reverse primer (5′-GGC CTA CGT GAA CAA CCT CAA C-3′) amplified a 134 bp portion of the wild-type allele. In the same reaction tube, a forward primer (5′-CCA GTC TCA GGG GCA ACA AAG ATG-3′) along with a mutant-specific reverse primer (5′-CGC CTA CCG GTG GAT GTG GAA TGT-3′) generated a 311 bp product from the mutant allele. The cycling parameters were 4 min at 94°C, followed by 35 cycles of 30 s at 94°C, 30 s at 59°C, and 30 s at 72°C. All newborn pups appeared healthy. However, mice with a sod2−/− genotype typically died within 1 week of birth.
We purchased one male caspase 3 null mouse (casp3−/−; casp3tm1Flv in a C57BL/6 genetic background) from The Jackson Laboratory. It was mated with female C57BL/6 casp3+/+ mice to generate casp3+/− progeny. These mice were then crossed to produce casp3+/+, casp3+/−, and casp3−/− offspring. A single PCR amplified regions from both the wild-type and the mutant casp3 alleles. A forward primer (5′-GCG AGT GAG AAT GTG CAT AAA TTC-3′) and a reverse primer (5′-GGG AAA CCA ACA GTA GTC AGT CCT-3′) amplified a 320 bp portion of the wild-type allele. The same forward primer along with a mutant-specific reverse primer (5′-TGC TAA AGC GCA TGC TCC AGA CTG-3′) generated a 300 bp product from the mutant allele. The cycling parameters were 3 min at 94°C, followed by 35 cycles of 30 s at 94°C, 1 min at 64°C, and 1 min at 72°C. This was followed by 2 min at 72°C to allow complete extension of amplification products.
Cell culture.
SCGs were dissected from newborn mice. Neurons were enzymatically and mechanically dissociated from the ganglia and plated on an ammoniated collagen substrate as described (Martin et al., 1988; Deckwerth and Johnson, 1993; Franklin et al., 1995; Kirkland et al., 2002). Cells were cultured on #1 glass coverslips (Bellco Glass) for microscopy experiments, on 35 mm plastic Costar tissue culture dishes (Corning) for immunoblot experiments and on 96-well culture dishes (Corning) for biochemistry experiments. Separate cultures were established from the ganglia of each pup from litters in which the pups could have different genotypes. Cells from one-half to one ganglion were plated per culture for most experiments. Cultures were maintained in a medium consisting of Eagle's minimum essential medium with Earle's salts (Invitrogen) supplemented with 10% heat-inactivated fetal bovine serum, 100 U/ml penicillin, 100 μg/ml streptomycin, 20 μm fluorodeoxyuridine, 20 μm uridine, 1.4 mm l-glutamine, and 50 ng/ml NGF. Apoptosis was induced by replacing the culture medium with the same one lacking NGF and containing an anti-NGF antibody (Cedarlane Labs) as described (Kirkland et al., 2007b). Cultures were maintained at 35°C in an incubator having an atmosphere of 95% air and 5% CO2.
Cultures of CG neurons were prepared as described (Miller and Johnson, 1996). Cells were dissociated from the cerebella of 7- to 10-d-old mice and plated (∼2.5 × 10⁵ cells/cm2) on a poly-l-lysine (0.1%) substrate coated onto #1 glass coverslips (Bellco Glass) for microscopy experiments or onto 35 mm plastic Costar tissue culture dishes (Corning) for immunoblot experiments. Cultures were maintained at 35°C in an incubator with a 5% CO2 and 95% air atmosphere in Basal Medium Eagle (Invitrogen) with 25 mm KCl (to depolarize plasma membrane potential), 10% dialyzed fetal bovine serum (10,000 molecular weight cutoff), 50 U/ml penicillin, and 50 μg/ml streptomycin sulfate. Apoptosis was induced by repolarizing membrane potential by switching cultures to the same medium containing 5 mm KCl and no serum. All SCG and CG neuron experiments were done with cultures from three or more platings that had been in culture for 6–9 d after plating.
Microscopy.
Phase-contrast microscopy was done with a Nikon Eclipse TE 300 inverted microscope. Cells were observed with a 60×-plan oil-immersion lens objective (numerical aperture 1.4), and images were collected by a cooled CCD camera (Micro-Max; Princeton Instruments) controlled by MetaMorph software (Molecular Devices) running on a Dell computer. Confocal microscopy was done with a Nikon C1 laser-scanning confocal microscope mounted on the Nikon Eclipse TE 300 microscope. The confocal microscope was controlled by EZC1 software (Nikon) running on a Dell computer. The 60× objective was used to visualize neurons. Cells were scanned at 512 × 512 pixel resolution, except for those used for illustration, which were scanned at 2048 × 2048 pixel resolution. All confocal settings were maintained at a constant level during experiments.
ROS, mitochondrial membrane potential (Δψm), and MitoTracker Green measurements.
We used the redox-sensitive dye CM-H2DCFDA to detect multiple ROS species. We extensively characterized the use of this dye in SCG and CG neurons (Kirkland and Franklin, 2001; Kirkland et al., 2002, 2007a,b). CM-H2DCFDA becomes fluorescent when oxidized by H2O2 and ROS lying downstream of H2O2. It is also sensitive to oxidation by many other ROS and can be considered to be a generalized reporter for many different cellular ROS. It is relatively insensitive to oxidation by O2·− but is particularly sensitive to oxidation by OH· (Royall and Ischiropoulos, 1993; Halliwell and Gutteridge, 2007; Kirkland et al., 2007b). Another major reactive species that potently oxidizes the dye is peroxynitirite (NOO−). NOO− does not appear to be present in apoptotic SCG neurons. Nitric oxide synthase inhibitors have no effect on CM-H2DCFDA-detected ROS in apoptotic SCG neurons (Kirkland and Franklin, 2001; Kirkland et al., 2002). Conversely, membrane-permeant polyethylene glycol (PEG)-catalase (Liu et al., 1989) completely suppressed these ROS, suggesting that the dye is being oxidized primarily by H2O2 or ROS derived from H2O2 (data not shown). CM-H2DCFDA may detect this species in CG neurons. CM-H2DCFDA is readily membrane permeant and is trapped in cells by binding to cellular thiols. Both SCG and CG neurons were loaded in the incubator for 20 min with 10 μm CM-H2DCFDA in experimental culture medium, followed by two washes in Leibovitz L-15 medium. They were left in the last wash for microscopy. CM-H2DCFDA was excited by the 488 nm line of the laser, and images were acquired with the green photomultiplier channel of the confocal microscope. We previously demonstrated that NGF-supported or -deprived bax+/+/sod2+/+, bax+/−/sod2+/+, and bax−/−/sod2+/+ SCG neurons load equal amounts of this dye (Kirkland et al., 2002). These data demonstrate that the different Bax levels in the three genotypes did not interfere with the concentration of CM-H2DCFDA loaded into cells or with the ability of CM-H2DCFDA to be oxidized. Supplemental Figure 1 (available at www.jneurosci.org as supplemental material) shows that CM-H2DCFDA loading and oxidation in SCG neurons were also not affected by altering both bax and sod genotypes.
Relative O2·− levels were determined with MitoSOX Red (Zhao et al., 2003, 2005; Ross et al., 2005; Robinson et al., 2006) as described (Kirkland et al., 2007b). MitoSOX consists of a triphenylphosphonium cation linked to hydroethidine. The cation moiety targets MitoSOX to the mitochondrial matrix because of the large Δψm across the inner mitochondrial membrane (IMM). MitoSOX localizes to mitochondria in mouse SCG and CG neurons (Johnson-Cadwell et al., 2007; Kirkland et al., 2007b). Oxidation by O2·− of the hydroethidine generates 2-hydroxyethidium that binds to mitochondrial DNA and fluoresces (Zhao et al., 2003, 2005; Ross et al., 2005; Robinson et al., 2006). We previously demonstrated that MitoSOX selectively detects O2·− in SCG neurons when excited with a 408 laser line (Kirkland et al., 2007b). Supplemental Figure 2 (available at www.jneurosci.org as supplemental material) shows that representative bax and sod2 genotypes investigated in this study had equal amounts of mitochondrial DNA. Therefore, the differences in MitoSOX intensity noted in the different genotypes here cannot be explained by differences in the amount of mitochondrial DNA available for MitoSOX binding. As stated in figure legends, cultures were incubated at 35°C in experimental medium containing MitoSOX (2 μm for SCG and 0.1 μm for CG neurons) for 10 or 30 min. They were then washed two times with L-15 medium and maintained in L-15 for microscopy. Unless otherwise stated, the 408 nm line of the confocal laser was used for excitation (Robinson et al., 2006), and the red photomultiplier channel of the confocal microscope was used for image acquisition.
Unless otherwise stated, for relative determination of Δψm cultures were exposed in the incubator for 20 min to experimental culture medium containing 10 nm of the Δψm-dependent dye TMRM+ (Kirkland and Franklin, 2007a). They were then washed two times with L-15 medium containing the experimental treatments and 10 nm TMRM+ and left in the last wash for microscopy. TMRM+ was excited with the 543 nm laser line of the confocal microscope, and the red photomultiplier channel was used for emission. All microscopy was done at room temperature.
Mitochondria were stained with the mitochondria-specific dye MitoTracker Green by exposing cultures in the incubator for 10 min to culture medium containing 0.1 μm MitoTracker Green (Kirkland et al., 2007).
The raw pixel intensities of all confocal images for each of the four dyes used were quantified with the region tool of MetaMorph software. The tool was set to cover a circular cytoplasmic area of 60 μm2. Dye intensities were normalized to the average dye intensity in NGF-maintained sibling cultures of SCG neurons or 25 mm KCl/serum-maintained sibling cultures of CG neurons exposed to the dye in the same manner as the experimental cells. Data are shown as fold change from this average.
Immunoblotting and immunocytochemistry.
Western blotting was done essentially as described (Kirkland et al., 2002). Cells were scraped from the substrate in PBS, transferred to Eppendorf tubes, washed once with ice-cold PBS containing 1 mm EDTA, and then homogenized with disposable pestles (Kontes) in a lysis buffer consisting of 25% glycerol, 60 mm Tris, pH 6.8, 10 mm dithiothreitol, 1 mm EDTA, 0.1% bromophenol blue, 2% SDS, and a 1:100 dilution of a protease inhibitor cocktail from Calbiochem or Sigma. After boiling for 5 min, samples were returned to room temperature, spun to pellet debris, and loaded into wells of 10 or 12% Tris-HCl precast gels (Bio-Rad or Life Gels). After separation by electrophoresis, proteins were transferred onto polyvinylidene difluoride membranes (Millipore), blocked for 1 h with 2% GE Healthcare blocking agent in 20 mm Tris buffered saline (TBS) containing 0.1% Tween 20 (TBS-T). After several washes with TBS-T, membranes were incubated for 1 h in blocking buffer containing the primary antibody. The primary antibodies used were as follows: cytochrome c (1:1000 dilution; BD Biosciences Pharmingen), β tubulin III (1:1000 dilution; Sigma), Bax (1:500 dilution; Santa Cruz Biotechnology), and SOD1 and SOD2 (0.2 μg/ml each; StressGen). After several more washes in TBS-T, membranes were incubated for 1 h at room temperature in blocking buffer containing an HRP-labeled secondary antibody (1:1000–1:4000) provided with Advance Western Blotting Detection kits (GE Healthcare). They were next washed with TBS-T and incubated in ECL substrate for 1–3 min. A Fotodyne Foto/Analyst Dual-Light Luminary Workstation running TotalLab software was used for blot documentation and analysis.
Cytochrome c and caspase 3 immunocytochemistry were done essentially as described (Deshmukh and Johnson, 1998; Kirkland and Franklin, 2001; Kirkland et al., 2002). Mouse anti-cytochrome c monoclonal antibodies were from BD Biosciences Pharmingen or Promega. The secondary antibody was an anti-mouse antibody conjugated to Alexa Fluor (1.5–1.7 μg/ml; Invitrogen). Rabbit polyclonal mouse anti-caspase 3 antibody was from NeoMarkers. The secondary antibody was an anti-rabbit polyclonal antibody conjugated to Alexa Fluor (Invitrogen).
Caspase 3 assay.
We used the Caspase-Glo 3/7 assay (Promega) to determine caspase 3 activity in cultures of SCG neurons. In this assay, a luminogenic caspase-3/7 substrate is cleaved by either caspase 3 or caspase 7, resulting in release of amino-luciferin, a luciferase substrate. The subsequent reaction of amino-luciferin with luciferase produces light. Intensity of the light is proportional to caspase activity in the sample. Mouse SCG neurons express caspase 3 but not caspase 7 (Wright et al., 2007). Therefore, the assay detects only caspase 3 activity in these cells. Neurons from one ganglion were plated and grown for 6–9 d in each well of white-walled, clear-bottom 96-well plates. The assay was conducted according to the directions of the manufacturer. Briefly, cultures were washed two times with L-15 medium, followed by addition of 200 μl of a 1:1 mixture of Caspase-Glo 3/7 reagent with L-15 medium to lyse cells and start reaction. Plates were shaken, covered, and incubated in the dark at room temperature for 30 min before recording light intensity. Luminescence intensity was measured with a Spectramax M2 microplate reader (Molecular Devices).
Digitonin permeabilization.
Unless otherwise indicated, cultures were treated with intracellular buffer (in mm: 125 KCl, 2 K2HPO4, 1 MgCl2, 2 EGTA, 20 HEPES, pH 7.2, 1 malate, 1 glutamate, and 0.8 ADP) containing digitonin (5 μg/ml) and experimental treatments for 20 min at 35°C in an incubator with a 5% CO2 atmosphere. Cells were then washed with intracellular buffer lacking digitonin and left in this medium for microscopy.
Quantification of mitochondrial DNA.
Genomic and mitochondrial DNA were extracted from SCG cultures using the QuickExtract solution from Epicenter Biotechnologies. Cultures of one-half or one ganglion on coverslips or plastic culture dishes were washed twice with PBS, and the collagen substrate and cells were scraped up from the bottom and transferred to microcentrifuge tubes. All cultures from an individual mouse pup were pooled together. The tubes were centrifuged at 6000 rpm for 60 s to pellet the cells and substrate. The supernatant was removed and the collagen substrate was digested with collagenase (1 mg/ml in Leibovitz's L-15 buffer) at 35°C for 20–30 min, until collagen substrate was no longer or barely visible. The cells were pelleted again at 6000 rpm for 60 s or until solution was clear. The collagenase solution was removed, and the cells were washed twice with PBS. The Quick Extract solution was applied (40 μl per ganglion), and the tubes were vortexed for 15–20 s. After another spin, the tubes were incubated at 65°C for 6 min, then vortexed again, and boiled for 2 min. The A260 of the samples diluted 1:100 in water was taken, and the amount of DNA used in the real-time PCR reactions was based on this reading.
Real-time PCR reactions were performed with the Qiagen QuantiTect SYBR Green PCR kit. Reactions of 25 μl were prepared by combining the SYBR Green master mix (two times) with water and primers (1 μm each, final concentration) and distributing 3.5 reaction volumes worth to individual, labeled tubes. DNA at the appropriate dilution was mixed with an aliquot of the reaction mix, and 25 μl was transferred to wells of a 96-well plate in triplicate. Water was added to each empty well. The samples were run on a Bio-Rad iCycler machine using the following parameters: cycle 1 (one time), 50.0°C for 2 min; cycle 2 (one time), 95.0°C for 10 min; cycle 3 (40 times), 95.0°C for 15 s (step 1) and 60.0°C for 1 min (step 2); cycle 4 (one time), 95.0°C for 15 s (step 1), 60.0°C for 1 min (step 2), and 95.0°C for 15 s (step 3). A mouse genomic DNA gene, lipo protein lipase, was used as a reference gene. It was amplified using the following primer pairs: forward, GGA TGG ACG GTA AGA GTG ATT C; reverse, ATC CAA GGG TAG CAG ACA GGT. A mouse mitochondrial gene, nicotinamide adenine dinucleotide dehydrogenase subunit 1, was amplified using the following primer pairs: forward, CCC ATT CGC GTT ATT CTT; reverse, AAG TTG ATC GTA ACG GAA GC. Primers were obtained from Integrated DNA Technologies. Efficiencies for amplification of each gene were determined from dilution curves.
Statistics.
Tests for normality of each dataset were done before choosing a statistical analysis method. As appropriate to the data distribution, statistical comparisons were made by Kruskal–Wallis one-way ANOVA on ranks, followed by Dunn's multiple comparisons post hoc test, by the Mann–Whitney rank-sum test, or by the Bonferroni's t test. Statistical analysis was done with SigmaPlot 11.1 (Systat Software). All error bars are ± SEM. Graphs were prepared with SigmaPlot 9.0.1 or 11.1 (Systat Software).
Results
Bax concentration determined ROS levels in both apoptotic and nonapoptotic neurons
Both mouse SCG and CG neurons in cell culture increase production of ROS after receiving an apoptotic stimulus. We previously demonstrated that genetically lowering Bax protein concentration in these cells suppresses these ROS and that Bax deletion completely prevents the ROS increase (Kirkland et al., 2002). The mitochondrial uncoupler carbonyl cyanide p-trifluoromethoxyphenylhydrazone (FCCP) used at a concentration that dissipates the mitochondrial membrane potential (Δψm) of SCG neurons also blocks this ROS increase, suggesting that the ROS derive from the mitochondrial electron transport chain (Dugan et al., 1997; Kirkland et al., 2002, 2007b) (supplemental Fig. 3A,B, available at www.jneurosci.org as supplemental material). To further explore the effect of Bax on ROS production in both cell types, we used the redox-sensitive dye CM-H2DCFDA and the newer redox-sensitive dye MitoSOX Red, in conjunction with confocal microscopy (Royall and Ischiropoulos, 1993; Zhao et al., 2003; Robinson et al., 2006). The former compound becomes fluorescent when oxidized by a number of ROS species. Oxidation of MitoSOX followed by its binding to mitochondrial DNA causes it to become fluorescent. This fluorescence can be used to selectively detect O2·− in both of these types of neurons and other cell types (Johnson-Cadwell et al., 2007; Kirkland et al., 2007b). Figure 1A shows phase and confocal micrographs of CM-H2DCFDA- or MitoSOX-stained SCG or CG neurons induced to undergo apoptosis by NGF withdrawal (SCG) or membrane potential repolarization plus serum withdrawal (CG). Induction of apoptosis led to a significant increase in the fluorescence intensities of MitoSOX and CM-H2DCFDA in Bax wild-type (bax+/+) SCG and CG neurons, suggesting increased levels of mitochondrial O2·− and other ROS in them (Fig. 1B) (Kirkland et al., 2002, 2007b). We previously demonstrated that menadione, an O2·− generator, increased MitoSOX fluorescence in these cells but that H2O2 did not (Kirkland et al., 2007b). A membrane-permeant form of SOD, PEG-SOD (Liu et al., 1989), blocked the increased MitoSOX fluorescence in NGF-deprived SCG neurons, providing definitive evidence that it was detecting O2·− in these cells (supplemental Fig. 4A, available at www.jneurosci.org as supplemental material). PEG-SOD also blocked the concurrent increase of CM-H2DCFDA fluorescence intensity in NGF-deprived neurons, indicating that the ROS oxidizing this dye derived from dismutation of O2·− .
Figure 1.
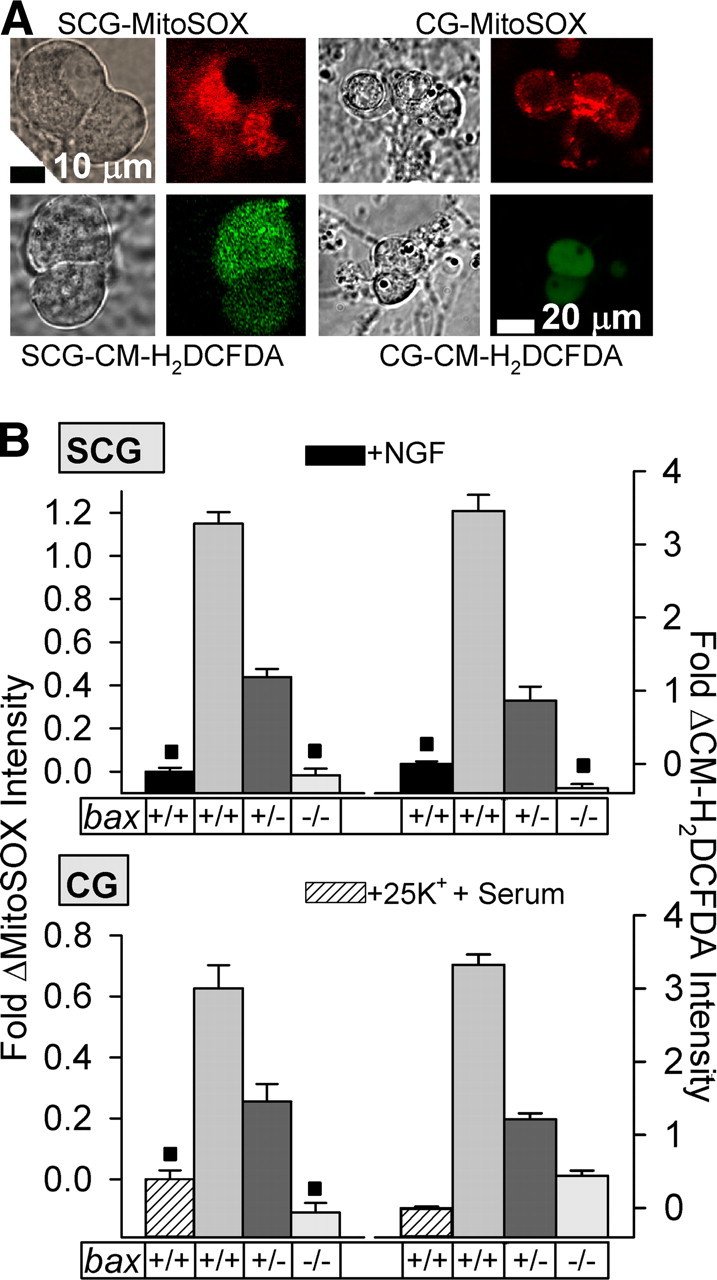
Bax dosage determined rate of O2·− and other ROS production in mouse SCG and CG neurons exposed to apoptotic stimuli. A, Phase and confocal micrographs of NGF-deprived (24 h) SCG neurons and repolarized/serum-starved (6 h) CG neurons exposed to MitoSOX (2 μm for 10 min for SCG neurons and 0.1 μm for 10 min for CG neurons) or to CM-H2DCFDA (10 μm for 20 min for both SCG and CG neurons). Exposure to the dyes in this and subsequent figures was done in the appropriate bicarbonate-buffered culture medium in the incubator. At the end of dye loading, cultures were washed two times with L-15 medium to remove this medium, and cultures were left in the second wash for imaging. Images were immediately acquired by confocal microscopy. Note punctate cytoplasmic staining of MitoSOX, consistent with its demonstrated localization to mitochondria (Johnson-Cadwell et al., 2007; Kirkland et al., 2007b). Repolarization of CG plasma membrane potential and serum withdrawal were accomplished by replacing culture medium containing 25 mm KCl and serum with one containing 5 mm KCl and no serum. B, Genetically decreasing Bax protein concentration reduced both O2·− (MitoSOX intensities) and CM-H2DCFDA-detected ROS levels in SCG and CG neurons receiving apoptotic stimuli. The apoptotic stimuli and dye-loading protocols were the same as in A. MitoSOX and CM-H2DCFDA dye intensities are normalized to the intensity averages of sibling wild-type cultures not receiving apoptotic stimuli (with NGF from time of plating for SCG neurons and 25 mm KCl plus serum for CG neurons). Rate of loading of MitoSOX into these cells during this period is linear (Johnson-Cadwell et al., 2007; Kirkland et al., 2007b). These time points were chosen because they are at or near the peak level of ROS production in these cell types (Kirkland et al., 2002). n = 201–324 (MitoSOX) and 97–317 (CM-H2DCFDA) SCG neurons. n = 124–288 (MitoSOX) and 262–1009 (CM-H2DCFDA) CG neurons. ■p > 0.01, not statistically different. All other conditions are different (p < 0.01).
The Bax protein concentration in bax hemizygous (bax+/−) SCG and CG neurons is approximately half that found in bax+/+ neurons, and Bax is absent in both cell types taken from bax−/− animals (Kirkland et al., 2002) (supplemental Fig. 5, available at www.jneurosci.org as supplemental material). MitoSOX and CM-H2DCFDA fluorescence intensities were lower in bax+/− SCG and CG neurons receiving apoptotic stimuli than in bax+/+ neurons receiving the same stimuli. There was little or no increase in MitoSOX or CM-H2DCFDA intensities in apoptotic SCG and CG neurons completely lacking Bax. These findings, along with those already reported (Kirkland et al., 2002), suggest that the ROS detected by CM-H2DCFDA in SCG and CG neurons undergoing apoptosis lie downstream of dismutated O2·− derived from the mitochondrial electron transport chain and that Bax has a major positive influence on mitochondrial O2·− production in these cells.
While measuring ROS in control (nonapoptotic) neurons, we noted that Bax concentration also affected basal ROS levels in them. Figure 2 shows that O2·− levels, as detected by MitoSOX, were lower in nonapoptotic SCG and CG neurons having genetically reduced concentrations of Bax. The O2·− level in neurons with a bax+/− genotype was lower than that in bax+/+ neurons but higher than the O2·− level in ones with a bax−/− genotype. Similar results were observed with CM-H2DCFDA-detected ROS in these cells. As with NGF-deprived cells, the fluorescence intensity of both MitoSOX and CM-H2DCFDA were greatly attenuated in NGF-maintained SCG neurons treated with PEG-SOD (supplemental Fig. 4A, available at www.jneurosci.org as supplemental material). This finding indicates that O2·− or O2·− -derived ROS oxidized the dyes. Treating NGF-supported bax−/− neurons with PEG-SOD (5 μg/ml for 3 h before and during 30 min dye loading) did not cause any suppression of MitoSOX intensity compared with untreated bax−/− cells, suggesting that Bax lies upstream of almost all O2·− production in these cells (p > 0.1; n = 131–172).
Figure 2.

Bax dosage determined rate of production of O2·− and other ROS in nonapoptotic mouse SCG and CG neurons. Levels of O2·− (MitoSOX intensities) and other ROS (CM-H2DCFDA intensities) were lower in nonapoptotic bax+/− and bax−/− SCG and CG neurons than in bax+/+ cells. NGF-maintained SCG neurons were exposed to 2 μm MitoSOX for 30 min. CG neurons were maintained in medium containing 25 mm KCl and serum and were exposed for 30 min to this medium containing 0.1 μm MitoSOX. Uptake of these concentrations of MitoSOX by mitochondria in both types of neurons is linear for at least 30 min (Johnson-Cadwell et al., 2007; Kirkland et al., 2007b). Cultures were washed with L-15 medium at the end of dye loading, and images were immediately acquired by confocal microscopy. MitoSOX and CM-H2DCFDA dye intensities are normalized to the intensity averages of sibling wild-type cultures not receiving apoptotic stimuli (with NGF from time of plating for SCG neurons and 25 mm KCl plus serum for CG neurons). n = 162–293 (MitoSOX) and 118–293 (CM-H2DCFDA) SCG neurons. n = 79–287 (MitoSOX) and 752–2489 (CM-H2DCFDA) CG neurons. *p < 0.01, significantly different from the other conditions within each graph.
Decreasing cellular Bax concentration counteracted the pro-oxidant effect of reduced SOD activity
The O2·− produced by the mitochondrial electron transport chain is rapidly converted to H2O2 by a dismutation reaction catalyzed by SOD enzymes. Metazoan cells express two different types of SOD, a primarily cytoplasmic form (CuZnSOD, also known as SOD1) (McCord and Fridovich, 1969; Halliwell and Gutteridge, 2007; Leitch et al., 2009) and a form found exclusively in the mitochondrial matrix (MnSOD, also known as SOD2) (Keele et al., 1970; McCord et al., 1977; Halliwell and Gutteridge, 2007). The data in Figures 1 and 2 suggest that Bax lies upstream of most, or all, O2·− production in both apoptotic and nonapoptotic neurons. However, an accurate assessment of the actual degree to which Bax contributes to O2·− production has to take into account removal of O2·− by SOD. High SOD activity could, for example, lead to an underestimation of the degree to which Bax contributes to O2·− production by rapidly removing it from cells. As a first step toward investigating Bax-dependent O2·− production without SOD contributions, we suppressed SOD1 activity in SCG neurons with diethyldithiocarbamic acid (DETCA). This compound potently inhibits SOD1 activity by chelating and removing copper from the active sites of the enzyme (Misra, 1979). Figure 3A shows that DETCA significantly increased O2·− levels in both NGF-deprived and -maintained bax+/− SCG neurons but had little or no effect on bax−/− cells.
Figure 3.
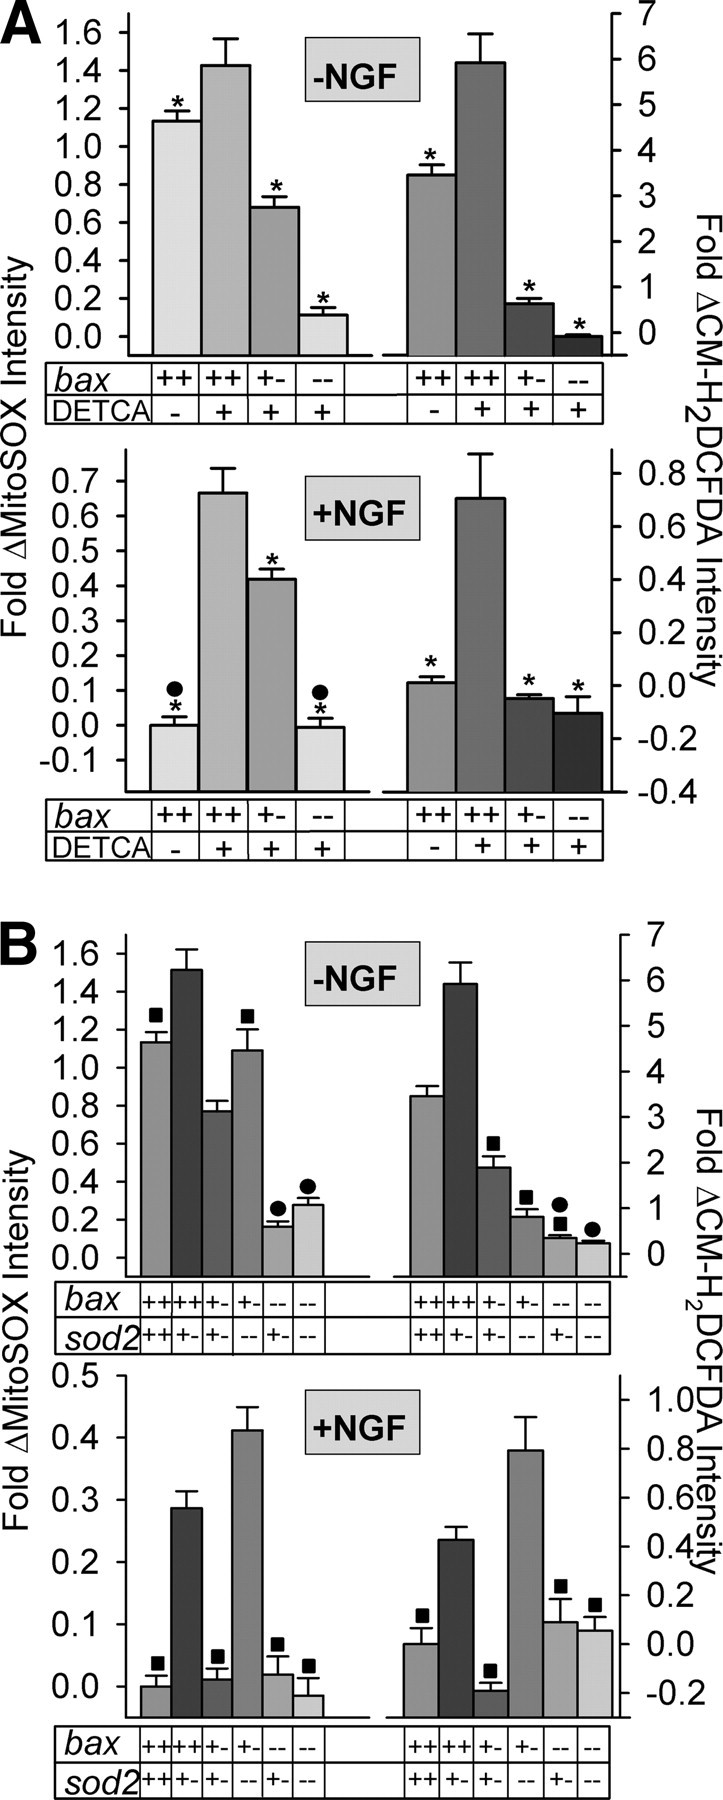
Elevated levels of O2·− and other ROS caused by suppression of SOD1 and SOD2 activities in NGF-deprived or -maintained SCG neurons were inhibited by reducing Bax concentration. A, The SOD1 antagonist DETCA increased O2·− (MitoSOX intensities) and other ROS (CM-H2DCFDA intensities) in both NGF-deprived and -maintained SCG neurons. This increase was inhibited in cells with genetically reduced Bax concentration and was nearly or completely eliminated in neurons containing no Bax. Cultures were pretreated for 1 h with DETCA (100 μm) before loading with the redox-sensitive dyes. Dye loading was done as described in Materials and Methods and in Figures 1 and 2. DETCA and NGF were included when appropriate in the dye-loading media and in the L-15 washes and microscopy media. n = 75–592 neurons. *p < 0.01, significantly different from DETCA-treated bax+/+ cells in each graph. ● indicate conditions that are not statistically different. B, Relative levels of O2·− and other ROS in NGF-deprived (24 h) and -maintained SCG neurons expressing different levels of Bax and SOD2. Reduction of SOD2 concentration increased ROS. This increase was suppressed in neurons with reduced Bax concentrations. n = 105–464 neurons. ■,●p > 0.01, conditions that were not statistically different within a graph. All other conditions were different (p < 0.01). bax+/+/sod2−/− neurons were not included in this study because they appeared unhealthy, likely as a result of damage induced by high ROS levels. In both A and B, MitoSOX and CM-H2DCFDA dye intensities are normalized to the intensity averages of sibling wild-type cultures not receiving apoptotic stimuli (with NGF from time of plating).
The DETCA results indicate that the production of DETCA-sensitive O2·− and other ROS in both NGF-deprived and -maintained SCG neurons was almost completely dependent on Bax. However, DETCA is a nonspecific metal chelator that may affect the activity of copper-containing enzymes other than SOD1 (Kober et al., 2003; Halliwell and Gutteridge, 2007). It can also bind to other transition metals and has been reported to inhibit an MnSOD (Sevilla et al., 1982). Also, DETCA reduces CM-H2DCFDA loading in these cells (supplemental Fig. 1, available at www.jneurosci.org as supplemental material), likely via binding of the dye to the DETCA thiol. Therefore, although the increased O2·− caused by DETCA treatment clearly lay downstream from Bax, we cannot definitively state that it was dismutated by SOD1. There are no specific inhibitors of SOD2. Therefore, to further explore the effects of Bax concentration on mitochondrial O2·− production in neurons, we bred mice hemizygous for sod2 with ones hemizygous for bax to generate animals that were hemizygous for both bax and sod2. Mice that have genetically reduced levels of SOD2 can serve as models of endogenous oxidative stress. The offspring resulting from breeding the doubly hemizygous animals to each other included mice in which a partial or complete loss of SOD2 was accompanied by a partial or complete loss of Bax. There was no effect of reducing sod2 gene dosage on Bax protein concentration, and reducing bax gene dosage had no effect on expression of SOD2. Additionally, altering sod2 and bax gene dosages had no effect on expression of SOD1 protein (CG neurons) (supplemental Fig. 5A–C, available at www.jneurosci.org as supplemental material). The mitochondria in the cells of these animals have considerably (sod2+/−) or greatly (sod2−/−) reduced ability to convert mitochondrial-produced O2·− to H2O2 (Melov et al., 1999; Melov, 2004). O2·− and other ROS levels in SCG neurons having different bax/sod2 genotypes were determined by confocal imaging of neurons loaded with MitoSOX or CM-H2DCFDA. Decreasing sod2 gene dosage caused an increase of O2·− and other ROS in both NGF-deprived and -maintained bax+/+ SCG neurons (Fig. 3B). This increase was greatly reduced or eliminated in neurons having bax+/− or bax−/− genotypes. Decreasing sod2 gene dosage also caused an increase of O2·− and other ROS in nonapoptotic and apoptotic bax+/+ CG neurons (Fig. 4A,B). As with SCG neurons, CG neurons that had genetically reduced concentrations of Bax and SOD2 had lower levels of O2·− and other ROS than did bax+/+ CG neurons with reduced SOD2 concentrations.
Figure 4.

Production of O2·− and other ROS in apoptotic and nonapoptotic CG neurons were influenced by both Bax and SOD2 levels. A, Relative O2·− levels (MitoSOX intensities) and other ROS (CM-H2DCFDA intensities) in apoptotic CG neurons expressing different concentrations of Bax and SOD2. Medium was replaced with one lacking serum and containing 5 mm KCl for 6 h to induce apoptosis. B, Relative O2·− and other ROS levels in nonapoptotic CG neurons expressing different concentrations of Bax and SOD2. Medium contained serum and 25 mm KCl. Neurons were exposed to redox-sensitive dyes as described for CG neurons in Figures 1 and 2. MitoSOX and CM-H2DCFDA dye intensities are normalized to the intensity averages of sibling wild-type cultures not receiving apoptotic stimuli with 25 mm KCl plus serum. ■p > 0.01, conditions that are not statistically different within individual graphs. All other conditions within the graphs are different (p < 0.01). Animals with an sod2−/− genotype did not live long enough to allow CG cultures to be established from them. n = 125–993 neurons.
The MitoSOX data indicate that the mitochondria of many neurons with inhibited SOD1 activity or reduced SOD2 expression had elevated O2·− levels, presumably as a result of reduced dismutation of O2·− to H2O2. It is unclear why CM-H2DCFDA also showed increased oxidation in these neurons because it appears to be primarily oxidized by ROS downstream of O2·− and is relatively insensitive to oxidation by O2·− itself. It is possible that a longer dwell time for O2·− in cells with reduced SOD activity allowed increased opportunities for it to oxidize the dye or that pathways other than the SOD pathways converted O2·− to ROS that can oxidize CM-H2DCFDA (Halliwell and Gutteridge, 2007). Regardless of the answer, the combined data indicate that most of the mitochondrial-derived O2·− and other ROS produced in both apoptotic and nonapoptotic SCG and CG neurons is Bax dependent.
It should be noted that the higher ROS levels in “nonapoptotic” cultures containing more Bax than in ones with less Bax cannot be explained by high ROS levels in a small number of apoptotic cells in those cultures. Wild-type NGF-supported SCG and high potassium/serum-supported CG cultures of the age used in this study show no detectable apoptotic death (O'Hare et al., 2000; Deshmukh et al., 2002; Vaughn and Deshmukh, 2007). Supplemental Figure 4B (available at www.jneurosci.org as supplemental material) shows that there were no cells in either wild-type nonapoptotic cultures or in nonapoptotic cultures with varying genotypes that had the high ROS levels found in apoptotic cells. Rather, the lower average ROS levels in nonapoptotic neurons having reduced levels of Bax resulted from a decrease in basal ROS levels.
Caspases have a role in ROS production
To pursue mechanisms underlying the effects of Bax on O2·− production, we chose to use SCG rather than CG neurons because the role of Bax in ROS production is better characterized in them. There are several possible means by which Bax could influence mitochondrial O2·− production in apoptotic and nonapoptotic cells. First, Bax-induced depletion of cytochrome c from the electron transport chain could inhibit the flow of electrons through the respiratory complexes (Cai and Jones, 1998). Such inhibition could increase electron stalling upstream of cytochrome c in the chain and cause more electrons to leak to O2 to produce O2·− . This mechanism can be discounted in nonapoptotic cells because they retain cytochrome c within the mitochondrial intermembrane space. It can also probably be discounted in apoptotic neurons because we showed that ROS increases well before a substantial portion of cytochrome c is released from mitochondria, at least in SCG neurons (Kirkland et al., 2002). Second, bax+/+ neurons might produce more O2·− than do bax+/− or bax−/− cells because they have greater mitochondrial mass (Karbowski and Youle, 2003; Karbowski et al., 2006). However, Figure 5A shows that NGF-supported SCG neurons having each of the three bax genotypes had similar levels of cytochrome c, suggesting that they had similar mitochondrial masses. The mitochondria-specific dye MitoTracker Green can be used to obtain a comparative estimate of mitochondrial density/volume in different cells. Figure 5B shows that there were no differences in MitoTracker Green staining in bax+/+/sod2+/+, bax−/−/ sod2+/+, and bax−/−/sod2−/+ cells. This finding indicates equivalent mitochondrial volume in these representative genotypes. The findings shown in supplemental Figure 5A demonstrate that bax+/+ and bax−/− CG neurons express the same level of SOD2 protein, suggesting that these neurons also have equivalent mitochondrial volumes. A third possibility is that Bax influences Δψm. Higher Δψm (more hyperpolarized) can increase electron leakage from the chain and elevate O2·− production (Starkov et al., 2002). To determine whether Bax affects Δψm, we used the Δψm-sensitive dye TMRM+ (Nicholls and Budd, 2000; Nicholls and Ward, 2000; Nicholls and Ferguson, 2002). Figure 5C shows that Δψm was actually higher in NGF-supported or -deprived SCG bax+/− or bax−/− neurons than in bax+/+ cells, the opposite of what would be expected if Bax increased O2·− production via an effect on Δψm. The hyperpolarization caused by reduced bax gene dosage was not affected in cells having lower sod2 gene dosages. The mitochondrial complex I inhibitor rotenone and the complex III inhibitor antimycin A can increase mitochondrial ROS production by increasing leakage of electrons from the electron transport chain (Fiskum et al., 2000). To determine whether bax genotype affects the ability of these compounds to increase ROS production in SCG neurons, we exposed bax+/+ and bax−/− cells to either rotenone or antimycin A and determined ROS production with MitoSOX or CM-H2DCFDA. Supplemental Figure 6 (available at www.jneurosci.org as supplemental material) shows that neurons having either bax+/+ or bax−/− genotypes had equivalent abilities to increase ROS when exposed to these compounds. Therefore, although Bax deletion reduced both basal and apoptotic ROS levels in SCG neurons, it did not alter ROS production by mitochondria when the electron transport chain was artificially blocked.
Figure 5.
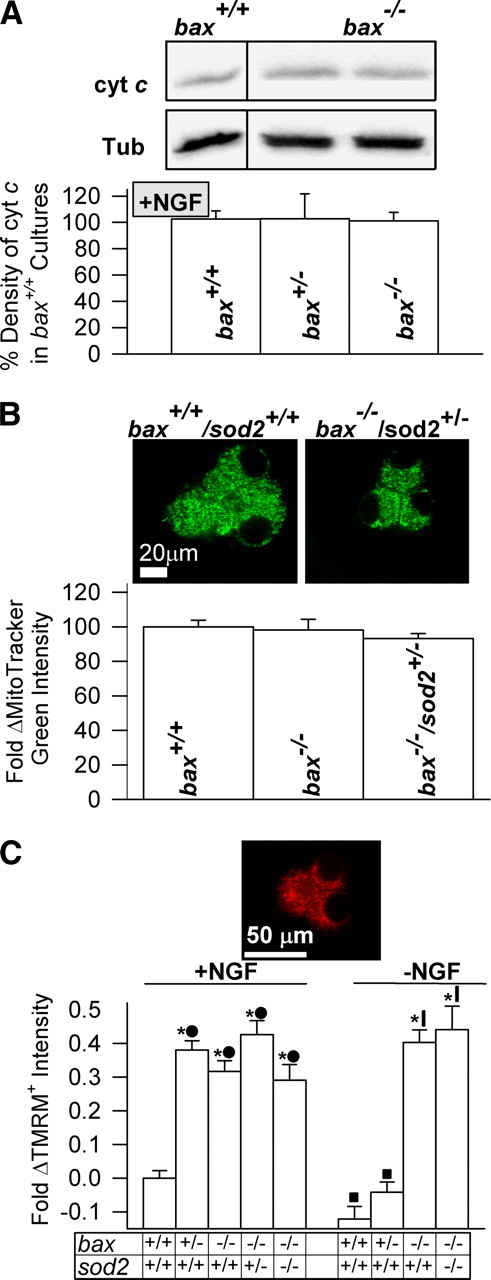
Alterations in mitochondrial mass or Δψm could not explain the effect of Bax concentration on O2·− levels in SCG neurons. A, NGF-maintained neurons with each of the three bax genotypes expressed identical levels (p > 0.1) of cytochrome c, suggesting that they had equal mitochondrial mass. Immunoblots at the top show cytochrome c (cyt c) and β tubulin III (Tub) from the same lanes of a gel. The bax+/+ and bax−/− blots are from the same gel. Bottom shows quantification of cytochrome c immunoblot band density for cultures having each of the three bax genotypes. Cytochrome c concentration (density of immunoblot bands) was normalized to amount of β tubulin III in the same lanes of the gels. n = 5–23 cultures. B, Top, somas of NGF-maintained bax+/+ and bax−/− SCG neurons stained with the mitochondria-specific dye MitoTracker Green. Graphs show quantification of MitoTracker Green staining in the somas of NGF-maintained SCG neurons having the indicated genotypes. There were no significant differences in the somatic staining intensities of the three genotypes (p > 0.1). These data denote that alterations in either bax or sod2 gene dosage did not affect mitochondrial mass in these cells. Data were normalized to the MitoTracker Green intensity measured in wild-type cells. n = 34–104 neurons. C, Reducing Bax protein levels increased Δψm. Top, Soma of NGF-supported bax+/+/sod2+/+ SCG neurons loaded with the Δψm indicator TMRM+ (10 nm for 20 min). Note punctate mitochondrial staining. Bottom, Quantification of TMRM+ staining in neurons having the indicated bax and sod2 genotypes. NGF-withdrawal decreased Δψm (TMRM+ staining) in bax+/+ cells. Both NGF-supported and -deprived neurons from bax+/− and bax−/− mice had hyperpolarized Δψm compared with neurons from bax+/+ mice receiving the same treatment. Reducing sod2 gene dosage had no effect on this hyperpolarization. TMRM+ dye intensities in SCG neurons are normalized to the intensity averages of wild-type cultures maintained in medium containing NGF from the time of plating. *p < 0.01, significantly different from wild-type. ■,●p > 0.01, conditions that were not significantly different from each other.
A fourth possibility for how Bax could influence mitochondrial ROS production is via activation of caspases. Most Bax resides in the cytoplasm of nonapoptotic cells. It inserts into the outer mitochondrial membrane (OMM) during apoptosis. This insertion causes permeabilization of the OMM and redistribution of cytochrome c into the cytoplasm in which it causes activation of caspases and subsequent cell death by inducing formation of the apoptosome (Li et al., 1997; Goldstein et al., 2000; Du et al., 2000; Adrain and Martin, 2001; Li et al., 2001; Suzuki et al., 2001; Danial and Korsmeyer, 2004; Lucken-Ardjomande et al., 2008; Qian et al., 2008). Bax deletion blocks the apoptotic death of NGF-deprived SCG neurons and repolarized/serum-starved CG neurons (Deckwerth et al., 1996; Miller et al., 1997). Permeabilization of the OMM during the apoptotic death of at least some cell types allows activated cytosolic caspase 3 to gain access to the mitochondrial intermembrane space in which it cleaves specific respiratory complex subunits, dissipating Δψm and increasing mitochondrial ROS production (Ricci et al., 2003, 2004).
The ROS increase that occurs in SCG, CG, and other types of neurons receiving apoptotic stimuli is greatly attenuated by caspase inhibitors, suggesting that some of the elevated ROS is caused by similar cleavage of respiratory complex subunits in those cells (Tan et al., 1998; Kirkland et al., 2001, 2002, 2007b). Figure 6A provides evidence that caspase cleavage of respiratory complexes may be responsible for at least some of the increased ROS during the apoptotic death of NGF-deprived SCG neurons. Cultures of NGF-deprived bax+/+ neurons were double labeled with CM-H2DCFDA and TMRM+. Figure 5C shows that, by 24 h after NGF withdrawal, average TMRM+ intensity had decreased below control intensity measured in NGF-replete bax+/+ cells. Conversely, average CM-H2DCFDA intensity increased throughout the period (Fig. 1A). Figure 6A shows a plot of the CM-H2DCFDA intensities in neurons as a function of the TMRM+ intensities measured in the same neurons at various times after NGF withdrawal. There was a wide range of CM-H2DCFDA intensities at most TMRM+ intensities. However, although CM-H2DCFDA intensities varied at any given TMRM+ intensity, the highest CM-H2DCFDA intensities occurred only in cells with the lowest TMRM+ intensities. By 18 h and later times after NGF withdrawal, all neurons with the highest ROS levels had the lowest (depolarized) Δψm. Treatment of NGF-deprived cultures with BAF reduced the average increase in CM-H2DCFDA intensities at all times after NGF withdrawal (Fig. 6B) (Deshmukh et al., 1996; Kirkland and Franklin, 2001; Kirkland et al., 2002). Investigation of the effect of BAF on ROS in single cells (Fig. 6B) revealed that this inhibitor attenuated increased ROS caused by NGF deprivation and blocked the highest ROS levels associated with the lowest Δψm. The ROS measured after NGF deprivation was potently suppressed by treatment with FCCP at a concentration that maximally reduces Δψm (supplemental Fig. 3A,B, available at www.jneurosci.org as supplemental material), suggesting that they derive from the mitochondrial electron transport chain. The large decrease in Δψm associated with the cells having the highest ROS levels suggests the possibility that respiratory complexes may have been damaged and that electrons were leaking from the transport chain to produce O2·− rather than traveling through the chain to pump proteins into the intermembrane space. The ability of FCCP to suppress ROS suggests that the low (partially depolarized) Δψm associated with the cells having the highest ROS levels was nevertheless necessary for ROS production. A role for caspase activity is supported by the BAF suppression of the ROS increase and BAF prevention of Δψm loss.
Figure 6.

The highest ROS levels in NGF-deprived bax+/+ SCG neurons were found in cells having the lowest Δψm and were suppressed by caspase inhibition. A, Relative ROS and Δψm levels (CM-H2DCFDA intensities and TMRM+ intensities, respectively) could be determined in single mouse SCG neurons in cell culture. Top, Confocal micrographs of NGF-maintained or -deprived bax+/+ SCG neuronal somas double labeled with CM-H2DCFDA (green, left) and TMRM+ (red, middle). Right panels show merged CM-H2DCFDA and TMRM+ staining. Higher TMRM+ intensity indicates more hyperpolarized Δψm, whereas higher CM-H2DCFDA intensity indicates elevated ROS. The NGF-maintained cell exhibits intense punctate TMRM+ staining and diffuse, low-intensity CM-H2DCFDA staining. One of the NGF-deprived cells exhibits low TMRM+ staining intensity but high CM-H2DCFDA intensity, indicating that this cell had elevated ROS levels but depolarized Δψm. Bottom, ROS levels (CM-H2DCFDA intensity) in neurons as a function of Δψm (TMRM+ intensity) in the same cells. All neurons with the highest CM-H2DCFDA intensities had the lowest TMRM+ intensities. Neurons were deprived of NGF for 18–30 h before loading with dyes in culture medium in the incubator (10 nm TMRM+ and 10 μm CM-H2DCFDA for 20 min). This was followed by washing two times with L-15 medium containing 10 nm TMRM+; cells were left in the last wash for microscopy. Changes in dye intensity are shown as change from average values in NGF-maintained cultures. Bins are divided into 0.2-fold change of TMRM+ intensities. The amplitude of each bin represents the average CM-H2DCFDA intensity of neurons within a particular range of TMRM+ intensities. * indicate significantly different from the other bins within the individual graphs. p < 0.01; n = 137–263 neurons. B, The broad-spectrum caspase inhibitor BAF (50 μm) attenuated the elevated ROS levels after NGF withdrawal. Left, BAF decreased the average ROS (CM-H2DCFDA intensity) after NGF withdrawal. Right, The plots show that the average decrease in ROS caused by BAF in NGF-deprived cells resulted from both a decrease in the number of NGF-deprived neurons having the greatest elevation of ROS and a decrease of ROS in many other neurons as well. Bins represent percentage of total number of cells (100%) having the indicated average increase in CM-H2DCFDA intensity at the indicated times. Each bin represents a onefold intensity change (e.g., 10–11 is the percentage of total neurons showing a 10-fold to 11-fold change of CM-H2DCFDA intensities). BAF treatment began at the time of deprivation. n = 112–372 cells.
Recent reports demonstrate that nonapoptotic cells can have constitutive low-level caspase activity and that caspases have physiological functions beyond their role in apoptotic cell death (Yousefi et al., 2003; He et al., 2004; Nhan et al., 2006; Gdynia et al., 2007; Li et al., 2010). Because of the dependency of O2·− production on Bax in both apoptotic and nonapoptotic SCG and CG (Desagher et al., 1999) neurons and because there is a considerable amount of Bax associated with the mitochondria of both nonapoptotic cell types (Desagher et al., 1999; Putcha et al., 2000), we speculated that caspases might mediate the pro-oxidant effect of Bax in nonapoptotic neurons. We hypothesized that the Bax associated with mitochondria in nonapoptotic neurons causes enough permeabilization of the OMM to allow active caspases access into the mitochondrial intermembrane space in which they cause a continuous, low-level degradation of respiratory complexes, thereby increasing O2·− production. Because of its importance in the apoptotic death of NGF-deprived SCG neurons and because of its role in increasing mitochondrial ROS production during apoptosis in other cell types, we explored a possible role for caspase 3 in ROS production in nonapoptotic SCG neurons (Ricci et al., 2003, 2004; Wright et al., 2007). Figure 7A shows that there was basal caspase 3 activity in wild-type NGF-supported SCG neurons and that it was suppressed by BAF. Increased caspase 3 activity after NGF withdrawal was also potently suppressed by BAF. Both NGF-supported bax+/− and bax−/− neurons had BAF-suppressible caspase 3 activity levels comparable with those in wild-type cells. This finding indicates that the Bax level did not directly affect basal caspase 3 activity. Should a slow, continuous degradation of respiratory complexes by caspases underlie basal mitochondrial O2·− production in NGF-supported cells, then long-term application of BAF should suppress basal O2·− levels in them. Figure 7B shows that BAF did not suppress O2·− levels in NGF-supported bax+/+ cells when applied acutely; however, it did suppress mitochondrial O2·− production in these cells when they were exposed to it for 6 h (Fig. 7B). These data are consistent with basal caspase activity being involved in the generation of O2·− in nonapoptotic SCG neurons.
Figure 7.

BAF suppressed caspase 3 activity and O2·− levels in both apoptotic and nonapoptotic SCG neurons. A, Caspase 3 activity in SCG neurons determined by the Caspase Glo 3/7 assay. Left, BAF (50 μm for 24 h) potently suppressed caspase 3 activity in NGF-supported or -deprived (24 h) bax+/+ neurons. Data were normalized to the average activity measured in the NGF-supported cells (control) without BAF treatment. Right, BAF caused a similar level of suppression of caspase 3 activity in NGF-supported cells with bax+/− and bax−/− genotypes, suggesting that all three bax genotypes had equivalent levels of active caspase 3. Data were normalized to the activity in NGF-supported sibling cultures of the same genotype without BAF. n = 6–12 cultures. ■p > 0.01, conditions that are not statistically different. *p < 0.01, significant difference from NGF-supported bax+/+ neurons. There were no statistical differences in the basal caspase activities of the three bax genotypes (p > 0.01; all had the same plating density). B, Long-term, but not acute, BAF (50 μm) treatment suppressed MitoSOX staining in NGF-supported bax+/+ SCG neurons. MitoSOX intensities are normalized to the intensity averages of sibling wild-type cultures not receiving apoptotic stimuli (with NGF from time of plating). n = 153–233 neurons. *p < 0.01 compared with NGF-supported bax+/+ cells with no BAF.
To explore a possible role for caspases in Bax-mediated ROS production in nonapoptotic SCG neurons, we used digitonin to introduce active caspase 3 or a Bcl-2 homology 3 (BH3)-containing protein (a truncated form of Bax) into their cytoplasm (Fiskum et al., 1980, 2000). Digitonin dissolves cholesterol from the plasma membrane, permeabilizing it and allowing large molecules to be introduced into the cytoplasm of cells. Because mitochondria and intracellular membranes contain little cholesterol, optimal concentrations of digitonin can permeabilize the plasma membrane without damaging mitochondria and other cellular organelles. Figure 8A shows that treatment of NGF-supported SCG neurons with an intracellular buffer containing 5 μg/ml digitonin allowed entry of 70 kDa rhodamine-labeled dextran into the cytoplasm of most SCG neurons within 20 min of exposure. Digitonin permeabilization of cells in buffer containing complex I substrates and ADP (see Materials and Methods) had little effect on Δψm (Fig. 8B), indicating that the IMM was not disrupted and that the mitochondria remained energized at a level nearly equivalent to that in the nonpermeabilized cells. The permeabilization also did not cause release of cytochrome c from the intermembrane space, indicating that the OMM remained intact as well (Fig. 8C).
Figure 8.

Digitonin permeabilized the plasma membrane of SCG neurons with little effect on mitochondrial physiology. A, Treatment of SCG neurons in culture with digitonin (5 μg/ml) allowed large molecules to enter the cytoplasm. Top left, Confocal images of NGF-maintained neuronal somas exposed for 20 min to intracellular medium containing polydextran (70 kDa) labeled with the fluorescent dye rhodamine [100 μg/ml dextran/rhodamine (Rhod-Dex)]. No rhodamine labeling occurred in the six neuronal somas shown (●), indicating that the dextran/dye molecules could not cross the plasma membrane. Top right, Confocal images of eight NGF-maintained neuronal somas exposed for 20 min to intracellular media containing rhodamine-labeled polydextran (70 kDa; 100 μg/ml) and digitonin (5 μg/ml). Rhodamine labeling occurred in seven (+) of the eight somas, indicating that the dextran/dye combination had crossed the plasma membrane. Bottom, Time course of increase in somatic rhodamine/dextran (70 kDa; 100 μg/ml) intensity in NGF-maintained neurons exposed to digitonin (5 μg/ml) for 20 min. Data are normalized to the average cellular autofluorescence intensities measured in NGF-maintained cells exposed to intracellular media containing rhodamine/dextran but not receiving digitonin treatment. Note in the micrographs of the nonpermeabilized cells that the autofluorescence intensity was very weak. The average increased intensity reflects both an increase in the number of cells staining and an increase in individual cell intensity. Cells were excited by a 488 nm laser line, and emission was in the red channel of the confocal microscope. n = 15 neurons for each time point. B, Digitonin (Dig) treatment had little effect on Δψm. Top, Confocal micrograph of NGF-maintained neurons exposed to TMRM+ (10 nm for 20 min at 35°C) after digitonin permeabilization (5 μg/ml for 20 min in intracellular medium containing complex I substrates and ADP). Digitonin was washed out twice with the same intracellular medium not containing digitonin and TMRM+. Note punctuate mitochondrial staining. Bottom, Average TMRM+ intensities in NGF-replete cells exposed to either TMRM+ during digitonin loading (second bar) or TMRM+ after load as described for the micrograph (p > 0.01 for with NGF compared with plus NGF and digitonin; p < 0.01 for the postloaded cells compared with either of the other two conditions). TMRM+ dye intensities are normalized to the intensity averages of sibling wild-type cultures not receiving apoptotic stimuli (with NGF from time of plating; first bar). n = 193–395 neurons. C, Digitonin treatment did not cause cytochrome c (Cyto c) to be released from mitochondria. Top, Fluorescent micrograph of NGF-deprived (24 h) neurons demonstrating the criteria used to score cytochrome c localization by immunocytochemistry. Note the intense punctate staining in the top cell and the faint staining in the bottom one. The intensely stained neuron is representative of cells that were scored as having retained cytochrome c in mitochondria. The other neuron is representative of cells scored as having released cytochrome c into the cytoplasm in which it appears to be rapidly degraded (Deshmukh and Johnson, 1998; Kirkland and Franklin, 2001; Kirkland et al., 2002, 2007b). Bottom, Twenty minutes of digitonin (5 μg/ml) treatment before fixation did not alter the number of cells scored as having retained cytochrome c in their mitochondria. Digitonin did not affect cytochrome c retention in cells either maintained in or deprived of NGF (24 h; p > 0.01 for both). n = 3–4 cultures with ∼50 cells scored in each. ■ and ● identify conditions that were not statistically different (p > 0.01). All other conditions were different (p < 0.01).
Figure 9A shows that introduction of active caspase 3 (0.5 nm but not 0.1 nm) into the cytoplasm of NGF-supported bax+/+ SCG neurons caused an ∼0.9-fold increase in MitoSOX intensity, indicating that it augmented O2·− production. This increase was completely suppressible by BAF and FCCP, suggesting that it was mediated by the caspase 3 activity and that the O2·− detected by the MitoSOX derived from the mitochondrial electron transport chain. Addition of a BH3-containing protein (Bax, 38-171 amino acids; lacking both the N-terminal signal sequence and the C-terminal transmembrane domain) (Priault et al., 2003; Valentijn et al., 2008) caused an increase in MitoSOX intensity equivalent to that of the caspase 3 alone. This increase was both BAF and FCCP suppressible as well, suggesting that caspase activity was required for the O2·− rise and that the O2·− detected derived from the electron transport chain. Immunostaining for cytochrome c showed that addition of the truncated Bax caused clear release of cytochrome c in 83 ± 2% of bax+/+-permeabilized neurons but only in 25 ± 2% of bax−/−-permeabilized cells (supplemental Fig. 7, available at www.jneurosci.org as supplemental material). Immunostaining for caspase 3 revealed that all digitonin-permeabilized cells retained some caspase 3 in their cytoplasm (Fig. 9A). Addition of active caspase 3 and Bax together caused an additional increase in MitoSOX intensity (p < 0.01 compared with caspase 3 or Bax addition alone). The same set of experiments was done with digitonin-permeabilized and NGF-supported SCG neurons from bax−/− animals (Fig. 9B). Addition of caspase 3 had no significant effect on MitoSOX intensity in these cells (p > 0.01). The truncated Bax alone or truncated Bax and caspase 3 added together did not significantly increase MitoSOX intensity.
Figure 9.
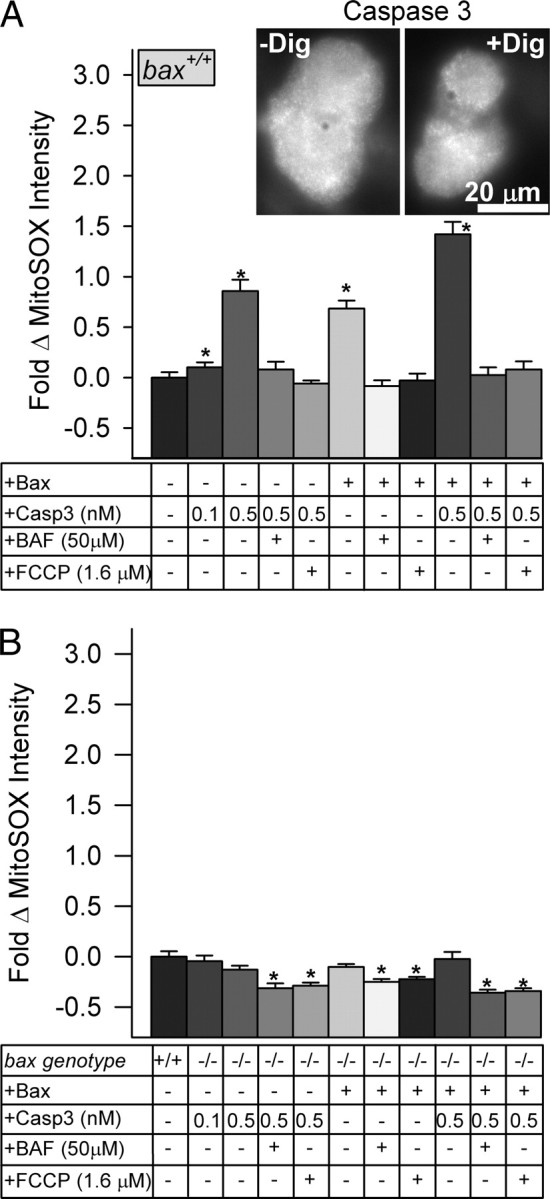
Both Bax and caspase 3 were required to increase O2·− production in NGF-maintained SCG neurons permeabilized by digitonin. A, Addition of active caspase 3 (0.5 nm), truncated Bax (amino acids 38–171; 100 nm), or both to NGF-maintained bax+/+ SCG neurons that had been permeabilized by digitonin (Dig) (5 μg/ml) significantly increased O2·− levels in them. In each case, this increase was suppressed to near baseline levels by BAF or FCCP (50 and 1.6 μm, respectively). * p < 0.01, significantly different from control (bar 1). All MitoSOX intensities in BAF- and FCCP-treated cells were significantly lower than intensities in neurons receiving the same treatment without the compounds (p < 0.01). n = 70–465 neurons. Inset shows immunostaining for caspase 3 in SCG neurons before and after digitonin exposure, indicating that a pool of caspase 3 remains in these cells after permeabilization. One hundred percent of neurons exhibited caspase 3 immunostaining both before and after permeabilization (n = 150–200 neurons). The secondary antibody did not stain cells (data not shown). B, Addition of neither Bax (amino acids 38–171; 100 nm) nor active caspase 3 or both caused increased O2·− levels in NGF-supported bax−/− cells (p > 0.1 compared with control; bar 1). *p < 0.03, MitoSOX intensities in BAF- and FCCP-treated cells were significantly lower than intensities in neurons receiving the same treatment without the compounds. n = 58–623 neurons. Neurons were permeabilized by exposure for 20 min to 5 μg/ml digitonin in intracellular buffer containing substrates, MitoSOX (2 μm), and the experimental treatments. MitoSOX dye intensities are normalized to the intensity averages of digitonin-permeabilized sibling wild-type cultures (with NGF from time of plating) not exposed to the experimental treatments. Addition of the TCA cycle substrates malate/glutamate to digitonin-permeabilized SCG neurons (supplemental Fig. 8, available at www.jneurosci.org as supplemental material) greatly increased O2·− production in NGF-deprived cells but had little effect on the NGF-supported ones.
Our combined findings suggest that Bax and caspases act together to increase mitochondrial O2·− production in both NGF-maintained and -deprived SCG neurons. However, the data do not demonstrate a role for caspase 3 in O2·− production in the cells under normal circumstances, only that caspase 3 can increase O2·− production when Bax is present. To definitively test whether caspase 3 activity is required for mitochondrial O2·− production in NGF-supported or -deprived SCG neurons, we cultured neurons from mice with genetically altered levels of caspase 3. Figure 10A shows that casp3 deletion slightly decreased O2·− production in NGF-supported cells, suggesting a role for this caspase in basal O2·− production in these neurons. Figure 10B shows that NGF-deprived casp3+/− cells had reduced O2·− levels compared with casp3+/+ neurons. Rate of cytochrome c release in these cells was the same as in casp3+/+ neurons (data not shown). There was little increase in O2·− production in NGF-deprived casp3−/− cells. Therefore, caspase 3 was required for most of the increased Bax-dependent mitochondrial O2·− production after NGF withdrawal. It was also required for some of the ongoing Bax-dependent O2·− production in neurons not receiving the apoptotic stimulus. However, the decrease in O2·− production in the nonapoptotic casp3−/− cells was considerably less than that caused by bax deletion (Fig. 2), indicating that caspase 3 alone could not account for all of the effects of Bax on O2·− production in them.
Figure 10.
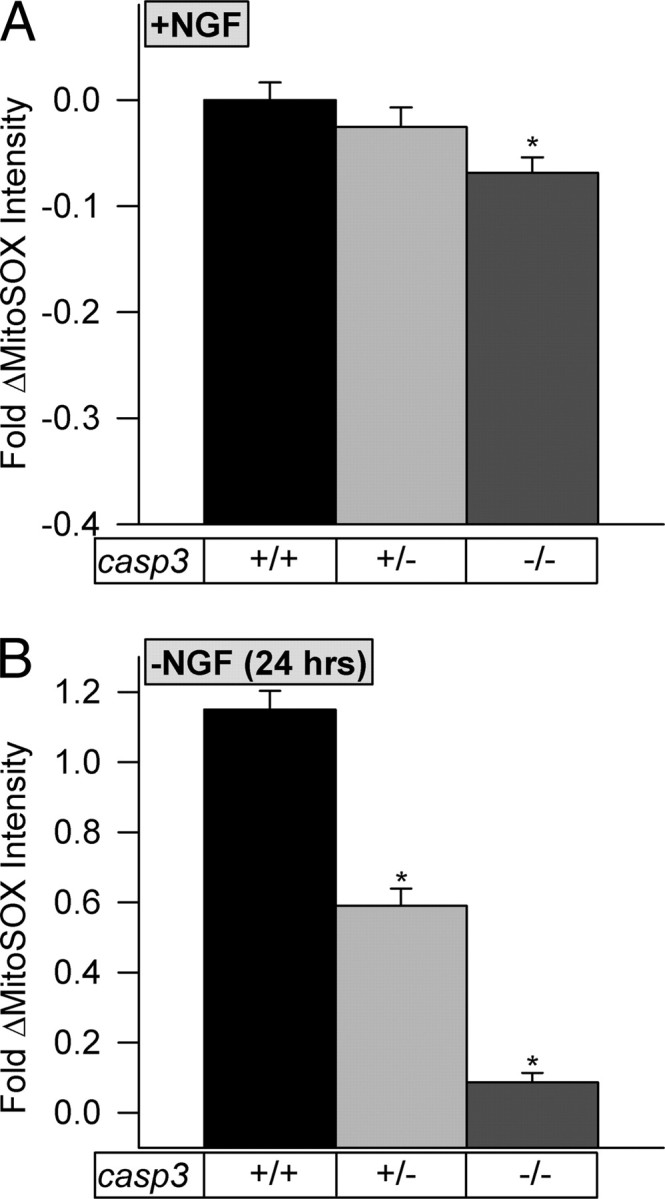
O2·− levels were lower in NGF-deprived and -maintained SCG neurons lacking caspase 3. A, Genetic deletion of caspase 3 slightly, but significantly, reduced O2·− levels in NGF-supported casp3−/− SCG neurons. n = 234–559 neurons. B, Genetic reduction or deletion of caspase 3 significantly lowered O2·− levels in NGF-deprived casp3+/− and casp3−/− neurons. Cytochrome c was released over the same time course in the casp3−/− neurons as in wild type (data not shown). n = 182–559 neurons. MitoSOX dye intensities are normalized to the intensity averages of sibling wild-type cultures (with NGF from time of plating). *p < 0.01 compared with casp3+/+.
Discussion
Hockenbery et al. (1993) were the first to demonstrate an effect of Bcl-2 family proteins on cellular oxidative stress when they showed that Bcl-2 has antioxidant activity in cells. Several other groups subsequently reported that different members of the Bcl-2 family can have either antioxidant or pro-oxidant effects (Kowaltowski et al., 2000; Kowaltowski and Fiskum, 2005; Chen and Pervaiz, 2007). We showed that the proapoptotic Bcl-2 family member Bax lies upstream of increased mitochondrial ROS production occurring during the apoptotic death of NGF-deprived SCG and repolarized/serum-starved CG neurons in cell culture (Kirkland et al., 2002). Here we report on an investigation into the mechanisms underlying this phenomenon. During this investigation, we discovered that Bax also lies upstream of most O2·− and other ROS produced in nonapoptotic neurons.
We first used the redox-sensitive dyes MitoSOX and CM-H2DCFDA to perform a confocal microscopic analysis of O2·− and other ROS in SCG and CG neurons expressing different concentrations of Bax. Bax protein concentration in both cells types was varied by breeding mice expressing different bax gene dosages. The increased levels of MitoSOX-detected O2·− and CM-H2DCFDA-detected ROS that occurs in these cells after exposure to an apoptotic stimulus were reduced in neurons having lower Bax concentrations and were nearly abrogated in neurons lacking Bax. Reduction of Bax concentration also decreased O2·− and other ROS in cells not receiving apoptotic stimuli. Because the actual degree of the Bax effect on production of O2·− and other ROS might be masked as a result of the activity of SOD enzymes, we chemically blocked cytosolic SOD1 activity and genetically reduced or eliminated mitochondrial SOD2 activity. Reduction of the activity of either SOD caused an increase in O2·− and other ROS in apoptotic and nonapoptotic bax+/+ cells, whereas there was little effect in bax−/− neurons. These data suggest that almost all O2·− and other ROS produced in both SCG and CG neurons lie downstream of Bax, making this protein a major cellular pro-oxidant in both apoptotic and nonapoptotic cells.
Mechanisms underlying the pro-oxidant effect of Bax
To investigate mechanisms underlying the effects of Bax on neuronal O2·− production, we focused on the SCG paradigm. One possible mechanism by which Bax could elevate mitochondrial O2·− production is by increasing mitochondrial mass. However, there were no differences in mitochondrial mass in cells having different bax or sod2 genotypes. Another possible mechanism that might have underlain the elevated levels of mitochondrial O2·− production in cells with higher Bax concentrations was hyperpolarization of Δψm (Starkov et al., 2002). However, Δψm was actually greater in both apoptotic and nonapoptotic SCG neurons that had lower Bax levels.
The increased ROS in apoptotic HeLa cells lie downstream of caspase activity (Ricci et al., 2003, 2004). Caspases activated by Bax-induced cytochrome c released from mitochondria apparently gain access to the mitochondrial intermembrane space after OMM permeabilization in which they cleave the NDUFS1 subunit of the first respiratory complex (Ricci et al., 2003, 2004). This cleavage augments leakage of electrons from the electron transport chain to O2 to form O2·− . We found that NGF-deprived SCG neurons that had the largest ROS increase also had the lowest (most depolarized) Δψm. This finding is consistent with a role for activated caspases causing elevated ROS levels via cleavage of respiratory complex components and subsequent increased leakage of electrons from the transport chain. Also consistent with a role for caspase activity in production of O2·− , the broad-spectrum caspase inhibitor BAF suppressed the elevated O2·− and ROS downstream of O2·− in apoptotic SCG neurons (Kirkland et al., 2007b). Using a caspase 3 activity assay, we found that caspase 3 activity increased in these neurons after NGF withdrawal and that BAF blocked this increase (Wright et al., 2007). There was little increase in O2·− production in NGF-deprived neurons derived from caspase 3 null animals. Together, the data indicate that caspase 3 is necessary for increased O2·− and downstream ROS during the apoptotic death of NGF-deprived SCG neurons.
To explore the roles of Bax and caspases in mitochondrial O2·− production in nonapoptotic SCG neurons, we first treated digitonin-permeabilized cells with active caspase 3. Permeabilization of the plasma membrane with digitonin did not significantly alter Δψm or cause cytochrome c redistribution, indicating that the mitochondria in these cells remained intact and energized. Exposing permeabilized bax+/+ cells to caspase 3 caused a large increase in O2·− production. In bax−/− cells, this treatment had no effect. When a truncated form of Bax (amino acids 38-171) that essentially acts like a BH3-only protein was introduced into the bax−/− neurons along with active caspase 3, O2·− production did not increase. This was likely attributable to the inability of truncated Bax to effectively permeabilize the mitochondrial outer membrane in the absence of endogenous Bax and, thus, enable caspase-3 to access the intermembrane space.
Although the data do not directly address the mechanism by which Bax and caspase 3 coordinated their activities to increase O2·− production in nonapoptotic neurons, the most parsimonious explanation is that Bax allowed the caspase 3 access to the mitochondrial intermembrane space in which it cleaved respiratory complexes, causing increased electron leakage and augmented O2·− production. There was a low level of caspase 3 activity in nonapoptotic SCG neurons, but deletion of caspase 3 had only a small suppressive effect on basal O2·− production in them. This finding suggests that caspase 3 activity was only partially responsible for the effect of Bax on basal O2·− production in nonapoptotic cells. Long-term treatment with BAF suppressed the O2·− in nonapoptotic SCG neurons to a greater extent than did caspase 3 deletion, suggesting that caspases in addition to caspase 3 were involved in basal mitochondrial O2·− production in these cells.
Little is known about how production of O2·− by mitochondria, particularly in nonapoptotic cells, may be regulated. The data we report here suggest that Bax lies upstream of most mitochondrial O2·− production in both apoptotic and nonapoptotic SCG and CG neurons. Although most Bax appears to reside in the cytoplasm of healthy cells, a considerable amount is associated with the mitochondria of many nonapoptotic cells, including SCG (Putcha et al., 2000), CG (Desagher et al., 1999), and cortical (Lesuisse and Martin, 2002; Shou et al., 2003) neurons. It seems likely that it is this pool of Bax that exerts the pro-oxidant effect in nonapoptotic neurons reported here. Inducible BH3-only proteins such as Bim can activate Bax during apoptotic death by neutralizing Bax prosurvival relatives or by directly binding to Bax (Green, 2006; Mérino et al., 2009). The BH3-only protein PUMA (p53-upregulated modulator of apoptosis) was shown recently to be a dominant regulator of Bax activation by oxidative stress in cortical neurons (Steckley et al., 2007). Bax can also be transcriptionally regulated (Bouvard et al., 2000). Whether these mechanisms function to alter Bax targeting or concentration within nonapoptotic cells remains to be determined.
Bax is significantly downregulated in the adult rat and mouse brains compared with the newborn brains (Vekrellis et al., 1997; Krajewska et al., 2002; Polster et al., 2003). Although there is considerably less Bax in the adult mouse brain, we have found that detectable amounts do remain (up to 24 months postnatal; data not shown). Several reports indicate that the Bax in the adult rodent nervous system remains functional and can contribute to neuropathologies (Cao et al., 2001; Vila et al., 2001). It is also involved in the naturally occurring programmed death of adult-generated mouse hippocampal neurons (Sun et al., 2004). Bax is upregulated in Alzheimer's disease brains (Su et al., 1997). Oxidative stress is thought to contribute to the tissue damage occurring in many neuropathologies, including Alzheimer's disease (Pratico et al., 2001; Sherer et al., 2003; Lin and Beal, 2006; Keeney et al., 2006; Abramov et al., 2007; Halliwell and Gutteridge, 2007). It is possible that the pro-oxidant effect of Bax, in addition to or as part of its apoptotic function, contributes to these pathologies. Bax is also widely distributed in many non-neuronal tissues in which it is implicated in various pathologies (Bouvard et al., 2000; Hochhauser et al., 2003; Ben-Ari et al., 2007). Therefore, elucidation of the mechanisms by which Bax regulates neuronal O2·− production may contribute to understanding not only neuropathologies but pathologies in many other tissues as well.
In conclusion, we show that Bax lies upstream of production of almost all neuronal O2·− and ROS downstream of O2·− in both apoptotic and nonapoptotic SCG and CG neurons in cell culture. We also demonstrate that caspase 3 is necessary for most of the effect of Bax on O2·− production in apoptotic SCG neurons but that it is much less important for O2·− production in nonapoptotic SCG neurons. However, our data also suggest that caspases other than caspase 3 are involved in the pro-oxidant effect of Bax on nonapoptotic cells.
Footnotes
This work was supported by National Institutes of Health Grant NS37110. We thank Kyndra Stovall for her insightful comments.
References
- Abramov AY, Scorziello A, Duchen MR. Three distinct mechanisms generate oxygen free radicals in neurons and contribute to cell death during anoxia and reoxygenation. J Neurosci. 2007;27:1129–1138. doi: 10.1523/JNEUROSCI.4468-06.2007. [DOI] [PMC free article] [PubMed] [Google Scholar]
- Adrain C, Martin SJ. The mitochondrial apoptosome: a killer unleashed by the cytochrome seas. Trends Biochem Sci. 2001;26:390–397. doi: 10.1016/s0968-0004(01)01844-8. [DOI] [PubMed] [Google Scholar]
- Andreyev AY, Kushnareva YE, Starkov AA. Mitochondrial metabolism of reactive oxygen species. Biochemistry (Mosc) 2005;70:200–214. doi: 10.1007/s10541-005-0102-7. [DOI] [PubMed] [Google Scholar]
- Barja G. Free radicals and aging. Trends Neurosci. 2004;27:595–600. doi: 10.1016/j.tins.2004.07.005. [DOI] [PubMed] [Google Scholar]
- Ben-Ari Z, Pappo O, Cheporko Y, Yasovich N, Offen D, Shainberg A, Leshem D, Sulkes J, Vidne BA, Hochhauser E. Bax ablation protects against hepatic ischemia/reperfusion injury in transgenic mice. Liver Transpl. 2007;13:1181–1188. doi: 10.1002/lt.21221. [DOI] [PubMed] [Google Scholar]
- Bouvard V, Zaitchouk T, Vacher M, Duthu A, Canivet M, Choisy-Rossi C, Nieruchalski M, May E. Tissue and cell-specific expression of the p53-target genes: bax, fas, mdm2, and waf1/p21, before and following ionizing irradiation in mice. Oncogene. 2000;19:649–660. doi: 10.1038/sj.onc.1203366. [DOI] [PubMed] [Google Scholar]
- Cai J, Jones DP. Superoxide in apoptosis: mitochondrial generation triggered by cytochrome c loss. J Biol Chem. 1998;273:11401–11404. doi: 10.1074/jbc.273.19.11401. [DOI] [PubMed] [Google Scholar]
- Cao G, Minami M, Pei W, Yan C, Chen D, O'Horo C, Graham SH, Chen J. Intracellular Bax translocation after transient cerebral ischemia: implications for a role of the mitochondrial apoptotic signaling pathway in ischemic neuronal death. J Cereb Blood Flow Metab. 2001;21:321–333. doi: 10.1097/00004647-200104000-00001. [DOI] [PubMed] [Google Scholar]
- Chen ZX, Pervaiz S. Bcl-2 induces pro-oxidant state by engaging mitochondrial respiration in tumor cells. Cell Death Differ. 2007;14:1617–1627. doi: 10.1038/sj.cdd.4402165. [DOI] [PubMed] [Google Scholar]
- Danial NN, Korsmeyer SJ. Cell death: critical control points. Cell. 2004;116:205–219. doi: 10.1016/s0092-8674(04)00046-7. [DOI] [PubMed] [Google Scholar]
- Deckwerth TL, Johnson EM., Jr Temporal analysis of events associated with programmed cell death (apoptosis) of sympathetic neurons deprived of nerve growth factor. J Cell Biol. 1993;123:1207–1222. doi: 10.1083/jcb.123.5.1207. [DOI] [PMC free article] [PubMed] [Google Scholar]
- Deckwerth TL, Elliott JL, Knudson CM, Johnson EM, Jr, Snider WD, Korsmeyer SJ. Bax is required for neuronal death after trophic factor deprivation and during development. Neuron. 1996;17:401–411. doi: 10.1016/s0896-6273(00)80173-7. [DOI] [PubMed] [Google Scholar]
- Desagher S, Osen-Sand A, Nichols A, Eskes R, Montessuit S, Lauper S, Maundrell K, Antonsson B, Martinou JC. Bid-induced conformational change of Bax is responsible for mitochondrial cytochrome c release during apoptosis. J Cell Biol. 1999;144:891–901. doi: 10.1083/jcb.144.5.891. [DOI] [PMC free article] [PubMed] [Google Scholar]
- Deshmukh M, Johnson EM., Jr Evidence of a novel event during neuronal death: development of competence-to-die in response to cytoplasmic cytochrome c. Neuron. 1998;21:695–705. doi: 10.1016/s0896-6273(00)80587-5. [DOI] [PubMed] [Google Scholar]
- Deshmukh M, Vasilakos J, Deckwerth TL, Lampe PA, Shivers BD, Johnson EM., Jr Genetic and metabolic status of NGF-deprived sympathetic neurons saved by an inhibitor of ICE-family proteases. J Cell Biol. 1996;135:1341–1354. doi: 10.1083/jcb.135.5.1341. [DOI] [PMC free article] [PubMed] [Google Scholar]
- Deshmukh M, Du C, Wang X, Johnson EM., Jr Exogenous Smac induces competence and permits caspase activation in sympathetic neurons. J Neurosci. 2002;22:8018–8027. doi: 10.1523/JNEUROSCI.22-18-08018.2002. [DOI] [PMC free article] [PubMed] [Google Scholar]
- Du C, Fang M, Li Y, Li L, Wang X. Smac, a mitochondrial protein that promotes cytochrome-c dependent caspase activation by eliminating IAP inhibition. Cell. 2000;102:33–42. doi: 10.1016/s0092-8674(00)00008-8. [DOI] [PubMed] [Google Scholar]
- Dugan LL, Creedon DJ, Johnson EM, Jr, Holtzman DM. Rapid suppression of free radical formation by nerve growth factor involves the mitogen-activated protein kinase pathway. Proc Natl Acad Sci U S A. 1997;94:4086–4091. doi: 10.1073/pnas.94.8.4086. [DOI] [PMC free article] [PubMed] [Google Scholar]
- Fiskum G, Craig SW, Decker GL, Lehninger AL. The cytoskeleton of digitonin-treated rat hepatocytes. Proc Natl Acad Sci U S A. 1980;77:3430–3434. doi: 10.1073/pnas.77.6.3430. [DOI] [PMC free article] [PubMed] [Google Scholar]
- Fiskum G, Kowaltowksi AJ, Andreyev AY, Kushnareva YE, Starkov AA. Apoptosis-related activities measured with isolated mitochondria and digitonin-permeabilized cells. Methods Enzymol. 2000;322:222–234. doi: 10.1016/s0076-6879(00)22023-5. [DOI] [PubMed] [Google Scholar]
- Franklin JL, Sanz-Rodriguez C, Juhasz A, Deckwerth TL, Johnson EM., Jr Chronic depolarization prevents programmed death of sympathetic neurons in vitro but does not support growth: requirement for Ca2+ influx but not Trk activation. J Neurosci. 1995;15:643–664. doi: 10.1523/JNEUROSCI.15-01-00643.1995. [DOI] [PMC free article] [PubMed] [Google Scholar]
- Goldstein JC, Waterhouse NJ, Juin P, Evan GI, Green DR. The coordinate release of cytochrome c during apoptosis is rapid, complete and kinetically invariant. Nat Cell Biol. 2000;2:156–162. doi: 10.1038/35004029. [DOI] [PubMed] [Google Scholar]
- Green DR. At the gates of death. Cancer Cell. 2006;9:328–330. doi: 10.1016/j.ccr.2006.05.004. [DOI] [PubMed] [Google Scholar]
- Gdynia G, Grund K, Eckert A, Böck BC, Funke B, Macher-Goeppinger S, Sieber S, Herold-Mende C, Wiestler B, Wiestler OD, Roth W. Basal caspase activity promotes migration and invasiveness in glioblastoma cells. Mol Cancer Res. 2007;5:1232–1240. doi: 10.1158/1541-7786.MCR-07-0343. [DOI] [PubMed] [Google Scholar]
- Halliwell B, Gutteridge JMC. Free radicals in biology and medicine. Ed 4. Oxford: Oxford UP; 2007. [Google Scholar]
- He L, Wu X, Meylan F, Olson DP, Simone J, Hewgill D, Siegel R, Lipsky PE. Monitoring caspase activity in living cells using fluorescent proteins and flow cytometry. Am J Pathol. 2004;164:1901–1913. doi: 10.1016/S0002-9440(10)63751-0. [DOI] [PMC free article] [PubMed] [Google Scholar]
- Hochhauser E, Kivity S, Offen D, Maulik N, Otani H, Barhum Y, Pannet H, Shneyvays V, Shainberg A, Goldshtaub V, Tobar A, Vidne BA. Bax ablation protects against myocardial ischemia-reperfusion injury in transgenic mice. Am J Physiol Circ Physiol. 2003;284:H2351–H2359. doi: 10.1152/ajpheart.00783.2002. [DOI] [PubMed] [Google Scholar]
- Hockenbery DM, Oltvai ZN, Yin XM, Milliman CL, Korsmeyer SJ. Bcl-2 functions in an antioxidant pathway to prevent apoptosis. Cell. 1993;75:241–251. doi: 10.1016/0092-8674(93)80066-n. [DOI] [PubMed] [Google Scholar]
- Johnson-Cadwell LI, Jekabsons MB, Wang A, Polster BM, Nicholls DG. “Mild uncoupling” does not decrease mitochondrial superoxide levels in cultured cerebellar granule neurons but decreases spare respiratory capacity and increases toxicity to glutamate and oxidative stress. J Neurochem. 2007;101:1619–1631. doi: 10.1111/j.1471-4159.2007.04516.x. [DOI] [PubMed] [Google Scholar]
- Karbowski M, Youle RJ. Dynamics of mitochondrial morphology in healthy cells during apoptosis. Cell Death Differ. 2003;10:870–880. doi: 10.1038/sj.cdd.4401260. [DOI] [PubMed] [Google Scholar]
- Karbowski M, Norris KL, Cleland MM, Jeong SY, Youle RJ. Role of Bax and Bak in mitochondrial morphogensis. Nature. 2006;443:658–662. doi: 10.1038/nature05111. [DOI] [PubMed] [Google Scholar]
- Keele BB, Jr, McCord JM, Fridovich I. Superoxide dismutase from Escherichia coli B. A new manganese-containing enzyme. J Biol Chem. 1970;245:6176–6181. [PubMed] [Google Scholar]
- Keeney PM, Xie J, Capaldi RA, Bennett JP., Jr Parkinson's disease brain mitochondrial complex I has oxidatively damaged subunits and is functionally impaired and misassembled. J Neurosci. 2006;26:5256–5264. doi: 10.1523/JNEUROSCI.0984-06.2006. [DOI] [PMC free article] [PubMed] [Google Scholar]
- Kirkland RA, Franklin JL. Evidence for redox regulation of cytochrome c release during programmed neuronal death: antioxidant effects of protein synthesis and caspase inhibition. J Neurosci. 2001;21:1949–1963. doi: 10.1523/JNEUROSCI.21-06-01949.2001. [DOI] [PMC free article] [PubMed] [Google Scholar]
- Kirkland RA, Franklin JL. Bax affects production of reactive oxygen by the mitochondria of nonapoptotic neurons. Exp Neurol. 2007a;204:458–461. doi: 10.1016/j.expneurol.2006.09.013. [DOI] [PMC free article] [PubMed] [Google Scholar]
- Kirkland RA, Windelborn JA, Kasprzak JM, Franklin JL. A Bax-induced pro-oxidant state is critical for cytochrome c release during programmed neuronal death. J Neurosci. 2002;22:6480–6490. doi: 10.1523/JNEUROSCI.22-15-06480.2002. [DOI] [PMC free article] [PubMed] [Google Scholar]
- Kirkland RA, Saavedra GM, Franklin JL. Rapid activation of antioxidant defenses by nerve growth factor suppresses reactive oxygen species during neuronal apoptosis: evidence for a role in cytochrome c redistribution. J Neurosci. 2007b;27:11315–11326. doi: 10.1523/JNEUROSCI.3590-07.2007. [DOI] [PMC free article] [PubMed] [Google Scholar]
- Knudson CM, Tung KS, Tourtellotte WG, Brown GA, Korsmeyer SJ. Bax-deficient mice with lymphoid hyperplasia and male germ cell death. Science. 1995;270:96–99. doi: 10.1126/science.270.5233.96. [DOI] [PubMed] [Google Scholar]
- Kober T, König I, Weber M, Kojda G. Diethyldithiocarbamate inhibits the catalytic activity of xanthine oxidase. FEBS Lett. 2003;551:99–103. doi: 10.1016/s0014-5793(03)00876-7. [DOI] [PubMed] [Google Scholar]
- Kokoszka JE, Coskun P, Esposito LA, Wallace DC. Increased mitochondrial oxidative stress in the SOD2 (+/−) mouse results in the age-related decline of mitochondrial function culminating in increased apoptosis. Proc Natl Acad Sci U S A. 2001;98:2278–2283. doi: 10.1073/pnas.051627098. [DOI] [PMC free article] [PubMed] [Google Scholar]
- Kowaltowski AJ, Fiskum G. Redox mechanisms of cytoprotection by Bcl-2. Antioxid Redox Signal. 2005;7:508–514. doi: 10.1089/ars.2005.7.508. [DOI] [PMC free article] [PubMed] [Google Scholar]
- Kowaltowski AJ, Vercesi AE, Fiskum G. Bcl-2 prevents mitochondrial permeability transition and cytochrome c release via maintenance of reduced pyridine nucleotides. Cell Death Differ. 2000;7:903–910. doi: 10.1038/sj.cdd.4400722. [DOI] [PubMed] [Google Scholar]
- Krajewska M, Mai JK, Zapata JM, Ashwell KW, Schendel SL, Reed JC, Krajewski S. Dynamics of expression of apoptosis-regulatory proteins Bid, Bcl-2, Bcl-x, Bax, and Bak during development of murine nervous system. Cell Death Differ. 2002;9:145–157. doi: 10.1038/sj.cdd.4400934. [DOI] [PubMed] [Google Scholar]
- Leitch JM, Yick PJ, Culotta VC. The right to choose: multiple pathways for activating copper, zinc superoxide dismutase. J Biol Chem. 2009;284:24679–24683. doi: 10.1074/jbc.R109.040410. [DOI] [PMC free article] [PubMed] [Google Scholar]
- Lesuisse C, Martin LJ. Long-term culture of mouse cortical neurons as a model for neuronal development, aging, and death. J Neurobiol. 2002;51:9–23. doi: 10.1002/neu.10037. [DOI] [PubMed] [Google Scholar]
- Li LY, Luo X, Wang X. Endonuclease G is an apoptotic DNAse when released from mitochondria. Nature. 2001;412:95–99. doi: 10.1038/35083620. [DOI] [PubMed] [Google Scholar]
- Li P, Nijhawan D, Budihardjo I, Srinivasula SM, Ahmad M, Alnemri ES, Wang X. Cytochrome c and dATP-dependent formation of Apaf-1/caspase-9 complex initiates an apoptotic protease cascade. Cell. 1997;91:479–489. doi: 10.1016/s0092-8674(00)80434-1. [DOI] [PubMed] [Google Scholar]
- Li Z, Jo J, Jia J, Lo S, Whitcomb DJ, Jiao S, Cho K, Sheng M. Caspase-3 activation via mitochondria is required for long-term depression and AMPA receptor internalization. Cell. 2010;141:859–871. doi: 10.1016/j.cell.2010.03.053. [DOI] [PMC free article] [PubMed] [Google Scholar]
- Lin MT, Beal MF. Mitochondrial dysfunction and oxidative stress in neurodegenerative diseases. Nature. 2006;443:787–795. doi: 10.1038/nature05292. [DOI] [PubMed] [Google Scholar]
- Liu TH, Beckman JS, Freeman BA, Hogan EL, Hsu CY. Polyethylene glycol-conjugated superoxide dismutase and catalase reduce ischemic brain injury. Am J Physiol. 1989;256:H589–H593. doi: 10.1152/ajpheart.1989.256.2.H589. [DOI] [PubMed] [Google Scholar]
- Liu Y, Fiskum G, Schubert D. Generation of reactive oxygen species by the mitochondrial electron transport chain. J Neurochem. 2002;80:780–787. doi: 10.1046/j.0022-3042.2002.00744.x. [DOI] [PubMed] [Google Scholar]
- Lucken-Ardjomande S, Montessuit S, Martinou JC. Contributions to Bax insertion and oligomerization of lipids of the mitochondrial outer membrane. Cell Death Differ. 2008;15:929–937. doi: 10.1038/cdd.2008.9. [DOI] [PubMed] [Google Scholar]
- Maklashina E, Ackrell BAC. Is defective electron transport at the hub of aging? Aging Cell. 2004;3:21–27. doi: 10.1111/j.1474-9728.2003.00078.x. [DOI] [PubMed] [Google Scholar]
- Martin DP, Schmidt RE, DiStefano PS, Lowry OH, Carter JG, Johnson EM., Jr Inhibitors of protein synthesis and RNA synthesis prevent neuronal death caused by nerve growth factor deprivation. J Cell Biol. 1988;106:829–844. doi: 10.1083/jcb.106.3.829. [DOI] [PMC free article] [PubMed] [Google Scholar]
- McCord JM, Fridovich I. Superoxide dismutase an enzymatic function for erythrocuprein (hemocuprein) J Biol Chem. 1969;244:6049–6055. [PubMed] [Google Scholar]
- McCord JM, Boyle JA, Day ED, Rizzolo LJ, Salin ML. In: Superoxide and superoxide dismutases. Michelson AM, McCord JM, Fridovich I, editors. London: Academic; 1977. [Google Scholar]
- Melov S. Modeling mitochondrial function in aging neurons. Trends Neurosci. 2004;10:600–606. doi: 10.1016/j.tins.2004.08.004. [DOI] [PubMed] [Google Scholar]
- Melov S, Coskun P, Patel M, Tuinstra R, Cottrell B, Jun AS, Zastawny TH, Dizdaroglu M, Goodman SI, Huang TT, Miziorko H, Epstein CJ, Wallace DC. Mitochondrial disease in superoxide dismutase 2 mutant mice. Proc Natl Acad Sci U S A. 1999;96:846–851. doi: 10.1073/pnas.96.3.846. [DOI] [PMC free article] [PubMed] [Google Scholar]
- Mérino D, Giam M, Hughes PD, Siggs OM, Heger K, O'Reilly LA, Adams JM, Strasser A, Lee EF, Fairlie WD, Bouillet P. The role of BH3-only protein Bim extends beyond inhibiting Bcl-2-like prosurvival proteins. J Cell Biol. 2009;186:355–362. doi: 10.1083/jcb.200905153. [DOI] [PMC free article] [PubMed] [Google Scholar]
- Miller RA. “Accelerated aging”: a primrose path to insight? Aging Cell. 2004;3:47–51. doi: 10.1111/j.1474-9728.2004.00081.x. [DOI] [PubMed] [Google Scholar]
- Miller TM, Johnson EM., Jr Metabolic and genetic analysis of apoptosis in potassium/serum-deprived rat cerebellar granule cells. J Neurosci. 1996;16:7487–7495. doi: 10.1523/JNEUROSCI.16-23-07487.1996. [DOI] [PMC free article] [PubMed] [Google Scholar]
- Miller TM, Moulder KL, Knudson CM, Creedon DJ, Deshmukh M, Korsmeyer SJ, Johnson EM., Jr Bax deletion further orders the cell death pathway in cerebellar granule cells and suggests a caspase-independent pathway in cell death. J Cell Biol. 1997;139:205–217. doi: 10.1083/jcb.139.1.205. [DOI] [PMC free article] [PubMed] [Google Scholar]
- Misra HP. Reaction of copper-zinc superoxide dismutase with diethyldithiocarbamate. J Biol Chem. 1979;254:11623–11628. [PubMed] [Google Scholar]
- Nhan TQ, Liles WC, Schwartz SM. Physiological functions of caspases beyond cell death. Am J Pathol. 2006;169:729–737. doi: 10.2353/ajpath.2006.060105. [DOI] [PMC free article] [PubMed] [Google Scholar]
- Nicholls DG, Budd SL. Mitochondria and neuronal survival. Physiol Rev. 2000;80:315–360. doi: 10.1152/physrev.2000.80.1.315. [DOI] [PubMed] [Google Scholar]
- Nicholls DG, Ferguson SJ. Bioenergetics 3. London: Academic; 2002. [Google Scholar]
- Nicholls DG, Ward MW. Mitochondrial membrane potential and cell death: mortality and millivolts. Trends Neurosci. 2000;23:166–174. doi: 10.1016/s0166-2236(99)01534-9. [DOI] [PubMed] [Google Scholar]
- O'Hare MJ, Hou ST, Morris EJ, Cregan SP, Xu Q, Slack RS, Park DS. Induction and modulation of cerebellar granule neuron death by E2F-1. J Biol Chem. 2000;275:25358–25364. doi: 10.1074/jbc.M001725200. [DOI] [PubMed] [Google Scholar]
- Pollack M, Phaneuf S, Dirks A, Leeuwenburgh C. The role of apoptosis in the normal aging brain, skeletal muscle, and heart. Ann NY Acad Sci. 2002;959:93–107. doi: 10.1111/j.1749-6632.2002.tb02086.x. [DOI] [PubMed] [Google Scholar]
- Polster BM, Robertson CL, Bucci CJ, Suzuki M, Fiskum G. Postnatal brain development and neural cell differentiation modulate mitochondrial Bax and BH3 peptide-induced cytochrome c release. Cell Death Differ. 2003;10:365–370. doi: 10.1038/sj.cdd.4401158. [DOI] [PubMed] [Google Scholar]
- Praticò D, Uryu K, Leight S, Trojanowski JQ, Lee VM. Increased lipid peroxidation precedes amyloid plaque formation in an animal model of Alzheimer amyloidosis. J Neurosci. 2001;21:4183–4187. doi: 10.1523/JNEUROSCI.21-12-04183.2001. [DOI] [PMC free article] [PubMed] [Google Scholar]
- Priault M, Cartron PF, Camougrand N, Antonsson B, Vallette FM, Manon S. Investigation of the role of the c-terminus of Bax and of tc-Bid on Bax interaction with yeast mitochondria. Cell Death Differ. 2003;10:1068–1077. doi: 10.1038/sj.cdd.4401270. [DOI] [PubMed] [Google Scholar]
- Punchard NA, Kelly FJ. Free radicals a practical approach. Oxford: Oxford UP; 1996. [Google Scholar]
- Putcha GV, Deshmukh M, Johnson EM., Jr Inhibition of apoptotic signaling cascades causes loss of trophic factor dependence during neuronal maturation. J Cell Biol. 2000;149:1011–1018. doi: 10.1083/jcb.149.5.1011. [DOI] [PMC free article] [PubMed] [Google Scholar]
- Qian S, Wang W, Yang L, Huang HW. Structure of transmembrane pore induced by Bax-derived peptide: evidence for lipidic pores. Proc Natl Acad Sci U S A. 2008;105:17379–17383. doi: 10.1073/pnas.0807764105. [DOI] [PMC free article] [PubMed] [Google Scholar]
- Ricci JE, Gottlieb RA, Green DR. Caspase-mediated loss of mitochondrial function and generation of reactive oxygen species during apoptosis. J Cell Biol. 2003;160:65–75. doi: 10.1083/jcb.200208089. [DOI] [PMC free article] [PubMed] [Google Scholar]
- Ricci JE, Muñoz-Pinedo C, Fitzgerald P, Bailly-Maitre B, Perkins GA, Yadava N, Scheffler IE, Ellisman MH, Green DR. Disruption of mitochondrial function during apoptosis is mediated by caspase cleavage of the p75 subunit of complex I of the electron transport chain. Cell. 2004;117:773–786. doi: 10.1016/j.cell.2004.05.008. [DOI] [PubMed] [Google Scholar]
- Robinson KM, Janes MS, Pehar M, Monette JS, Ross MF, Hagen TM, Murphy MP, Beckman JS. Selective fluorescent imaging of superoxide in vivo using ethidium-based probes. Proc Natl Acad Sci U S A. 2006;103:15038–15043. doi: 10.1073/pnas.0601945103. [DOI] [PMC free article] [PubMed] [Google Scholar]
- Ross MF, Kelso GF, Blaikie FH, James AM, Cochemél HM, Filipovska A, Da Ros T, Hurd TR, Smith RAJ, Murphy MP. Lipophilic triphenylphosphonium cations as tools in mitochondrial bioenergetics and free radical biology. Biochemistry (Mosc) 2005;70:222–230. doi: 10.1007/s10541-005-0104-5. [DOI] [PubMed] [Google Scholar]
- Royall JA, Ischiropoulos H. Evaluation of 2′,7′-dichlorofluorescin and dihydrorhodamine123 as fluorescent probes for intracellular H2O2 in cultured endothelial cells. Arch Biochem Biophys. 1993;302:348–355. doi: 10.1006/abbi.1993.1222. [DOI] [PubMed] [Google Scholar]
- Sevilla F, López-Gorgé J, Del Río LA. Characterization of a manganese superoxide dismutase from the higher plant pisum sativum. Plant Physiol. 1982;70:1321–1326. doi: 10.1104/pp.70.5.1321. [DOI] [PMC free article] [PubMed] [Google Scholar]
- Sherer TB, Betarbet R, Testa CM, Seo BB, Richardson JR, Kim JH, Miller GW, Yagi T, Matsuno-Yagi A, Greenamyre JT. Mechanism of toxicity in rotenone models of Parkinson's disease. J Neurosci. 2003;23:10756–10764. doi: 10.1523/JNEUROSCI.23-34-10756.2003. [DOI] [PMC free article] [PubMed] [Google Scholar]
- Shou Y, Li L, Praghakaran K, Borowitz JL, Isom GE. P38 mitogen-activated protein kinase regulates Bax translocation in cyanide-induced apoptosis. Toxicol Sci. 2003;75:99–107. doi: 10.1093/toxsci/kfg157. [DOI] [PubMed] [Google Scholar]
- Starkov AA, Polster BM, Fiskum G. Regulation of hydrogen peroxide production by brain mitochondria by calcium and Bax. J Neurochem. 2002;83:220–228. doi: 10.1046/j.1471-4159.2002.01153.x. [DOI] [PubMed] [Google Scholar]
- Steckley D, Karajgikar M, Dale LB, Fuerth B, Swan P, Drummond-Main C, Poulter MO, Ferguson SS, Strasser A, Cregan SP. Puma is a dominant regulator of oxidative stress induced Bax activation and neuronal apoptosis. J Neurosci. 2007;27:12989–12999. doi: 10.1523/JNEUROSCI.3400-07.2007. [DOI] [PMC free article] [PubMed] [Google Scholar]
- Su JH, Deng G, Cotman CW. Bax protein expression is increased in Alzheimer's brain: correlation with DNA damage, Bcl-2 expression, and brain pathology. J Neuropath Exp Neurol. 1997;56:86–93. doi: 10.1097/00005072-199701000-00009. [DOI] [PubMed] [Google Scholar]
- Sun W, Winseck A, Vinsant S, Park OH, Kim H, Oppenheim RW. Programmed cell death of adult-generated hippocampal neurons is mediated by the proapoptotic gene bax. J Neurosci. 2004;24:11205–11213. doi: 10.1523/JNEUROSCI.1436-04.2004. [DOI] [PMC free article] [PubMed] [Google Scholar]
- Suzuki Y, Imai Y, Nakayama H, Takahashi K, Takio K, Takahashi R. A serine protease, HtrA2, is released from the mitochondria and interacts with XIAP, inducing cell death. Mol Cell. 2001;8:613–621. doi: 10.1016/s1097-2765(01)00341-0. [DOI] [PubMed] [Google Scholar]
- Tan S, Sagara Y, Liu Y, Maher P, Schubert D. The regulation of reactive oxygen species production during programmed cell death. J Cell Biol. 1998;141:1423–1432. doi: 10.1083/jcb.141.6.1423. [DOI] [PMC free article] [PubMed] [Google Scholar]
- Turrens JF. Superoxide production by the mitochondrial respiratory chain. Bioscience Rep. 1997;17:3–8. doi: 10.1023/a:1027374931887. [DOI] [PubMed] [Google Scholar]
- Valentijn AJ, Upton JP, Bates N, Gilmore AP. Bax targeting to mitochondria occurs via both tail anchor-dependent and -independent mechanisms. Cell Death Differ. 2008;15:1243–1254. doi: 10.1038/cdd.2008.39. [DOI] [PMC free article] [PubMed] [Google Scholar]
- Vaughn AE, Deshmukh M. Essential postmitochondrial function of p53 uncovered in DNA damage-induced apoptosis in neurons. Cell Death Differ. 2007;14:973–981. doi: 10.1038/sj.cdd.4402084. [DOI] [PubMed] [Google Scholar]
- Vekrellis K, McCarthy MJ, Watson A, Whitfield J, Rubin LL, Ham J. Bax promotes neuronal cell death and is downregulated during the development of the nervous system. Development. 1997;124:1239–1249. doi: 10.1242/dev.124.6.1239. [DOI] [PubMed] [Google Scholar]
- Vila M, Jackson-Lewis V, Vukosavic S, Djaldetti R, Liberatore G, Offen D, Korsmeyer SJ, Przedborski S. Bax ablation prevents dopaminergic neurodegeneration in the 1-methyl-4-phenyl-1,2,3,6-tetrahydropyridine mouse model of Parkinson's disease. Proc Natl Acad Sci U S A. 2001;98:2837–2842. doi: 10.1073/pnas.051633998. [DOI] [PMC free article] [PubMed] [Google Scholar]
- Wright KM, Vaughn AE, Deshmukh M. Apoptosome dependent caspase-3 activation pathway is nonredundant and necessary for apoptosis in sympathetic neurons. Cell Death Differ. 2007;14:625–633. doi: 10.1038/sj.cdd.4402024. [DOI] [PubMed] [Google Scholar]
- Yousefi S, Conus S, Símon HU. Cross-talk between death and survival pathways. Cell Death Differ. 2003;10:861–863. doi: 10.1038/sj.cdd.4401262. [DOI] [PubMed] [Google Scholar]
- Zhao H, Kalivendi S, Zhang H, Joseph J, Nithipatikom K, Vásquez-Vivar J, Kalyanaraman B. Superoxide reacts with hydroethidine but forms a fluorescent product that is distinctly different from ethidium: potential implications in intracellular fluorescence detection of superoxide. Free Radic Biol Med. 2003;34:1359–1368. doi: 10.1016/s0891-5849(03)00142-4. [DOI] [PubMed] [Google Scholar]
- Zhao H, Joseph J, Fales HM, Sokoloski EA, Levine RL, Vasquez-Vivar J, Kalyanaraman B. Detection and characterization of the product of hydroethidine and intracellular superoxide by HPLC and limitations of fluorescence. Proc Natl Acad Sci U S A. 2005;102:5727–5732. doi: 10.1073/pnas.0501719102. [DOI] [PMC free article] [PubMed] [Google Scholar]