

Abstract
Figure copy is the most common method of visual spatial assessment in dementia evaluations, but performance on this test may be multifactorial. We examined the neuroanatomical substrates of figure copy performance in 46 patients with Alzheimer’s disease (AD) and 48 patients with the behavioral variant of Frontotemporal dementia (bvFTD). A group of 94 neurologically healthy controls were studied for comparison. In AD, poor figure copy correlated significantly with right parietal cortex volumes but not with right dorsolateral prefrontal cortex volumes, whereas in bvFTD, figure copy performance correlated significantly with right dorsolateral prefrontal cortex volumes and there was only a trend with right parietal cortex volumes. The cognitive processes associated with figure copy performance also differed by diagnostic group such that figure copy was associated with spatial perception and attention in AD and with spatial planning and working memory in bvFTD. Spatial planning accounted for unique variance in the figure copy performance of bvFTD even after accounting for spatial perception, attention, and working memory. These results suggest that figure copy performance in AD and bvFTD is not anatomically-specific and is differentially impacted by bottom-up and top-down aspects of visual spatial processing. Alternative methods of visual spatial assessment for dementia evaluations are proposed.
Keywords: Visuospatial, Parietal, Prefrontal, Dementia, Neurodegenerative, Neuropsychological Assessment, Visuoconstruction
Visual spatial impairments are often among the first symptoms of neurodegenerative disease. Patients in the early stages of Alzheimer’s disease (AD) often get lost, forget where they placed their belongings, and have trouble driving or parking their car (deIpolyi, Rankin, Mucke, Miller, & Gorno-Tempini, 2007; Hamilton, Fay, & Rockwood, 2009; Monacelli, Cushman, Kavcic, & Duffy, 2003; Pai & Jacobs, 2004). AD can impact a wide range of visual processes including contrast sensitivity, angle discrimination, motion perception, object recognition, mental rotation, and navigation learning, consistent with the impact of the disease on critical visual spatial processing areas in the parietal and temporal lobes (Rabinovici et al., 2007). Similarly, patients with the behavioral variant of frontotemporal dementia (bvFTD) can show deficits on visual tasks, but these deficits may be due to different mechanisms. The top-down control of visual processing has been shown to be affected in early bvFTD, including visual discrimination learning and the inhibition of spatial attention (Carey et al., 2008; Krueger et al., 2009; Rahman, Sahakian, Hodges, Rogers, & Robbins, 1999), and bvFTD patients tend to make more rule violation and perseveration errors on visual tasks (Carey et al., 2008; (Chester et al., 2009; Possin et al., 2009). In contrast, bottom-up aspects of visual spatial cognition such as perceptual processing are relatively preserved in bvFTD (Possin, 2010). While the driving of patients with AD is described as unsteady with poor orientation, the driving style of patients with bvFTD has been characterized as risky with increased traffic violations and collisions (de Simone, Kaplan, Patronas, Wassermann, & Grafman, 2007; Ernst et al., 2007)
The most common method for evaluating visual spatial cognition in a dementia evaluation is to ask the patient to copy a figure. BvFTD patients generally outperform AD patients on figure copy tests (Diehl & Kurz, 2002; Elfgren et al., 1994; Mendez et al., 1996; Rascovsky, Salmon, Hansen, & Galasko, 2008; Rascovsky et al., 2002), although they have been equally impaired in some studies when the figure to be copied is complex (Frisoni et al., 1995; Kramer et al., 2003; Lindau, Almkvist, Johansson, & Wahlund, 1998; Pachana, Boone, Miller, Cummings, & Berman, 1996; Perry & Hodges, 2000). On these complex figure copy tests, such as the Rey-Osterrieth Complex Figure, performance is known to be influenced not only by parietally-mediated skills such as visual spatial perception and integration, but also by frontally-mediated executive skills such as organization, strategic processing, and working memory (Choi et al., 2004; Freeman et al., 2000; Hernandez et al., 2003; Varma et al., 1999). This task complexity makes it possible to explore differential mechanisms of impairment in different disorders. AD patients, for example, may be more likely to make spatial errors on figure copy, whereas bvFTD patients may be more likely to make organizational or perseverative errors with preserved spatial configuration (Thompson, Stopford, Snowden, & Neary, 2005).
The purpose of this study was to examine whether figure copy difficulties in AD and bvFTD were associated with different anatomical substrates and cognitive mechanisms. We focused our analyses on right-sided regions of interest based on previous studies, which suggest a preeminent role of right hemisphere dysfunction in causing visual spatial processing deficits in neurodegenerative disease (Boxer, Kramer et al., 2003; Forster et al., ; Haxby et al., 1990; Mega et al., 1998; Teipel et al., 2006; Whitwell et al., 2007)(but see Teipel et al., 2006), and because of the high collinearity between corresponding brain regions in two hemispheres. We hypothesized that poor figure copy in AD would correlate with right parietal atrophy, but that in bvFTD it would correlate with right dorsolateral prefrontal atrophy. The parietal and dorsolateral prefrontal cortices were chosen as our primary regions of interest because they are understood to play critical roles in dorsal stream and top-down aspects of visual spatial processing, respectively (Kastner & Ungerleider, 2000; Miller & Cohen, 2001; (Robertson, 2003), which are both important for good figure copy. Further, in patients with AD who present with primary visual spatial impairment (i.e., “ Posterior Cortical Atrophy” syndrome), the right parietal or parietal-occipital cortex shows prominent atrophy and selective hypometabolism, and further, dorsal stream cognitive functions (e.g., features of Balint’s syndrome) are more impaired than ventral stream functions at first presentation (McMonagle, Deering, Berliner, & Kertesz, 2006; Nestor, Caine, Fryer, Clarke, & Hodges, 2003; Whitwell et al., 2007). We also included right lateral temporal cortex, which is important for ventral visual stream processing and plays a role in figure copy (Boxer, Kramer et al., 2003; Forster et al.). In addition, we hypothesized that different cognitive mechanisms underlie poor figure copy in these groups. In particular, we posited that poor figure copy would be associated with spatial perception and attention impairment in AD and spatial planning and working memory impairment in bvFTD.
Method
Subjects
We searched the University of California, San Francisco Memory and Aging Center (UCSF MAC) database for all patients with a diagnosis of probable AD (McKhann et al., 1984), behavioral variant FTD (Neary et al., 1998), or neurologically healthy control who received a 1.5 T high-definition MR anatomical scan within 90 days of figure copy assessment and scored at least 18 on the Mini Mental State Examination (MMSE; Folstein et al., 1975). When there was more than one visit when the patients met these criteria, the first visit was selected. Diagnoses were derived based upon a comprehensive evaluation including neurological history and examination, a caregiver interview, and a brief neuropsychological assessment that included tests of memory, executive function, language, visual spatial skills, and mood using a previously described standard protocol (Kramer et al., 2003). Exclusionary criteria included presence of another neurologic condition affecting behavior or cognition, a longstanding Axis I psychiatric disorder, a metabolic disorder or major organ dysfunction, alcohol abuse or dependence within 5 years, head trauma (with loss of consciousness greater than 30 minutes), deteriorating cardiovascular disease, or prominent white matter disease. Forty-six patients with AD and 48 patients with bvFTD met these criteria and were included in the sample. A sample of 94 neurologically healthy controls was selected who met these criteria and were comparable in terms of age, sex, and education to the patients. The study was approved by the UCSF committee on human research. All subjects provided written informed consent before participating. Demographic and clinical variables are reported in Table 1.
Table 1.
Demographic Characteristics and Figure Copy Scores by Diagnostic Group
| N | Age | Education | Males | MMSE | Figure copy | |
|---|---|---|---|---|---|---|
| Full sample | ||||||
| bvFTD | 48 | 61.8 (9.8) | 16.6 (2.2) | 33 | 26.0 (3.6) | 14.6 (2.7) |
| AD | 46 | 65.5 (9.7) | 16.0 (3.1) | 27 | 23.8 (3.1) | 11.9 (5.4) |
| HC | 94 | 63.7 (7.2) | 16.6 (7.2) | 56 | 29.5 (.7) | 15.8 (1.0) |
| Visual Spatial Test Sample | ||||||
| bvFTD | 22 | 59.7 (7.3) | 17.3 (1.8) | 18 | 26.6 (3.6) | 15.6 (1.6) |
| AD | 16 | 62.6 (8.2) | 15.6 (3.4) | 9 | 25.2 (2.0) | 13.0 (5.0) |
Values represent mean (s.d.).
Visual Spatial Assessment
All patients were administered the “Benson Figure,” which is a simplified version of the Rey-Osterrieth figure that was developed by Frank Benson, M.D. (see Figure 1). Patients were asked to copy the figure and no limit was placed on response time. Performance was scored on a scale from 0 to 17 that emphasized both accuracy of design elements and their placement. A subset of 22 patients with bvFTD and 16 patients with AD were administered the Visual Object and Space Perception Number-Location subtest, which is a test of spatial perception (Warrington & James, 1991); the Delis-Kaplan Executive Function System California Tower Test (Delis, Kaplan, & Kramer, 2001), which is a test of spatial planning; and the Wechsler Memory Scale –Third Edition Spatial Span Test (Wechsler, 1997), which is a test of spatial attention (forward span) and working memory (backward span). Not all patients and none of the controls were administered these tests because they have not always been part of our cognitive battery. Demographic information and clinical variables by diagnostic group are presented for the entire patient sample and for the subgroup who received the additional visual spatial assessment in Table 1.
Figure 1.
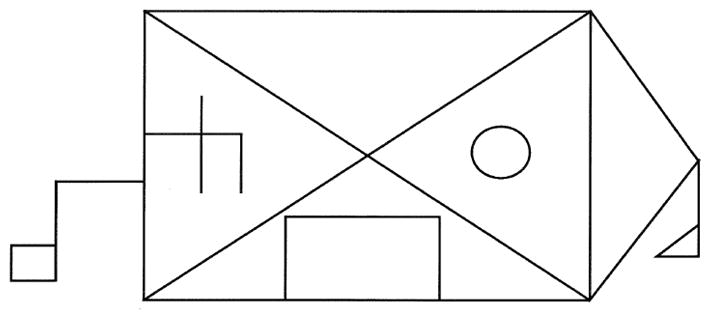
Benson Figure
Neuroimaging Data
MRI scans were obtained on a 1.5-T Magnetom VISION system (Siemens, Iselin, NJ) at the San Francisco Veteran’s Administration Hospital. A volumetric magnetization prepared rapid gradient-echo MRI (MPRG, TR/TE/TI = 10/4/300 milliseconds) was used to obtain T1-weighted (MP-RAGE) images of the entire brain, 15-degree flip angle, coronal orientation perpendicular to the double spin-echo sequence, 1.0 × 1.0 mm in-plane resolution and 1.5 mm slab thickness.
Freesurfer Analyses
The T1 MPRAGE structural MR images were analyzed using Freesurfer, which is documented and freely available for download online at: http://surfer.nmr.mgh.harvard.edu/. Previous publications have detailed and validated the software (Segonne et al., 2004; Dale et al., 1999; Fischl et al., 1999a; Fischl et al., 2001). Freesurfer is a surface-based structural MRI analysis tool that segments white matter and tessellates both gray and white matter surfaces. The procedure, in brief, involves the removal of non-brain tissue using a hybrid watershed/surface deformation procedure (Segonne et al., 2004) and intensity normalization (Sled et al., 1998), followed by automated Talairach transformation and volumetric segmentation of cortical and subcortical gray and white matter, subcortical limbic structures, basal ganglia and ventricles (Fischl et al., 2002; Fischl et al., 2004a). Estimated total intracranial volume (ICV) is calculated via an atlas normalization procedure(Buckner et al., 2004). The surfacing algorithm uses intensity and continuity data, and corrects topological defects to generate a continuous cortical ribbon used to calculate gray matter volume and thickness (Segonne et al., 2004; Fischl et al., 2001; Segonne et al., 2007; Fischl & Dale, 2000), a procedure validated against histological analysis (Rosas et al., 2002) and manual measurements (Kuperberg et al., 2003; Salat et al., 2004). This cortical surface is then inflated and registered to a spherical atlas and parcellated into regions of interest (ROI) based on gyral and sulcal structure (Fischl et al., 1999a; Fischl et al., 2004b; Fischl et al., 1999b; Desikan et al., 2006). Cortical regions of interest were the right dorsolateral prefrontal cortex (rDLPFC), the right parietal cortex (rPC), the right lateral temporal cortex, the right entorhinal cortex, the right hippocampus, the right anterior cingulate, and the right orbitofrontal cortex (Desikan et al., 2006). The rDLPFC was defined as the middle frontal gyrus. The rPC did not include the postcentral gyrus because it is more important for somatosensory than visual processing and it is relatively spared in both AD and bvFTD (Rabinovici et al., 2007).
Results
Demographic characteristics and figure copy scores by diagnostic group are presented in Table 1. In the full sample, the diagnostic groups did not differ significantly in age, F(2, 185) = 2.13, p = .12, or in the proportion of males, F(2, 185) = .68, p = .51. MMSE scores differed between the groups, F(2, 185) = 95.55, p < .001. Tukey follow-up procedure (p < .05) indicated that the ADs scored lower on the MMSE than the bvFTD patients, d = .65, and the controls, d = 2.54, and the bvFTD patients scored lower than the controls, d = 1.35. Figure copy performance differed between the groups, F(2, 185) = 25.45, p < .001. Tukey follow-up procedure indicated that the AD patients scored lower on figure copy than the patients with bvFTD, d = .63, and than the controls, d = 1.00, and there was a trend for bvFTD patients to score lower than the controls, d = .59. Using a cut-off score of 14 and below for impaired performance on the figure copy test, which is 1.8 SD units below the control group’s mean, 52% of the AD patients and 38% of the bvFTD patients scored in the impaired range on this test.
Within the subgroup of patients who received the additional visual spatial assessment, the diagnostic groups did not differ significantly by age t (36) = 1.14, p = .26, d = .37, or MMSE scores, t (36) = 1.46, p = .15, d = .48. There was a trend for more males in the bvFTD group, t (36) = 1.74, p = .09. The AD patients scored lower than the bvFTD patients on the figure copy test, t (36) = 2.35, p = .03, d = .70. Thirty-eight percent of patients with AD and 23% of patients with bvFTD were impaired on figure copy. The AD patients achieved a lower Spatial Span maximum forward span, t (36) = 4.40, p < .001, d = 1.47, and backward span, t (36) = 2.64, p = .012, d = .89, but the groups did not differ significantly in Number Location Test scores, t (36) = .37, p = .72, d = .10, or Tower Test total achievement scores, t (36) = .18, p = .86, d = .06.
To examine the relationship between figure copy performance and our regions of interest in each diagnostic group, we performed partial correlations, controlling for MMSE, sex, age, and intracranial volume (ICV). In AD patients, the partial correlation between figure copy and rPC was highly significant, r = .58, p < .001. The correlations with rDLPFC, r = .20, p = .21, and right lateral temporal cortex, r = .27, p = .16, were not significant. In bvFTD, the partial correlation between figure copy and rDLPFC was significant, r = .45, p = .002. There was a trend with rPC, r = .26, p = .09, and the correlation with right lateral temporal cortex, r = .09, p = .55, was not significant. Scatterplots depicting the relationship between figure copy and unadjusted rPC and rDLPFC volumes in AD and bvFTD are presented in Figure 2. Partial correlations with these regions of interest were also computed in the neurologically healthy controls; none were significant (rPC: r = −.16, p = .13; rDLPFC, r = −.07, p = .53; and right lateral temporal cortex, r = −.18, p = .10).
Figure 2.
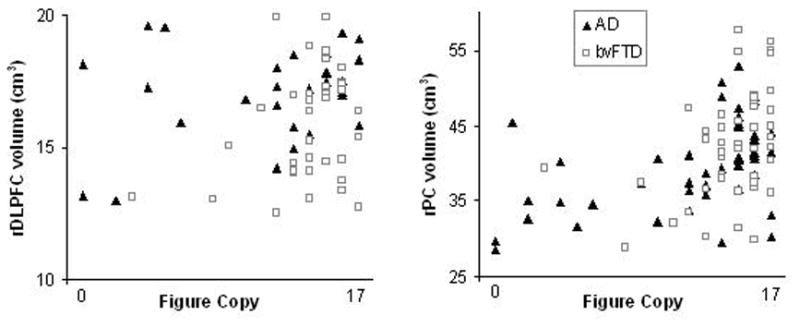
Figure copy scores and unadjusted right dorsolateral prefrontal cortex (rDLPFC) and right parietal cortex (rPC) volumes in Alzheimer’s disease (AD) and behavioral variant frontotemporal dementia (bvFTD)
To determine whether the relationship between figure copy and gray matter volumes of the rPC and the rDLPFC depended on AD or bvFTD diagnosis, a regression analysis was performed with figure copy scores as the dependent measure and MMSE, sex (male = 1, female = 2), age, ICV, diagnosis (diagnosis = 0 if AD, 1 if bvFTD), rPC, rDLPFC, rPC X diagnosis, and rDLPFC X diagnosis entered as covariates. rPC and rDLPFC volumes were centered around their means. The rPC X diagnosis interaction, β = −.60, p = .001, and the rDLPFC X diagnosis interaction, β = .41, p = .02, were significant. Older age, β = .35, p < .001, MMSE, β = .17, p = .06, bvFTD diagnosis, β = .27, p =.01, and rPC, β = .80, p < .001, were also significant predictors. Sex, β = .15, p = .15, ICV, β = −.06, p = .58, and rDLPFC, β = −.15, p = .37, were not significant predictors.
We analyzed diagnostic group differences in rPC and rDLPFC volumes. The groups differed in the volumes of their rPC, F(2, 185) = 54.11, p < .001, and rDLPFC, F(2, 185) = 34.50, p < .001. The AD patients had smaller rPC volumes than the bvFTD patients, d = .48, and than the controls, d = 1.83, and the bvFTD patients had smaller rPC volumes than the controls, d = 1.16. The bvFTD patients had smaller rDLPFC volumes than the AD patients, d = .47, and than the controls, d = 1.36, and the AD patients had smaller rDLPFC volumes than the controls, d = .92. These results suggested that the correlations between rPC and rDLPFC and figure copy might be explained by disease-related atrophy that does not underlie visual spatial deficits. In other words, it could be that rPC atrophy is a marker of the severity of AD pathology and does not underlie visual spatial impairment, per se. To examine this possibility, additional partial correlations were performed between figure copy performance and brain regions known to be targeted earliest by each disease but not thought to play a major role in figure copy (Braak & Braak, 1998; Ishii et al., 2005; Perry et al., 2006), again controlling for MMSE, sex, age, and ICV. Specifically, in the bvFTD patients, correlations were performed between figure copy performance and right orbitofrontal cortex and right anterior cingulate cortex volumes; neither of these correlations were significant, r = −.03, p = .84; r = .08, p = .60, respectively. In the AD patients, a correlation was performed between figure copy performance and right entorhinal volumes and right hippocampus volumes; these correlations were not significant, r = −.04, p = .80; r = −.02, p = .99, respectively.
Partial correlations were also performed to determine the contributions of spatial perception, spatial planning, spatial attention, and spatial working memory to figure copy, controlling for MMSE, sex, and age. In the bvFTD patients, figure copy correlated significantly with spatial planning, r = .67, p = .002, and spatial working memory, r = .51, p = .03, but not with spatial perception, r = .38, p = .11, or spatial attention, r = .35, p = .14. In the AD patients, figure copy correlated significantly with spatial perception, r = .58, p = .04, and spatial attention, r = .60, p =.03, but not with spatial planning, r = .43, p = .15, or spatial working memory, r = .25, p =.42. Regression analyses were performed to determine whether any of these cognitive processes predicted unique variance in figure copy for either patient group after also accounting for MMSE, sex, and age. In bvFTD, only spatial planning accounted for a significant amount of unique variance in figure copy, β = .57, p < .01; spatial perception, β = .31, p = .17, spatial attention, β = −.08, p = .71, and spatial working memory, β = .33, p = .28, were not significant unique predictors. In AD, spatial perception, β = .46, p = .11, spatial attention, β = .31, p = .44, spatial working memory, β = .15, p = .69, and spatial planning, β = .22, p = .55, did not predict a significant amount of unique variance in figure copy.1
Discussion
The results of this study suggest that AD and bvFTD patients fail tests of figure copy because of different anatomical substrates and distinctive cognitive mechanisms. Poor figure copy performance in AD was associated with smaller rPC volumes, but was not associated with rDLPFC volumes. In contrast, in bvFTD, poor figure copy performance was associated with smaller rDLPFC volumes, and there was only a trend for an association with smaller rPC volumes. Right lateral temporal lobe volumes were not significantly associated with performance in either group. None of the three regions of interest correlated with figure copy performance in the controls. The cognitive mechanisms underlying performance deficits on figure copy also differed by diagnostic group, consistent with the different brain regions involved in their performance. In AD, figure copy performance was associated with performance on tests of spatial perception and spatial attention, but not with spatial planning or spatial working memory. In contrast, in bvFTD, figure copy performance was associated with performance on tests of spatial planning and spatial working memory, but not with spatial perception or spatial attention. Spatial planning accounted for significant unique variance in bvFTD figure copy performance even after accounting for performance on the other spatial tests, indicating a particularly important role for this cognitive process.
The results of this study are consistent with the view that bvFTD prominently impacts “top-down” visual processing whereas AD prominently impacts aspects of dorsal stream visual spatial processing that are, in comparison, “bottom-up” (Possin et al., 2010). Bottom-up visual spatial processing follows a set anatomical pathway from the primary visual cortex through the dorsal stream as progressively higher order aspects of visual spatial processing are accomplished (Barton, 1998; Ungerleider & Mishkin, 1982). In AD, although early sensory processing areas in the occipital cortex are relatively spared, higher order sensory areas in the temporal and parietal cortex are targeted early (Boxer, Rankin et al., 2003; Rabinovici et al., 2007; Whitwell et al., 2008); these areas are important for perceiving where the details of a figure are in space and integrating them into a unitary percept (Robertson, 2003). These unitary percepts are then utilized by top-down systems, mediated largely by DLPFC, to achieve behavioral goals via executive processes including selective attention and response planning (Kastner & Ungerleider, 2000; Miller & Cohen, 2001). In the typical case, bvFTD targets the orbitofrontal and medial prefrontal cortex before the DLPFC is significantly involved (Seeley et al., 2008). Orbitofrontal and anterior cingulate volumes were not associated with bvFTD patients’ figure copy performance in this study, which suggests that the impact of the disease on these ventromedial regions of the prefrontal cortex plays a less central role in their top-down visual spatial processing deficits. In contrast, DLPFC volumes strongly predicted performance in bvFTD, suggesting that top-down visual processing deficits may reflect anatomical progression of the disease.
Figure copy tests are the gold standard measure of visual spatial cognition in dementia evaluations; however, the results of this study indicate that figure copy performance relies on distinct neuroanatomical substrates and cognitive mechanisms that are differentially impacted by AD and bvFTD. Based on these findings, we propose alternative methods of assessment. First, insights into the reasons for a patient’s deficit on a multifactorial neuropsychological test can often be determined by analyzing the types of errors made and the strategies used en route to a solution (Kaplan, 1988). Thompson and colleagues (2005) applied this process approach to figure copy and demonstrated that AD patients made more spatial errors and bvFTD patients made more organizational or perseverative errors, although another study did not find reliable strategy and error differences between these groups on figure copy (Gasparini et al., 2008).
Second, visual spatial tests that do not place heavy demands on executive functions should theoretically be more impaired in AD than bvFTD. Consistent with this idea, bvFTD patients generally outperform patients with AD on simple figure copy tests (Diehl & Kurz, 2002; Elfgren et al., 1994; Mendez et al., 1996; Rascovsky et al., 2008; Rascovsky et al., 2002). The Benson Figure used in this study was simple enough to elicit this group difference, although it did require some planning, which impacted the performance of the bvFTD patients. Although one might consider using an even simpler figure copy test that relies even less on top-down visual processing, a simpler test may not be adequately sensitive to mild visual spatial deficits. Tests that specifically measure visual spatial perception or other dorsal visual stream processes should be investigated to determine if they tap the deficits associated with AD but not bvFTD; few studies to date have compared the performance of bvFTD and AD patients on such tests. The Number-Location Test of spatial perception used in this study was associated with figure copy performance in AD but not bvFTD; however, performance on this test did not differ significantly between the groups. Patients with bvFTD may have difficulty on this test because of complex attention or eye movement abnormalities.
Lastly, there is some evidence that bvFTD patients are impaired on measures emphasizing top-down visual spatial processes, for example, visual discrimination learning, the inhibition of spatial attention, and rule violation or perseveration errors (Carey et al., 2008; Chester et al., 2009; Krueger et al., 2009; Possin et al., 2009; Rahman et al., 1999). It is important to account for the integrity of fundamental skills, including bottom-up visual processes, when evaluating top-down control (Pa et al., 2010).
An important consideration when interpreting anatomic – behavior correlations in patients with neurodegenerative disease is whether disease-related atrophy causes performance deficits or whether the atrophy is a proxy for disease severity and does not play a specific role in the behavior. For example, an alternative explanation of the results is that rDLPFC atrophy does not cause figure copy deficits in bvFTD; rather, these variables appear to be related because they are both related to disease severity. We addressed this issue in part by controlling for performance on the MMSE, which is a summary measure of global cognitive functioning. In addition, we examined the relationship between figure copy performance and other brain areas that are known to be early targets of each disease. Correlations were not observed between figure copy performance and either entorhinal cortex or hippocampal volumes in AD or between figure copy performance and either orbitofrontal or anterior cingulate cortex volumes in bvFTD. These results indicate that the rPC and rDLPFC atrophy likely play a role in causing visual spatial deficits in these neurodegenerative diseases.
The results of this study also suggest that rDLPFC and rPC atrophy may not cause figure copy deficits if the atrophy is mild. rDLPFC volumes were reduced in AD compared to controls but to a lesser degree than in bvFTD, and these volumes were not significantly associated with figure copy performance in AD. Similarly, rPC volumes were reduced in bvFTD compared to controls but to a lesser degree than in AD, and there was only a trend for rPC volumes to be associated with figure copy performance in bvFTD. It may be that these reductions were not severe enough to cause significant visuospatial deficits on the figure copy test.
The effects of neurodegenerative diseases on visual spatial cognition depend on topographic patterns of brain pathology, and so it is important that dementia evaluations use anatomically-specific methods for diagnosis and for monitoring disease progression. Figure copy is the current gold standard method for visual spatial assessment in dementia evaluations. AD patients are more likely than bvFTD patients to be impaired on figure copy (as long as the figure is not very complex) and this test is a good screen for visual spatial dysfunction. This test is multifactorial, however, from both an anatomical and cognitive perspective. In AD, poor performance was associated with rPC atrophy and spatial perception and attention impairment, whereas in bvFTD, poor performance was associated with rDLPFC atrophy and spatial planning and working memory impairment. Better methods of visual spatial assessment are needed in dementia evaluations that can measure separately bottom-up and top-down visual processes.
Research highlights.
Figure copy performance in neurodegenerative disease is multifactorial.
In Alzheimer’s disease, figure copy is associated with right parietal cortex volumes and spatial perception and attention.
In the behavioral variant of Frontotemporal dementia, figure copy is associated with right dorsolateral prefrontal cortex volumes and spatial planning and working memory.
Acknowledgments
This work was supported by 2008-A-020-FEL and 2007/2I from the Larry L. Hillblom Foundation and 5 P01 AG019724, 3 P50 AG023501, and 5 R01 AG022983–05 from the National Institute on Aging.
Footnotes
Partial correlations between figure copy and the regions of interest were also computed in this smaller sample of patients who received the visual spatial test assessment. The results were generally consistent with the larger sample. Specifically, in the AD patients, figure copy performance correlated with rPC volumes, r = .64, p = .03, but not rDLPFC volumes, r = .20, p = .53. In the bvFTD patients, figure copy performance correlated with rDLPFC volumes, r = .65, p = .003, but not with rPC volumes, r = .37, p = .12.
Publisher's Disclaimer: This is a PDF file of an unedited manuscript that has been accepted for publication. As a service to our customers we are providing this early version of the manuscript. The manuscript will undergo copyediting, typesetting, and review of the resulting proof before it is published in its final citable form. Please note that during the production process errors may be discovered which could affect the content, and all legal disclaimers that apply to the journal pertain.
References
- Barton JJ. Higher cortical visual function. Curr Opin Ophthalmol. 1998;9(6):40–45. doi: 10.1097/00055735-199812000-00007. [DOI] [PubMed] [Google Scholar]
- Boxer AL, Kramer JH, Du AT, Schuff N, Weiner MW, Miller BL, et al. Focal right inferotemporal atrophy in AD with disproportionate visual constructive impairment. Neurology. 2003;61(11):1485–1491. doi: 10.1212/01.wnl.0000090568.34810.47. [DOI] [PMC free article] [PubMed] [Google Scholar]
- Boxer AL, Rankin KP, Miller BL, Schuff N, Weiner M, Gorno-Tempini ML, et al. Cinguloparietal atrophy distinguishes Alzheimer disease from semantic dementia. Arch Neurol. 2003;60(7):949–956. doi: 10.1001/archneur.60.7.949. [DOI] [PubMed] [Google Scholar]
- Braak H, Braak E. Evolution of neuronal changes in the course of Alzheimer’s disease. J Neural Transm Suppl. 1998;53:127–140. doi: 10.1007/978-3-7091-6467-9_11. [DOI] [PubMed] [Google Scholar]
- Buckner RL, Head D, Parker J, Fotenos AF, Marcus D, Morris JC, et al. A unified approach for morphometric and functional data analysis in young, old, and demented adults using automated atlas-based head size normalization: reliability and validation against manual measurement of total intracranial volume. Neuroimage. 2004;23(2):724–738. doi: 10.1016/j.neuroimage.2004.06.018. [DOI] [PubMed] [Google Scholar]
- Carey CL, Woods SP, Damon J, Halabi C, Dean D, Delis DC, et al. Discriminant validity and neuroanatomical correlates of rule monitoring in frontotemporal dementia and Alzheimer’s disease. Neuropsychologia. 2008;46(4):1081–1087. doi: 10.1016/j.neuropsychologia.2007.11.001. [DOI] [PubMed] [Google Scholar]
- Chester SK, Possin KL, Laluz V, Wurst LM, Miller BL, Kramer JH. The neural correlates of design fluency repetition errors and implications for the diagnosis of Frontotemporal Dementia. Paper presented at the International Neuropsychological Society; Atlanta, GA. 2009. [Google Scholar]
- Choi JS, Kang DH, Kim JJ, Ha TH, Lee JM, Youn T, et al. Left anterior subregion of orbitofrontal cortex volume reduction and impaired organizational strategies in obsessive-compulsive disorder. J Psychiatr Res. 2004;38(2):193–199. doi: 10.1016/j.jpsychires.2003.08.001. [DOI] [PubMed] [Google Scholar]
- de Simone V, Kaplan L, Patronas N, Wassermann EM, Grafman J. Driving abilities in frontotemporal dementia patients. Dement Geriatr Cogn Disord. 2007;23(1):1–7. doi: 10.1159/000096317. [DOI] [PubMed] [Google Scholar]
- deIpolyi AR, Rankin KP, Mucke L, Miller BL, Gorno-Tempini ML. Spatial cognition and the human navigation network in AD and MCI. Neurology. 2007;69(10):986–997. doi: 10.1212/01.wnl.0000271376.19515.c6. [DOI] [PubMed] [Google Scholar]
- Delis DC, Kaplan E, Kramer J. The Delis-Kaplan Executive Function System. The Psychological Corporation; 2001. [Google Scholar]
- Desikan RS, Segonne F, Fischl B, Quinn BT, Dickerson BC, Blacker D, et al. An automated labeling system for subdividing the human cerebral cortex on MRI scans into gyral based regions of interest. Neuroimage. 2006;31(3):968–980. doi: 10.1016/j.neuroimage.2006.01.021. [DOI] [PubMed] [Google Scholar]
- Diehl J, Kurz A. Frontotemporal dementia: patient characteristics, cognition, and behaviour. Int J Geriatr Psychiatry. 2002;17(10):914–918. doi: 10.1002/gps.709. [DOI] [PubMed] [Google Scholar]
- Elfgren C, Brun L, Gustafson L, Johansen A, Minthon L, Passat U, et al. Neuropsychological test as discriminators between dementia of Alzheimer type and frontotemporal dementia. International Journal of Geriatric Psychiatry. 1994;9:635–642. [Google Scholar]
- Ernst J, Krapp S, Schuster T, Forstl H, Kurz A, Diehl-Schmid J. Car driving ability of patients with frontotemporal lobar degeneration and Alzheimer’s disease. Nervenarzt. 2007;81(1):79–85. doi: 10.1007/s00115-009-2847-5. [DOI] [PubMed] [Google Scholar]
- Forster S, Teipel S, Zach C, Rominger A, Cumming P, Fougere C, et al. FDG-PET mapping the brain substrates of visuo-constructive processing in Alzheimer’s disease. J Psychiatr Res. 44(7):462–469. doi: 10.1016/j.jpsychires.2009.09.012. [DOI] [PubMed] [Google Scholar]
- Freeman RQ, Giovannetti T, Lamar M, Cloud BS, Stern RA, Kaplan E, et al. Visuoconstructional problems in dementia: contribution of executive systems functions. Neuropsychology. 2000;14(3):415–426. doi: 10.1037//0894-4105.14.3.415. [DOI] [PubMed] [Google Scholar]
- Frisoni GB, Pizzolato G, Geroldi C, Rossato A, Bianchetti A, Trabucchi M. Dementia of the frontal type: neuropsychological and [99Tc]-HM-PAO SPET features. J Geriatr Psychiatry Neurol. 1995;8(1):42–48. [PubMed] [Google Scholar]
- Gasparini M, Masciarelli G, Vanacore N, Ottaviani D, Salati E, Talarico G, et al. A descriptive study on constructional impairment in frontotemporal dementia and Alzheimer’s disease. Eur J Neurol. 2008;15(6):589–597. doi: 10.1111/j.1468-1331.2008.02128.x. [DOI] [PubMed] [Google Scholar]
- Hamilton L, Fay S, Rockwood K. Misplacing objects in mild to moderate Alzheimer’s disease: a descriptive analysis from the VISTA clinical trial. J Neurol Neurosurg Psychiatry. 2009;80(9):960–965. doi: 10.1136/jnnp.2008.166801. [DOI] [PubMed] [Google Scholar]
- Haxby JV, Grady CL, Koss E, Horwitz B, Heston L, Schapiro M, et al. Longitudinal study of cerebral metabolic asymmetries and associated neuropsychological patterns in early dementia of the Alzheimer type. Arch Neurol. 1990;47(7):753–760. doi: 10.1001/archneur.1990.00530070043010. [DOI] [PubMed] [Google Scholar]
- Hernandez MT, Sauerwein HC, Jambaque I, de Guise E, Lussier F, Lortie A, et al. Attention, memory, and behavioral adjustment in children with frontal lobe epilepsy. Epilepsy Behav. 2003;4(5):522–536. doi: 10.1016/j.yebeh.2003.07.014. [DOI] [PubMed] [Google Scholar]
- Ishii K, Kawachi T, Sasaki H, Kono AK, Fukuda T, Kojima Y, et al. Voxel-based morphometric comparison between early- and late-onset mild Alzheimer’s disease and assessment of diagnostic performance of z score images. AJNR Am J Neuroradiol. 2005;26(2):333–340. [PMC free article] [PubMed] [Google Scholar]
- Kaplan E. Clinical Neuropsychology and Brain Function: Research, Measurement, and Practice: American Psychological Association. 1988. A process approach to neuropsychological assessment. [Google Scholar]
- Kastner S, Ungerleider LG. Mechanisms of visual attention in the human cortex. Annu Rev Neurosci. 2000;23:315–341. doi: 10.1146/annurev.neuro.23.1.315. [DOI] [PubMed] [Google Scholar]
- Kramer JH, Jurik J, Sha SJ, Rankin KP, Rosen HJ, Johnson JK, et al. Distinctive neuropsychological patterns in frontotemporal dementia, semantic dementia, and Alzheimer disease. Cogn Behav Neurol. 2003;16(4):211–218. doi: 10.1097/00146965-200312000-00002. [DOI] [PubMed] [Google Scholar]
- Krueger CE, Bird AC, Growdon ME, Jang JY, Miller BL, Kramer JH. Conflict monitoring in early frontotemporal dementia. Neurology. 2009 doi: 10.1212/WNL.0b013e3181b04b24. in press. [DOI] [PMC free article] [PubMed] [Google Scholar]
- Lindau M, Almkvist O, Johansson SE, Wahlund LO. Cognitive and behavioral differentiation of frontal lobe degeneration of the non-Alzheimer type and Alzheimer’s disease. Dement Geriatr Cogn Disord. 1998;9(4):205–213. doi: 10.1159/000017048. [DOI] [PubMed] [Google Scholar]
- McKhann G, Drachman D, Folstein M, Katzman R, Price D, Stadlan EM. Clinical diagnosis of Alzheimer’s disease: report of the NINCDS-ADRDA Work Group under the auspices of Department of Health and Human Services Task Force on Alzheimer’s Disease. Neurology. 1984;34(7):939–944. doi: 10.1212/wnl.34.7.939. [DOI] [PubMed] [Google Scholar]
- McMonagle P, Deering F, Berliner Y, Kertesz A. The cognitive profile of posterior cortical atrophy. Neurology. 2006;66(3):331–338. doi: 10.1212/01.wnl.0000196477.78548.db. [DOI] [PubMed] [Google Scholar]
- Mega MS, Thompson PM, Cummings JL, Back CL, Xu ML, Zohoori S, et al. Sulcal variability in the Alzheimer’s brain: correlations with cognition. Neurology. 1998;50(1):145–151. doi: 10.1212/wnl.50.1.145. [DOI] [PubMed] [Google Scholar]
- Mendez MF, Cherrier M, Perryman KM, Pachana N, Miller BL, Cummings JL. Frontotemporal dementia versus Alzheimer’s disease: differential cognitive features. Neurology. 1996;47(5):1189–1194. doi: 10.1212/wnl.47.5.1189. [DOI] [PubMed] [Google Scholar]
- Miller EK, Cohen JD. An integrative theory of prefrontal cortex function. Annu Rev Neurosci. 2001;24:167–202. doi: 10.1146/annurev.neuro.24.1.167. [DOI] [PubMed] [Google Scholar]
- Monacelli AM, Cushman LA, Kavcic V, Duffy CJ. Spatial disorientation in Alzheimer’s disease: the remembrance of things passed. Neurology. 2003;61(11):1491–1497. doi: 10.1212/wnl.61.11.1491. [DOI] [PubMed] [Google Scholar]
- Neary D, Snowden JS, Gustafson L, Passant U, Stuss D, Black S, et al. Frontotemporal lobar degeneration: a consensus on clinical diagnostic criteria. Neurology. 1998;51(6):1546–1554. doi: 10.1212/wnl.51.6.1546. [DOI] [PubMed] [Google Scholar]
- Nestor PJ, Caine D, Fryer TD, Clarke J, Hodges JR. The topography of metabolic deficits in posterior cortical atrophy (the visual variant of Alzheimer’s disease) with FDG-PET. J Neurol Neurosurg Psychiatry. 2003;74(11):1521–1529. doi: 10.1136/jnnp.74.11.1521. [DOI] [PMC free article] [PubMed] [Google Scholar]
- Pa J, Possin KL, Wilson SM, Quintania LC, Kramer JH, Boxer AL, et al. Gray matter correlates of set-shifting among neurodegenerative disease, mild cognitive impairment, and healthy older adults. Journal of the International Neuropsychological Society. 2010 doi: 10.1017/S1355617710000408. in press. [DOI] [PMC free article] [PubMed] [Google Scholar]
- Pachana NA, Boone KB, Miller BL, Cummings JL, Berman N. Comparison of neuropsychological functioning in Alzheimer’s disease and frontotemporal dementia. J Int Neuropsychol Soc. 1996;2(6):505–510. doi: 10.1017/s1355617700001673. [DOI] [PubMed] [Google Scholar]
- Pai MC, Jacobs WJ. Topographical disorientation in community-residing patients with Alzheimer’s disease. Int J Geriatr Psychiatry. 2004;19(3):250–255. doi: 10.1002/gps.1081. [DOI] [PubMed] [Google Scholar]
- Perry RJ, Graham A, Williams G, Rosen H, Erzinclioglu S, Weiner M, et al. Patterns of frontal lobe atrophy in frontotemporal dementia: a volumetric MRI study. Dement Geriatr Cogn Disord. 2006;22(4):278–287. doi: 10.1159/000095128. [DOI] [PubMed] [Google Scholar]
- Perry RJ, Hodges JR. Differentiating frontal and temporal variant frontotemporal dementia from Alzheimer’s disease. Neurology. 2000;54(12):2277–2284. doi: 10.1212/wnl.54.12.2277. [DOI] [PubMed] [Google Scholar]
- Possin KL. Visual spatial cognition in neurodegenerative disease. Neurocase. 2010:1–22. doi: 10.1080/13554791003730600. [DOI] [PMC free article] [PubMed] [Google Scholar]
- Possin KL, Brambati SM, Rosen HJ, Johnson JK, Pa J, Weiner MW, et al. Rule violation errors are associated with right lateral prefrontal cortex atrophy in neurodegenerative disease. J Int Neuropsychol Soc. 2009;15(3):354–364. doi: 10.1017/S135561770909050X. [DOI] [PMC free article] [PubMed] [Google Scholar]
- Rabinovici GD, Seeley WW, Kim EJ, Gorno-Tempini ML, Rascovsky K, Pagliaro TA, et al. Distinct MRI atrophy patterns in autopsy-proven Alzheimer’s disease and frontotemporal lobar degeneration. Am J Alzheimers Dis Other Demen. 2007;22(6):474–488. doi: 10.1177/1533317507308779. [DOI] [PMC free article] [PubMed] [Google Scholar]
- Rahman S, Sahakian BJ, Hodges JR, Rogers RD, Robbins TW. Specific cognitive deficits in mild frontal variant frontotemporal dementia. Brain. 1999;122 ( Pt 8):1469–1493. doi: 10.1093/brain/122.8.1469. [DOI] [PubMed] [Google Scholar]
- Rascovsky K, Salmon DP, Hansen LA, Galasko D. Distinct cognitive profiles and rates of decline on the Mattis Dementia Rating Scale in autopsy-confirmed frontotemporal dementia and Alzheimer’s disease. J Int Neuropsychol Soc. 2008;14(3):373–383. doi: 10.1017/S135561770808051X. [DOI] [PMC free article] [PubMed] [Google Scholar]
- Rascovsky K, Salmon DP, Ho GJ, Galasko D, Peavy GM, Hansen LA, et al. Cognitive profiles differ in autopsy-confirmed frontotemporal dementia and AD. Neurology. 2002;58(12):1801–1808. doi: 10.1212/wnl.58.12.1801. [DOI] [PubMed] [Google Scholar]
- Robertson LC. Binding, spatial attention and perceptual awareness. Nat Rev Neurosci. 2003;4(2):93–102. doi: 10.1038/nrn1030. [DOI] [PMC free article] [PubMed] [Google Scholar]
- Seeley WW, Crawford R, Rascovsky K, Kramer JH, Weiner M, Miller BL, et al. Frontal paralimbic network atrophy in very mild behavioral variant frontotemporal dementia. Arch Neurol. 2008;65(2):249–255. doi: 10.1001/archneurol.2007.38. [DOI] [PMC free article] [PubMed] [Google Scholar]
- Teipel SJ, Willoch F, Ishii K, Burger K, Drzezga A, Engel R, et al. Resting state glucose utilization and the CERAD cognitive battery in patients with Alzheimer’s disease. Neurobiol Aging. 2006;27(5):681–690. doi: 10.1016/j.neurobiolaging.2005.03.015. [DOI] [PubMed] [Google Scholar]
- Thompson JC, Stopford CL, Snowden JS, Neary D. Qualitative neuropsychological performance characteristics in frontotemporal dementia and Alzheimer’s disease. J Neurol Neurosurg Psychiatry. 2005;76(7):920–927. doi: 10.1136/jnnp.2003.033779. [DOI] [PMC free article] [PubMed] [Google Scholar]
- Ungerleider LG, Mishkin M. Two cortical visual systems. In: Goodale MA, Ingle DJ, Mansfield RJW, editors. Analysis of visual behavior. Cambridge, MA: M.I.T. Press; 1982. [Google Scholar]
- Varma AR, Snowden JS, Lloyd JJ, Talbot PR, Mann DM, Neary D. Evaluation of the NINCDS-ADRDA criteria in the differentiation of Alzheimer's disease and frontotemporal dementia. J Neurol Neurosurg Psychiatry. 1999;66(2):184–188. doi: 10.1136/jnnp.66.2.184. [DOI] [PMC free article] [PubMed] [Google Scholar]
- Warrington EK, James M. The visual object and space perception battery. Bury St. Edmonds, Suffolk, England: Thames Valley Test Company; 1991. [Google Scholar]
- Wechsler D. The Wechsler Memory Scale-III. San Antonio, TX: The Psychological Corporation; 1997. [Google Scholar]
- Whitwell JL, Jack CR, Jr, Kantarci K, Weigand SD, Boeve BF, Knopman DS, et al. Imaging correlates of posterior cortical atrophy. Neurobiol Aging. 2007;28(7):1051–1061. doi: 10.1016/j.neurobiolaging.2006.05.026. [DOI] [PMC free article] [PubMed] [Google Scholar]
- Whitwell JL, Shiung MM, Przybelski SA, Weigand SD, Knopman DS, Boeve BF, et al. MRI patterns of atrophy associated with progression to AD in amnestic mild cognitive impairment. Neurology. 2008;70(7):512–520. doi: 10.1212/01.wnl.0000280575.77437.a2. [DOI] [PMC free article] [PubMed] [Google Scholar]