Abstract
Background
During a previous clinical trial of a closed-loop blood glucose (BG) control system that administered insulin and microdose glucagon subcutaneously, glucagon was not uniformly effective in preventing hypoglycemia (BG <70 mg/dl). After a global adjustment of control algorithm parameters used to model insulin absorption and clearance to more closely match insulin pharmacokinetic (PK) parameters observed in the study cohort, administration of glucagon by the control system was more effective in preventing hypoglycemia. We evaluated the role of plasma insulin and plasma glucagon levels in determining whether glucagon was effective in preventing hypoglycemia.
Methods
We identified and analyzed 36 episodes during which glucagon was given and categorized them as either successful or unsuccessful in preventing hypoglycemia.
Results
In 20 of the 36 episodes, glucagon administration prevented hypoglycemia. In the remaining 16, BG fell below 70 mg/dl (12 of the 16 occurred during experiments performed before PK parameters were adjusted). The (dimensionless) levels of plasma insulin (normalized relative to each subject’s baseline insulin level) were significantly higher during episodes ending in hypoglycemia (5.2 versus 3.7 times the baseline insulin level, p = .01). The relative error in the control algorithm’s online estimate of the instantaneous plasma insulin level was also higher during episodes ending in hypoglycemia (50 versus 30%, p = .003), as were the peak plasma glucagon levels (183 versus 116 pg/ml, p = .007, normal range 50–150 pg/ml) and mean plasma glucagon levels (142 versus 75 pg/ml, p = .02). Relative to mean plasma insulin levels, mean plasma glucagon levels tended to be 59% higher during episodes ending in hypoglycemia, although this result was not found to be statistically significant (p = .14). The rate of BG descent was also significantly greater during episodes ending in hypoglycemia (1.5 versus 1.0 mg/dl/min, p = .02).
Conclusions
Microdose glucagon administration was relatively ineffective in preventing hypoglycemia when plasma insulin levels exceeded the controller’s online estimate by >60%. After the algorithm PK parameters were globally adjusted, insulin dosing was more conservative and microdose glucagon administration was very effective in reducing hypoglycemia while maintaining normal plasma glucagon levels. Improvements in the accuracy of the controller’s online estimate of plasma insulin levels could be achieved if ultrarapid-acting insulin formulations could be developed with faster absorption and less intra- and intersubject variability than the current insulin analogs available today.
Keywords: artificial endocrine pancreas, bihormonal, blood glucose, counterregulatory hormone, hypoglycemia, insulin pump, type 1 diabetes
Introduction
Near-normal blood glucose (BG) control can largely reduce the microvascular complications of type 1 diabetes.1,2 Unfortunately, it is very difficult, if not impossible, to achieve the degree of control required (a hemoglobin A1c less than ∼7%) without the occurrence of potentially dangerous hypoglycemia. Moreover, the self-care tasks required to maintain near-normal glycemia are extremely demanding, adversely affecting the quality of life of people with type 1 diabetes. The availability of insulin pumps and continuous glucose monitors has made feasible systems that can automatically deliver insulin in response to frequent BG measurements and thereby approximate normal pancreatic beta cell function in type 1 diabetes. Automated delivery of insulin is projected to reduce the mean BG by responding promptly to hyperglycemic excursions.3–8 However, as mean BG levels are lowered, the risk of overadministration of insulin by automated delivery systems increases, in part owing to the delayed absorption of insulin delivered subcutaneously. Earlier studies testing automated subcutaneous insulin delivery systems in experiments lasting 24 hours or more reported multiple episodes of hypoglycemia in several subjects.4,5
The normally functioning pancreas releases glucagon from the alpha cells in response to dietary secretagogues, such as amino acids, and to hypoglycemia.9 Glucagon potently opposes the effects of insulin in the liver. Unfortunately, the responsiveness of glucagon secretion to hypoglycemia is progressively lost in people with type 1 diabetes.10–12 In order to create an artificial endocrine pancreas for the outpatient setting that fully replaces the glycemic regulatory functions of the normal pancreas, combining automated glucagon delivery with an automated insulin delivery system seems logical.13–16 The inclusion of glucagon as a counterregulatory hormone should reduce hypoglycemia and eliminate or reduce the need to ingest extra carbohydrates to prevent or treat hypoglycemia.
We have developed an artificial endocrine pancreas that delivers insulin automatically in response to frequent BG measurements.13–15 Even with rapid-acting insulin analogs, there remains a significant delay between subcutaneous insulin administration and the appearance of insulin in the blood stream. Unless a closed-loop system takes account of insulin already delivered but not yet in the blood stream, excess delivery of insulin is inevitable. Our system therefore incorporates a pharmacokinetic (PK) model for the absorption and clearance of insulin to reduce the risk of overdosing by insulin “stacking,” which arises from the administration of extra insulin when sufficient insulin is already in the subcutaneous space but has not yet been absorbed into the blood.
Glucagon has been utilized as a counterregulatory hormone in artificial pancreas systems in the in-patient setting.17–19 Whereas earlier such systems administered insulin and glucagon intravenously, our artificial endocrine pancreas, first tested in diabetic swine,13,14 administers insulin and glucagon subcutaneously (through standard insulin infusion sets) and thus offers the potential for bihormonal closed-loop control in the outpatient setting. Glucagon is approved to treat severe hypoglycemia, and is typically used when patients are unresponsive and cannot treat themselves with oral carbohydrates. The relatively large doses of glucagon used clinically for this purpose (typically 1 mg) are given intramuscularly with the goal of raising BG enough for the patient to regain consciousness and take oral carbohydrates. Unfortunately, such high doses of glucagon may cause nausea and vomiting. The aim of using microdoses of glucagon in our artificial endocrine pancreas is to prevent or treat hypoglycemia by achieving levels similar to those achieved by the normal pancreas in response to hypoglycemia, which are not associated with nausea or vomiting.
We performed a pilot clinical trial to test our bihormonal artificial pancreas in subjects with type 1 diabetes and no residual insulin secretion.15 The rate of insulin lispro absorption varied widely between subjects in this trial, and in some cases was two to three times slower than would be expected based on published literature.20 We found that individuals with slower lispro PK were more likely to develop hypoglycemia and require extra carbohydrates despite the administration of glucagon by the control system. We hypothesized that this was due to insulin “stacking” because the control algorithm was not accurately estimating plasma insulin levels in subjects with substantially slower lispro PK than was assumed by the algorithm. To test this hypothesis, we made a global adjustment in control algorithm parameters governing the PK model of insulin absorption so that slower insulin absorption was assumed. In repeat closed- loop BG control experiments in the same subjects, no subject required extra carbohydrates. This result strongly suggested that the failure of glucagon to prevent hypo-glycemia in the first set of experiments was not due to glucagon resistance in these subjects, but was the result of the microdoses of administered glucagon being overwhelmed by excess insulin. We concluded that with an appropriate global adjustment of the control algorithm PK parameters to better represent our study cohort, it was possible to achieve safe closed-loop BG control with a bihormonal artificial endocrine pancreas.
The success of the global adjustment of the control algorithm’s insulin PK parameters in preventing the need for carbohydrate interventions suggested that accumulation of excess insulin in the blood had been responsible for the failures of glucagon to prevent hypo-glycemia. However, in the earlier study we did not quantitatively assess the relative roles of insulin and glucagon levels in the success or failure of glucagon. In this article, we identify isolated intervals in which glucagon was given by the control system to prevent hypoglycemia, and present an analysis of several factors that could be determinants of the success or failure of microdose glucagon administration under closed-loop control. The factors analyzed include the rate of BG descent toward hypoglycemia, the mean plasma insulin levels, the error in the controller’s online estimate of mean plasma insulin, the mean and peak plasma glucagon levels, and the ratio of glucagon to insulin levels.
Materials and Methods
The design and execution of the clinical trial have been described in detail elsewhere.15 Briefly, adult subjects with negligible residual C-peptide secretion after a mixed meal and who used pump therapy to manage their diabetes were treated with the bihormonal artificial endocrine pancreas for 27 hours in the clinical research center setting. They received three large carbohydrate-rich meals, the size of which was determined by their body weight and gender. No snacks were allowed. Venous BG was measured every 5 minutes. Hypoglycemia was defined as a BG less than 70 mg/dl. Subjects were given extra carbohydrates to treat hypoglycemia if their BG fell below 70 mg/dl and they had symptoms or if their BG was below 60 mg/dl for four consecutive measurements or below 50 mg/dl for two consecutive measurements. Additional carbohydrate intervention was given if needed, as described in the protocol.
The closed-loop BG control system consisted of a blood glucose monitor (GlucoScout, International Biomedical, Austin, TX), insulin pumps (Deltec Cozmo®, Smiths Medical MDPM, St. Paul, MN) for subcutaneous infusion of insulin lispro (HumaLog®, Eli Lilly and Company, Indianapolis, IN) and Glucagon® (Eli Lilly), and software to run our mathematical control algorithm, which was implemented in MATLAB® (The MathWorks Inc., Natick, MA) running on a laptop computer (Apple Inc., Cupertino, CA). Insulin dosing was governed by a customized model predictive control (MPC) algorithm, whereas glucagon dosing was determined using a customized proportional- derivative (PD) strategy. The PD control algorithm operated independently of the MPC algorithm and did not utilize information about controller-estimated plasma insulin levels. The mathematical formulation of the control algorithms used have been detailed elsewhere.13,15
In this study, we identified 36 episodes in which glucagon was given by the closed-loop system in an attempt to prevent hypoglycemia. These “glucagon episodes” were defined as beginning when BG fell below 120 mg/dl (starting with the BG value just before BG fell below 120 mg/dl) or when BG began a descent from a plateau between 70 and 120 mg/dl. Episodes were defined as terminating after some time interval, Δt, when BG either stopped falling or began to rise when BG was >70 mg/dl (hypoglycemia prevented) or when BG fell below 70 mg/dl (hypoglycemia occurred). For each glucagon episode, we estimated the rate of BG descent, ΔBG/Δt, the mean and maximum plasma glucagon levels, the mean plasma insulin levels relative to baseline, the error in the mean plasma insulin levels predicted online by the closed-loop control algorithm relative to the measured plasma insulin levels, and the ratio between the plasma glucagon to insulin levels. Episodes were grouped according to whether or not BG fell below 70 mg/dl.
We estimate the rate of BG descent, ΔBG/Δt, with the ratio of the change in BG from the beginning to the end of each glucagon episode over the time interval, Δt, associated each episode. Thus,
| (1) |
where t0 and tN correspond, respectively, to the time points at the beginning and end of each glucagon episode. We estimate the mean plasma levels (measured and controller-estimated values for insulin and measured values for glucagon) as the ratio of the approximated integral of the instantaneous plasma levels over the time interval, Δt, associated each episode. Each integral is approximated by the discrete summation of the instantaneous plasma levels over Δt. The least-squares fit to the measured plasma insulin and glucagon levels,15 rather than the actual measured plasma levels, were used when forming these summations. The method for obtaining the least-squares fit to the measured plasma insulin and glucagon levels has been described in detail elsewhere.15 If we denote the instantaneous measured plasma glucagon and insulin levels as gp(t) and ip(t), respectively, and the instantaneous controller-estimated plasma insulin level as ie(t), then for a particular glucagon episode, we calculate the corresponding mean values, Ḡp, Īp, and Īe, as
| (2) |
| (3) |
| (4) |
where δt is the sampling interval. We further normalize Īp and Īe with their baseline values to form the dimensionless quantities Īp* = Īp/(baseline ip) and Īe* = Īe/(baseline ie), where baseline ip and baseline ie correspond, respectively, to the baseline values of ip(t) and ie(t), i.e., to the levels attained only due to nominal basal insulin administration far from any insulin bolus. Normalization to baseline values is necessary because many subjects had high titers of antiinsulin antibodies. Antibody interference in the immunometric insulin assay had the effect of shifting the measured values of plasma insulin upward without significantly altering the shape of the insulin-versus-time curve. This was confirmed by comparing free and total insulin levels in separate PK studies of selected subjects (data not shown). Free insulin levels were determined after precipitation of immuno-globulins with polyethylene glycol.21
Results
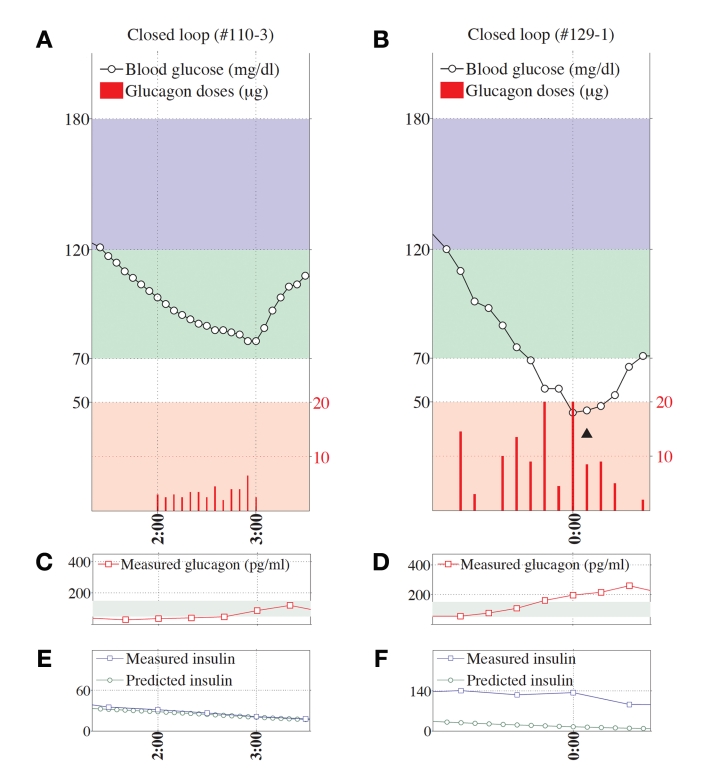
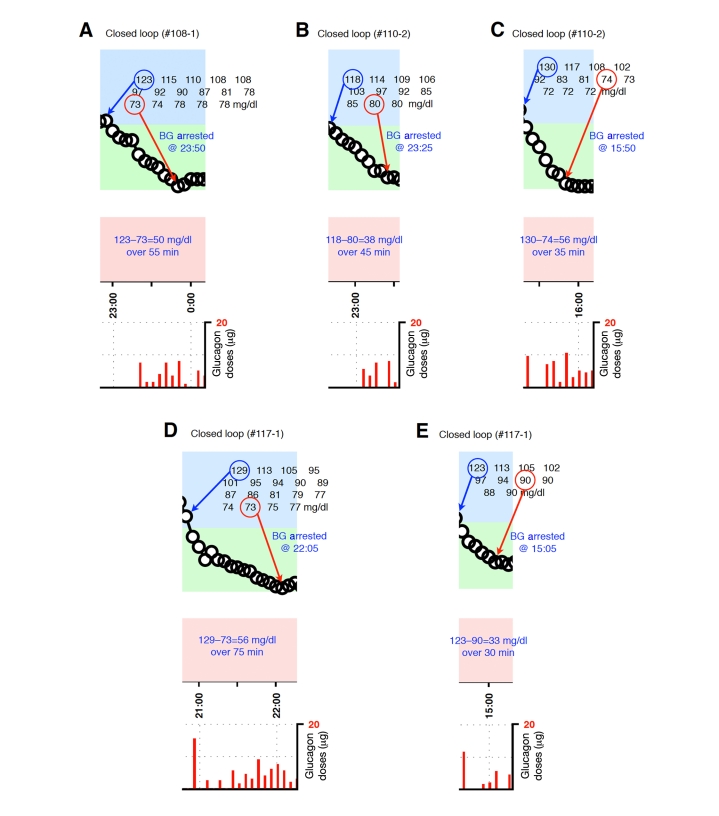
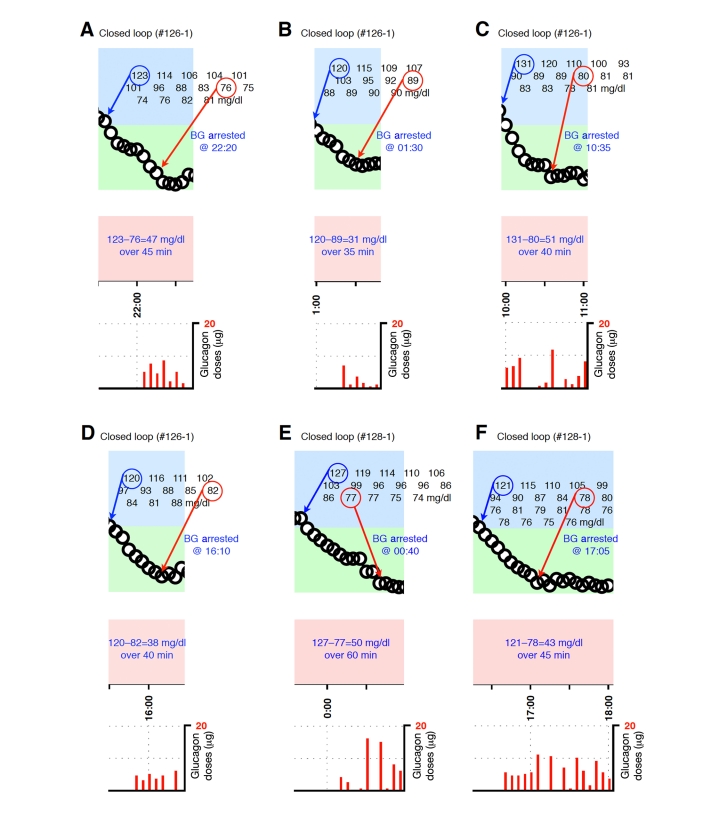
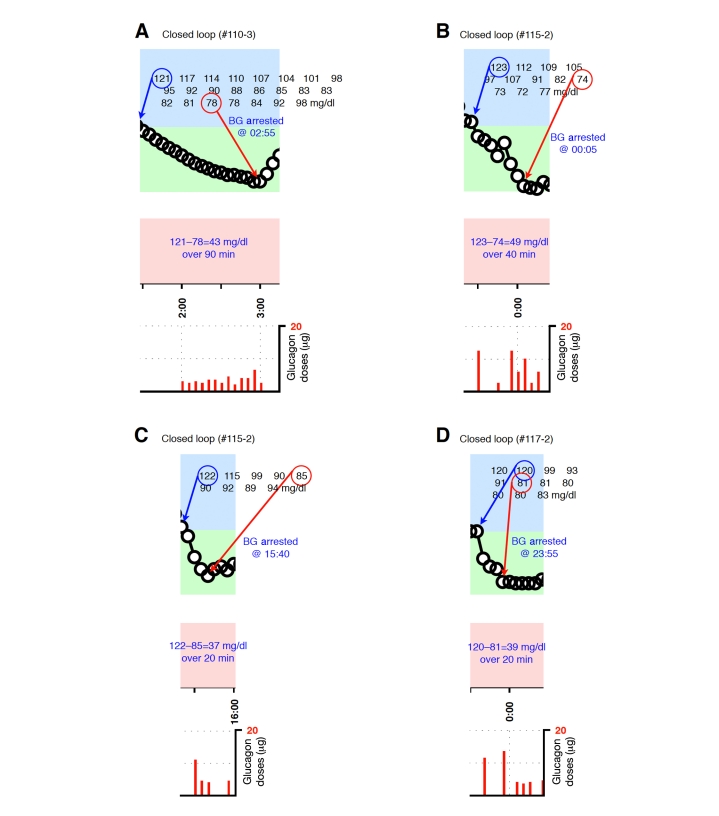
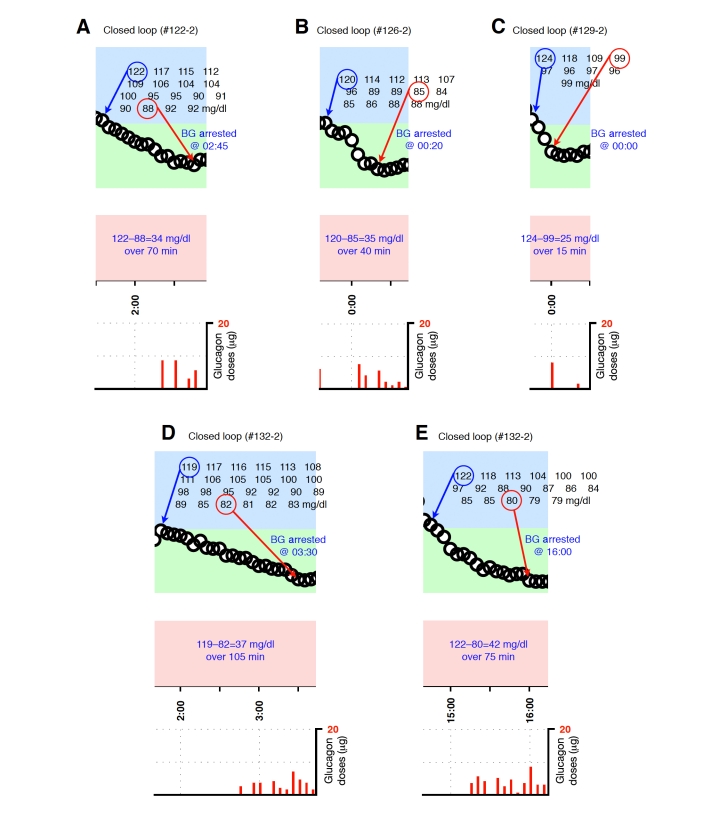
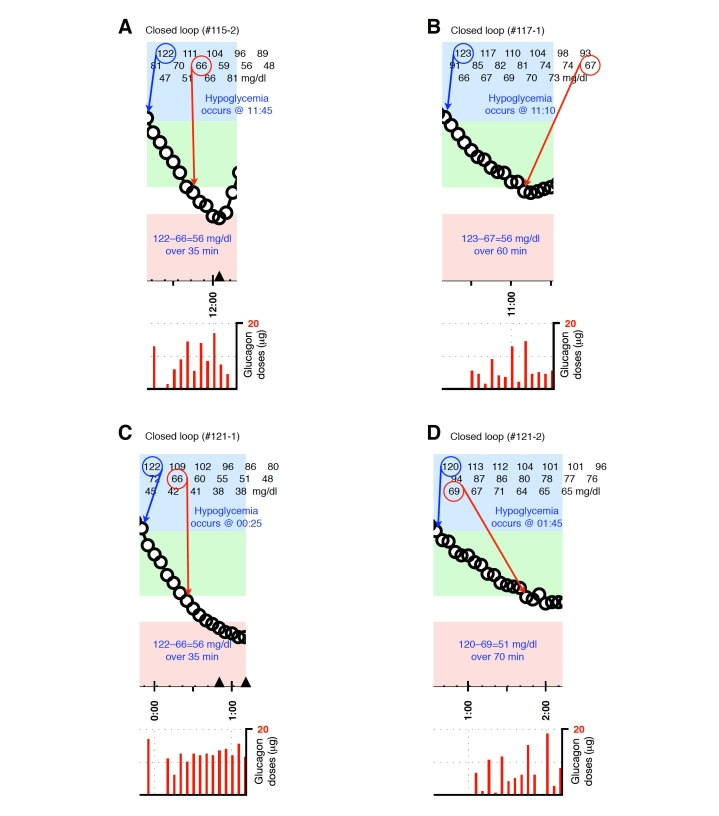
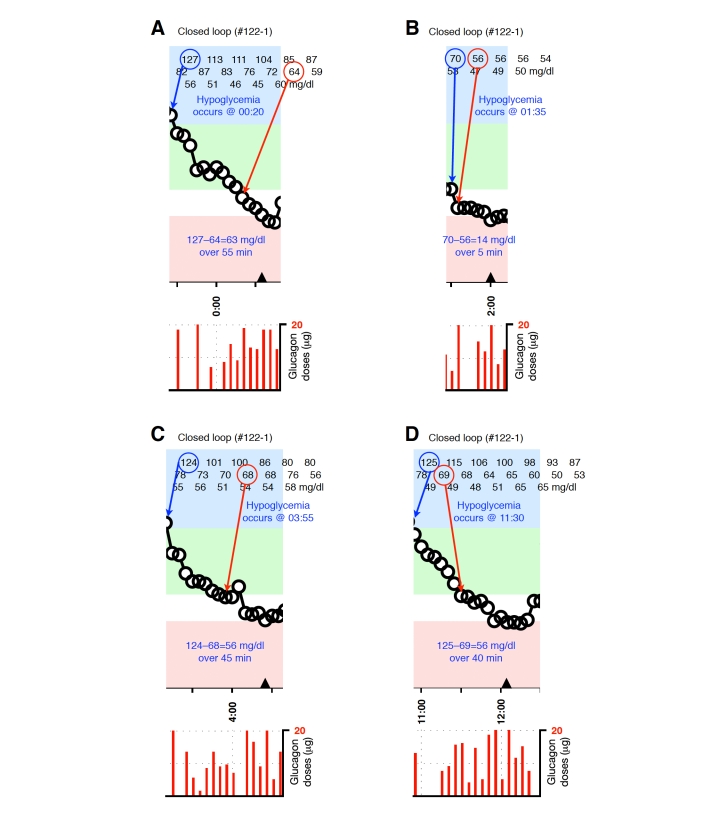
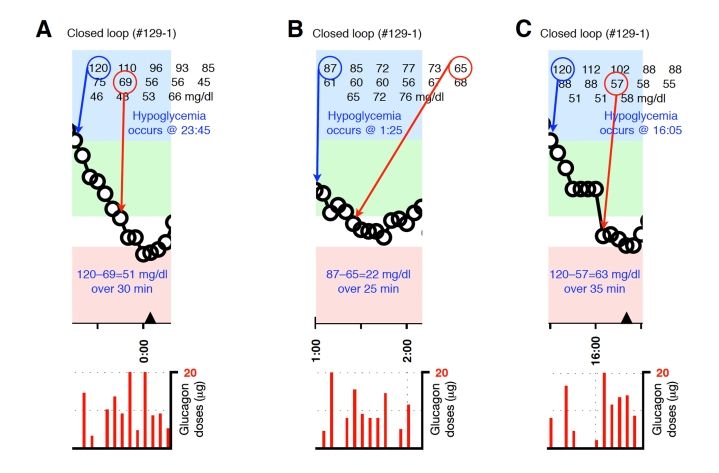
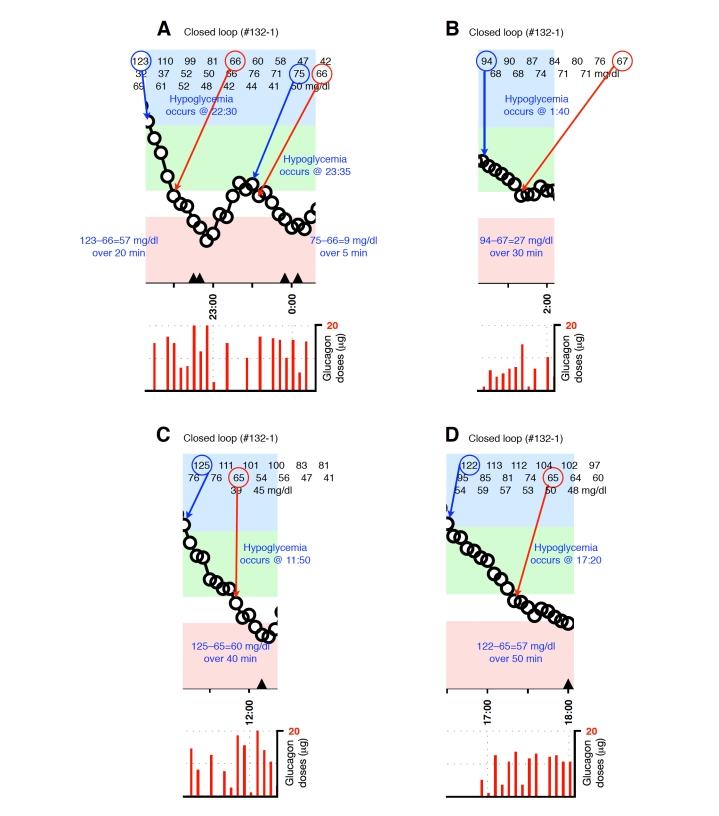
Representative glucagon episodes, as defined above, are shown in Figure 1 for one subject in whom BG remained above 70 mg/dl and another in whom BG fell below 70 mg/dl. Shown below the BG trace for each of these cases are the corresponding plasma insulin and plasma glucagon levels as a function of time. Blood-glucose traces corresponding to each of the 36 glucagon episodes that were identified are shown in Appendix A. In 20 instances (herein referred to as “glucagon successes,” see Figures A1–A4), BG did not fall below 70 mg/dl andin 16 instances (herein referred to as “glucagon failures,” see Figures A5–A8), BG did fall below 70 mg/dl. Carbohydrate intervention was required per protocol in 12 of the 16 instances of glucagon failure (these 12 instances occurred before the control algorithm’s PK parameters were globally adjusted to better match the insulin PK parameters observed in the study cohort).
Figure 1.
Two representative episodes are shown, one for a case when glucagon dosing was effective in preventing hypoglycemia (A, C, and E) and another for a case when glucagon dosing failed to prevent hypoglycemia (B, D, and F). Shown in both cases are the BG data segment and corresponding glucagon doses (A and B, respectively), the corresponding measured plasma-glucagon levels (C and D, respectively), and the corresponding measured and controller-predicted plasma-insulin levels (E and F, respectively). Note the strong agreement between the measured and controller-predicted plasma-insulin levels in E. In contrast, there was a substantial disparity between the measured and predicted insulin levels in F, which was arguably the leading cause of hypoglycemia in that case, despite the larger glucagon doses (red bars) in B relative to A and the significantly higher plasma-glucagon levels in D relative to C. The position of the triangle in B corresponds to the location along the timeline of a 15-g carbohydrate intervention for hypoglycemia. The episode shown in B, D, and F occurred during an experiment in which the control algorithm assumed fast PK parameter settings. Blood glucose was measured every 5 minutes.
Summary statistics from analyzing each of these episodes is given in Table 1. A statistically significant difference was found to exist between the success and failure groups in the rate of decrease in BG, ΔBG/Δt (1.03 ± 0.45 versus 1.50 ± 0.62 mg/dl/min, p = .02), and in the measured plasma insulin relative to baseline, Īp* (3.7 ± 1.1 versus 5.2 ± 2.0, p = .01). There was significant reduction in ΔBG/Δt after the first dose of glucagon, both in episodes ending in success (1.54 ± 0.99 versus 0.82 ± 0.38 mg/dl/min, p = .006) and failure (2.24 ± 1.06 versus 1.33 ± 0.62 mg/dl/min, p = .03), showing that glucagon did have an effect, albeit insufficient, on the BG trajectory even in the failures. Also significant was the difference found between the success and failure groups in the error, |(Īp* – Īe*)/Īp*|, in the controller’s online estimate of the mean plasma insulin level relative to the measured mean plasma insulin level for each episode (30 ± 17 versus 50 ± 21%, p = .003). With only two exceptions, the error in the controller’s estimate of the mean plasma insulin level in each of the failure episodes was ≥30%, which was greater than the average error found for the success group. There were only two episodes in the success group where the error was found to exceed the average error of 50% found for the failure group (in these episodes the error was found to be 54 and 60%).
Table 1.
Summary of Glucagon Action Results for 36 Glucagon Episodes During Closed-loop Controla
| Study ID | ΔBG/Δt (mg/dl/min) | max gp(t) (pg/ml)b | Ḡp (pg/ml)c | Īp*d | Īe*e | |(Īp* – Īe*)/Īp*| | Ḡp*/Īp* (pg/ml) |
|---|---|---|---|---|---|---|---|
| Successes | |||||||
| 108-1 | 0.91 | 115.3 | 51.2 | 4.89 | 2.65 | 0.46 | 10.47 |
| 110-2 | 0.84 | 51.2 | 34.9 | 4.62 | 2.11 | 0.54 | 7.55 |
| 110-2 | 1.60 | 117.5 | 74.4 | 4.75 | 3.44 | 0.28 | 15.66 |
| 117-1 | 0.75 | 195.7 | 135.5 | 3.78 | 2.27 | 0.40 | 35.85 |
| 117-1 | 1.10 | 93.6 | 73.8 | 4.13 | 3.92 | 0.05 | 17.87 |
| 126-1 | 1.04 | 153.7 | 64.5 | 5.18 | 2.06 | 0.60 | 12.45 |
| 126-1 | 0.89 | 99.3 | 57.4 | 3.23 | 2.90 | 0.10 | 17.77 |
| 126-1 | 1.28 | 191.8 | 135.0 | 4.99 | 3.93 | 0.21 | 27.05 |
| 126-1 | 0.95 | 147.9 | 72.1 | 3.58 | 2.06 | 0.42 | 20.14 |
| 128-1 | 0.83 | 105.5 | 68.9 | 3.25 | 1.63 | 0.50 | 21.20 |
| 128-1 | 0.96 | 108.8 | 72.6 | 2.74 | 1.94 | 0.29 | 26.50 |
| 110-3 | 0.48 | 89.8 | 49.1 | 1.91 | 1.86 | 0.03 | 25.71 |
| 115-2 | 1.23 | 108.1 | 76.0 | 4.56 | 2.28 | 0.50 | 16.67 |
| 115-2 | 1.85 | 76.9 | 58.0 | 4.64 | 3.43 | 0.26 | 12.50 |
| 117-2 | 1.95 | 159.6 | 137.3 | 3.83 | 2.84 | 0.26 | 35.85 |
| 122-2 | 0.49 | 75.3 | 49.0 | 2.52 | 1.51 | 0.40 | 19.44 |
| 126-2 | 0.88 | 70.0 | 50.0 | 1.93 | 2.31 | 0.20 | 25.91 |
| 129-2 | 1.67 | 74.9 | 74.9 | 4.55 | 3.60 | 0.21 | 16.46 |
| 132-2 | 0.35 | 129.7 | 75.2 | 1.71 | 1.53 | 0.11 | 43.98 |
| 132-2 | 0.56 | 153.9 | 87.6 | 3.17 | 3.47 | 0.09 | 27.63 |
| Mean | 1.03 | 115.9 | 74.9 | 3.70 | 2.59 | 0.30 | 21.83 |
| SD | 0.45 | 40.4 | 29.2 | 1.10 | 0.80 | 0.17 | 9.29 |
| Failures | |||||||
| 115-2 | 1.60 | 125.6 | 79.3 | 6.82 | 3.33 | 0.51 | 11.63 |
| 117-1 | 0.93 | 171.7 | 82.4 | 3.77 | 2.64 | 0.30 | 21.86 |
| 121-1 | 1.60 | 226.2 | 152.7 | 9.96 | 3.46 | 0.65 | 15.33 |
| 121-2 | 0.73 | 204.7 | 130.6 | 3.79 | 2.44 | 0.36 | 34.46 |
| 122-1 | 1.15 | 166.3 | 96.3 | 5.21 | 2.70 | 0.48 | 18.48 |
| 122-1 | 2.80 | 311.8 | 308.7 | 4.67 | 1.00 | 0.79 | 66.10 |
| 122-1 | 1.24 | 285.5 | 261.1 | 3.60 | 1.07 | 0.70 | 72.53 |
| 122-1 | 1.40 | 102.5 | 65.1 | 3.70 | 3.38 | 0.09 | 17.59 |
| 129-1 | 1.70 | 99.6 | 71.8 | 7.37 | 2.91 | 0.61 | 9.74 |
| 129-1 | 0.88 | 273.8 | 268.9 | 5.36 | 1.00 | 0.81 | 50.17 |
| 129-1 | 1.80 | 100.6 | 75.7 | 6.15 | 3.19 | 0.48 | 12.31 |
| 132-1 | 2.85 | 91.5 | 51.8 | 7.08 | 4.05 | 0.43 | 7.32 |
| 132-1 | 1.80 | 324.9 | 318.9 | 3.99 | 1.00 | 0.75 | 79.92 |
| 132-1 | 0.90 | 225.3 | 199.1 | 1.78 | 1.00 | 0.44 | 111.85 |
| 132-1 | 1.50 | 114.8 | 69.3 | 6.68 | 3.72 | 0.44 | 10.37 |
| 132-1 | 1.14 | 103.0 | 45.2 | 3.41 | 2.72 | 0.20 | 13.26 |
| Mean | 1.50 | 183.0 | 142.3 | 5.21 | 2.48 | 0.50 | 34.56 |
| SD | 0.62 | 82.8 | 96.8 | 2.04 | 1.10 | 0.21 | 31.84 |
| p value | .02 | .007 | .02 | .01 | .74 | .003 | .14 |
Plotted segments of individual events are provided in Figures A1–A8 in the Appendix.
Maximum measured plasma glucagon level, gp(t), in interval Δt.
Mean measured plasma glucagon level, gp(t), over interval Δt (see Equation 2).
Mean measured plasma insulin level, ip(t), over interval Δt (see Equation 3) normalized to baseline value corresponding to ip(t).
Mean controller-estimated plasma insulin level, ie(t), over interval Δt (see Equation 4) normalized to baseline value corresponding to ie(t).
The plasma glucagon levels were found to be significantly lower on average in the success group than in the failure group, both in terms of the mean values for each episode (75 ± 29 versus 142 ± 97 pg/ml, p = .02) and the maximum values for each episode (116 ± 40 versus 183 ± 83 pg/ml, p = .007). In fact, the relative difference in Ḡp* between the success and failure groups was greater on average than the relative difference in Īp* such that the ratio Ḡp*/Īp* was lower on average in the success group than in the failure group (22 ± 9 versus 35 ± 32, p = .14), although this result was not found to be statistically significant.
El-Khatib and Russell, et al.15 noted that the average across all 11 subjects in the time-to-peak plasma glucagon concentration after a single bolus was 23 ± 9 minutes. However, only rarely was a single glucagon bolus sufficient to arrest a descent in BG. Typically, successive glucagon doses were required (see Figure 1). From a clinical standpoint, it is important to know the average time required to arrest or reverse a descent in BG starting from the moment the first glucagon bolus was administered by the controller. In our success group, this average time was found to be 27 ± 14 minutes. Combining these results, and noting that the controller responded to BG every 5 minutes, one can estimate that on average, only two microdoses of glucagon were required to stop or reverse a descent in BG whenever the controller succeeded in estimating plasma insulin levels with an error of less than ∼30%.
Discussion
Our primary conclusion is that glucagon successfully prevents hypoglycemia in closed-loop control when the control algorithm accurately estimates plasma insulin levels (with an error on average of ∼30%, but not greater than ∼60%) at the time of incipient hypoglycemia. When such accuracy can be achieved, insulin dosing by the controller typically results in lower plasma insulin levels during glucagon episodes than when the controller underestimates plasma insulin levels by more than ∼50%. This conclusion is consistent with our earlier finding that hypoglycemia could be eliminated by altering closed-loop algorithm parameters to assume slower insulin absorption, which more closely matched the actual insulin PK observed in our study cohort. This global parameter adjustment had the effect of reducing the aggressiveness of insulin administration by the control algorithm and reducing the total amount of insulin each subject received.
Subjects in our trial were consuming carbohydrate-rich meals three times daily, which the control system treated with sufficient insulin to return BG to the normal range. We therefore assume that the liver was replete with glycogen stores and lack of liver glycogen was not responsible for the glucagon failures that we observed. Sufficiently large doses of glucagon could presumably have prevented most, if not all, of the hypoglycemic events that we observed. However, the goal for any artificial endocrine pancreas that uses glucagon should be to regulate BG safely without hypoglycemia while maintaining plasma glucagon levels as close as possible to the normal range. The requirement that plasma glucagon remain at near-normal levels during normal operation constrains the system to use glucagon economically, which, in turn, requires therapeutically precise and appropriate insulin dosing by the controller to the extent possible in light of the observed intersubject variability in insulin absorption rates.15
It is noteworthy that mean plasma glucagon levels remained in the normal range (50–150 pg/ml) for all the episodes during which glucagon was successful in preventing hypoglycemia. In fact, peak plasma glucagon levels remained in the normal range for all but five episodes in the success group, and remained below 200 pg/ml in these five exceptions. In contrast, both the mean and peak plasma glucagon levels frequently exceeded 150 pg/ml in the failure group. In all but three episodes, the peak plasma glucagon levels exceeded 150 pg/ml, and in five episodes by approximately two-fold or more. The higher glucagon levels in the failure group are not surprising because the control algorithm administered more glucagon in an (unsuccessful) attempt to prevent hypoglycemia. However, this finding does demonstrate that there was no defect in glucagon delivery or absorption during the episodes resulting in hypoglycemia.
The higher glucagon levels during episodes ending in hypoglycemia suggest that the dose response curves for insulin and glucagon interact such that a ratio of glucagon to insulin that is sufficient at low insulin levels is insufficient at higher levels. This effect could arise because the liver is rich in glucagon receptors, which are absent in skeletal muscle and fat. At higher insulin levels, there may be a greater proportion of glucose uptake by muscle, which is insensitive to glucagon, and therefore a proportionally greater effect on liver must be achieved to balance muscle uptake of glucose. In this study, we did not measure physiological variables that would be required to clarify this issue, such as glucose absorption from the gut and fluxes of glucose into and out of the liver, skeletal muscle, and adipose tissue.
Our experience with the use of glucagon as a counter-regulatory hormone for closed-loop BG control demonstrates the promise of this approach. After a global adjustment of the control algorithm’s insulin PK parameter settings, subcutaneous microdoses of glucagon issued by the control system helped prevent carbohydrate-requiring interventions (nadir BG with slow PK settings was 64 mg/dl). However, to meet its potential, glucagon must be stable in solution. Commercially available glucagon formulations are currently approved only for rescue therapy and are reconstituted at the time of use. Glucagon is unstable in these formulations and forms fibrils over hours to days.22–24 Despite this reported instability, we showed in an earlier study that commercial glucagon preparations show no diminution of antihypoglycemic effect in insulin pumps worn by diabetic pigs for up to 7 days.25 Similarly, in the present study, insulin pump reservoirs were filled with reconstituted glucagon at the beginning of each experiment and the glucagon was apparently effective for the entire 27-hour duration of the experiment. Regardless, in order for glucagon to be approved as part of an artificial endocrine pancreas, a formulation that is stable in pump reservoirs without fibrillation for at least 3 days must become available.
In conclusion, we found that the success of glucagon in preventing hypoglycemia was closely related to the concordance between the actual and controller-estimated plasma insulin levels as well as to the absolute magnitude of actual plasma insulin levels. Glucagon was more effective when insulin levels were lower, and hypoglycemia could be prevented with levels of insulin and glucagon that were in the physiologic range. When plasma insulin levels were excessive, even plasma glucagon levels above the physiologic range were not effective in preventing hypo-glycemia. For microdose glucagon to consistently prevent hypoglycemia while maintaining plasma glucagon levels in the physiologic range, control algorithms must accurately estimate plasma insulin levels within ∼30%. More accurate online estimation of plasma insulin levels by the controller will result in less aggressive insulin dosing and lower prevailing insulin levels when BG falls toward the hypoglycemic range in the postprandial period. Such improved accuracy could be achieved if ultrarapid-acting insulin formulations could be developed with faster absorption and less intra- and intersubject variability than the current insulin analogs available today.
Acknowledgements
The authors Steven J. Russell, M.D., Ph.D., and Firas H. El-Khatib, Ph.D. share equal responsibility for this work.
We thank the volunteers for their time and enthusiasm, the nurses and laboratory staff of the Massachusetts General Hospital’s Clinical Research Center, especially K. Hall and K. Grinke, for their dedicated effort and careful execution of the experimental protocol; R. Sutherlin, M. Larkin, R. Pompei, E. Nicholson, G. Winning, N. Kingori, and J. Jiang for organizational and logistical support; and J. Moy and P. Sluss of the Massachusetts General Hospital’s Reproductive Endocrine Laboratory for performing insulin and glucagon assays. We thank E. Harvey of CarioMed Device Consultants for advice on regulatory compliance issues. R. Pope and M. Blomquist of Smiths Medical provided insulin pumps and technical advice. J. Segars and K. Malinger of International Biomedical provided GlucoScout monitors and technical assistance in their use.
Abbreviations
- (BG)
blood glucose
- (MPC)
model predictive control
- (PD)
proportional derivative
- (PK)
pharmacokinetic
Appendix A.
Figure A1.
Blood-glucose traces around individual glucagon episodes (successes) from closed-loop control experiment #108-1 (A), #110-2 (B and C),and #117-1 (D and E). Corresponding glucagon doses are shown at the bottom of each panel. The episodes shown in A, D, and E occurred during an experiment in which the control algorithm was configured with fast PK parameter settings. Blood glucose was measured every 5 minutes.
Figure A2.
Blood-glucose traces around individual glucagon episodes (successes) from closed-loop control experiment #126-1 (A–D) and #128-1 (E and F). Corresponding glucagon doses are shown at the bottom of each panel. The episodes shown in A–F occurred during an experiment in which the control algorithm was configured with fast PK parameter settings. Blood glucose was measured every 5 minutes.
Figure A3.
Blood-glucose traces around individual glucagon episodes (successes) from closed-loop control experiment #110-3 (A), #115-2 (B and C), and #117-2 (D). Corresponding glucagon doses are shown at the bottom of each panel. The episodes shown in B and C occurred during an experiment in which the control algorithm was configured with fast PK parameter settings. Blood glucose was measured every 5 minutes.
Figure A4.
Blood-glucose traces around individual glucagon episodes (successes) from closed-loop control experiment #122-2 (A), #126-2 (B), #129-2 (C), and #132-2 (D and E). Corresponding glucagon doses are shown at the bottom of each panel. Blood glucose was measured every 5 minutes.
Figure A5.
Blood-glucose traces around individual glucagon episodes (failures) from closed-loop control experiment #115-2 (A), #117-1 (B), #121-1 (C) and #121-2 (D). The locations along the timeline of the triangles in A and C correspond to 15-g carbohydrate interventions for hypoglycemia. Corresponding glucagon doses are shown at the bottom of each panel. The episodes shown in A–C occurred during experiments in which the control algorithm was configured with fast PK parameter settings. Blood glucose was measured every 5 minutes.
Figure A6.
Blood-glucose traces around four individual glucagon episodes (failures) from closed-loop control experiment #122-1 (A–D). The locations along the timeline of the triangles in A–D correspond to 15-g carbohydrate interventions for hypoglycemia. Corresponding glucagon doses are shown at the bottom of each panel. The episodes shown in A–D occurred during an experiment in which the control algorithm was configured with fast PK parameter settings. Blood glucose was measured every 5 minutes.
Figure A7.
Blood-glucose traces around three individual glucagon episodes (failures) from closed-loop control experiment #129-1 (A–C). The locations along the timeline of the triangles in A and C correspond to 15-g carbohydrate interventions for hypoglycemia. Corresponding glucagon doses are shown at the bottom of each panel. The episodes shown in A–C occurred during an experiment in which the control algorithm was configured with fast PK parameter settings. Blood glucose was measured every 5 minutes.
Figure A8.
Blood-glucose traces around five individual glucagon episodes (failures) from closed-loop control experiment #132-1 (A–D). The locations along the timeline of the triangles in A, C, and D correspond to 15-g carbohydrate interventions for hypoglycemia. Corresponding glucagon doses are shown at the bottom of each panel. The episodes shown in A–D occurred during an experiment in which the control algorithm was configured with fast PK parameter settings. Blood glucose was measured every 5 minutes.
References
- 1.The Diabetes Control and Complications Trial Research Group (DCCT) The effect of intensive treatment of diabetes on the development and progression of long-term complications in insulin dependent diabetes mellitus. N Engl J Med. 1993;329(14):977–986. doi: 10.1056/NEJM199309303291401. [DOI] [PubMed] [Google Scholar]
- 2.Ray KK, Seshasai SR, Wijesuriya S, Sivakumaran R, Nethercott S, Preiss D, Erqou S, Sattar N. Effect of intensive control of glucose on cardiovascular outcomes and death in patients with diabetes mellitus: a meta-analysis of randomised controlled trials. Lancet. 2009;373(9677):1765–1772. doi: 10.1016/S0140-6736(09)60697-8. [DOI] [PubMed] [Google Scholar]
- 3.Sternberg F, Meyerhoff C, Mennel FJ, Bischof F, Pfeiffer EF. Subcutaneous glucose concentration in humans. Real estimation and continuous monitoring. Diabetes Care. 1995;18(9):1266–1269. doi: 10.2337/diacare.18.9.1266. [DOI] [PubMed] [Google Scholar]
- 4.Steil GM, Rebrin K, Darwin C, Hariri F, Saad MF. Feasibility of automating insulin delivery for the treatment of type 1 diabetes. Diabetes. 2006;55(12):3344–3350. doi: 10.2337/db06-0419. [DOI] [PubMed] [Google Scholar]
- 5.Weinzimer S, Steil GM, Swan KL, Dziura J, Kurtz N, Tamborlane WV. Fully automated closed-loop insulin delivery versus semiautomated hybrid control in pediatric patients with type 1 diabetes using an artificial pancreas. Diabetes Care. 2008;31(5):934–939. doi: 10.2337/dc07-1967. [DOI] [PubMed] [Google Scholar]
- 6.Bruttomesso D, Farret A, Costa S, Marescotti MC, Vettore M, Avogaro A, Tiengo A, Dalla Man C, Place J, Facchinetti A, Guerra S, Magni L, De Nicolao G, Cobelli C, Renard E, Maran A. Closed-loop artificial pancreas using subcutaneous glucose sensing and insulin delivery and a model predictive control algorithm: preliminary studies in Padova and Montpellier. J Diabetes Sci Technol. 2009;3(5):1014–1021. doi: 10.1177/193229680900300504. [DOI] [PMC free article] [PubMed] [Google Scholar]
- 7.Clarke WL, Anderson S, Breton M, Patek S, Kashmer L, Kovatchev B. Closed-loop artificial pancreas using subcutaneous glucose sensing and insulin delivery and a model predictive control algorithm: the Virginia experience. J Diabetes Sci Technol. 2009;3(5):1031–1038. doi: 10.1177/193229680900300506. [DOI] [PMC free article] [PubMed] [Google Scholar]
- 8.Hovorka R, Allen JM, Elleri D, Chassin LJ, Harris J, Xing D, Kollman C, Hovorka T, Larsen AM, Nodale M, De Palma A, Wilinska ME, Acerini CL, Dunger DB. Manual closed-loop insulin delivery in children and adolescents with type 1 diabetes: a phase 2 randomised crossover trial. Lancet. 2010;375(9716):743–751. doi: 10.1016/S0140-6736(09)61998-X. [DOI] [PubMed] [Google Scholar]
- 9.Quesada I, Tudurí E, Ripoll C, Nadal A. Physiology of the pancreatic alpha-cell and glucagon secretion: role in glucose homeostasis and diabetes. J Endocrinol. 2008;199(1):5–19. doi: 10.1677/JOE-08-0290. [DOI] [PubMed] [Google Scholar]
- 10.Cherrington AD. Banting Lecture 1997. Control of glucose uptake and release by the liver in vivo. Diabetes. 1999;48(5):1198–1214. doi: 10.2337/diabetes.48.5.1198. [DOI] [PubMed] [Google Scholar]
- 11.Gerich JE, Langlois M, Noacco C, Karam J, Forsham PH. Lack of a glucagon response to hypoglycemia in diabetes: evidence for an intrinsic pancreatic alpha-cell defect. Science. 1973;182(108):171–173. doi: 10.1126/science.182.4108.171. [DOI] [PubMed] [Google Scholar]
- 12.Cryer PE. Hypoglycaemia: the limiting factor in the glycaemic management of type I and type II diabetes. Diabetologia. 2002;45(7):937–938. doi: 10.1007/s00125-002-0822-9. [DOI] [PubMed] [Google Scholar]
- 13.El-Khatib FH, Jiang J, Damiano ER. Adaptive closed-loop control provides blood-glucose regulation using dual subcutaneous insulin and glucagon infusion in diabetic swine. J Diabetes Sci Technol. 2007;1(2):181–192. doi: 10.1177/193229680700100208. [DOI] [PMC free article] [PubMed] [Google Scholar]
- 14.El-Khatib FH, Jiang J, Damiano ER. A feasibility study of bihormonal closed-loop blood glucose control using dual subcutaneous infusion of insulin and glucagon in ambulatory diabetic swine. J Diabetes Sci Technol. 2009;3(4):789–803. doi: 10.1177/193229680900300428. [DOI] [PMC free article] [PubMed] [Google Scholar]
- 15.El-Khatib FH, Russell SJ, Nathan DM, Sutherlin RG, Damiano ER. A bihormonal closed-loop artificial pancreas for type 1 diabetes. Sci Transl Med. 2010;2(27):27ra27. doi: 10.1126/scitranslmed.3000619. [DOI] [PMC free article] [PubMed] [Google Scholar]
- 16.Castle JR, Engle JM, El Youssef J, Massoud RG, Yuen KC, Kagan R, Ward WK. Novel use of glucagon in a closed-loop system for prevention of hypoglycemia in type 1 diabetes. Diabetes Care. 2010;33(6):1282–1287. doi: 10.2337/dc09-2254. [DOI] [PMC free article] [PubMed] [Google Scholar]
- 17.Marliss EB, Murray FT, Stokes EF, Zinman B, Nakhooda AF, Denoga A, Leibel BS, Albisser AM. Normalization of glycemia in diabetes during meals with insulin and glucagon delivery by the artificial pancreas. Diabetes. 1977;26(7):663–672. doi: 10.2337/diab.26.7.663. [DOI] [PubMed] [Google Scholar]
- 18.Goriya Y, Kawamori R, Shichiri M, Abe H. The development of an artificial beta cell system and its validation in depancreatized dogs: the physiological restoration of blood glucose homeostasis. Med Prog Technol. 1979;6(3):99–108. [PubMed] [Google Scholar]
- 19.Shichiri M, Kawamori R, Yamasaki Y, Hakui N, Abe H. Wearable artificial endocrine pancreas with needle-type glucose sensor. Lancet. 1982;2(8308):1129–1131. doi: 10.1016/s0140-6736(82)92788-x. [DOI] [PubMed] [Google Scholar]
- 20.Hirsch IB. Insulin analogues. N Engl J Med. 2005;352(2):174–183. doi: 10.1056/NEJMra040832. [DOI] [PubMed] [Google Scholar]
- 21.Arnqvist H, Olsson PO, von Schenck H. Free and total insulin as determined after precipitation with polyethylene glycol: analytical characteristics and effects of sample handling and storage. Clin Chem. 1987;33(1):93–96. [PubMed] [Google Scholar]
- 22.Chabenne JR, DiMarchi MA, Gelfanov VM, DiMarchi RD. Optimization of the native glucagon sequence for medicinal purposes. J Diabetes Sci Technol. 2010;4(6):1322–1331. doi: 10.1177/193229681000400605. [DOI] [PMC free article] [PubMed] [Google Scholar]
- 23.Steiner SS, Li M, Hauser R, Pohl P. Stabilized glucagon formulation for bihormonal pump use. J Diabetes Sci Technol. 2010;4(6):1332–1337. doi: 10.1177/193229681000400606. [DOI] [PMC free article] [PubMed] [Google Scholar]
- 24.Ward WK, Massoud RG, Szybala CJ, Engle JM, El Youssef J, Carroll JM, Roberts CT, DiMarchi RD. In vitro and in vivo evaluation of native glucagon and glucagon analog (MAR-D28) during aging: lack of cytotoxicity and preservation of hyperglycemic effect. J Diabetes Sci Technol. 2010;4(6):1311–1321. doi: 10.1177/193229681000400604. [DOI] [PMC free article] [PubMed] [Google Scholar]
- 25.El-Khatib FH, Jiang J, Gerrity RG, Damiano ER. Pharmacodynamics and stability of subcutaneously infused glucagon in a type 1 diabetic swine model in vivo. Diabetes Technol Ther. 2007;9(2):135–144. doi: 10.1089/dia.2006.0006. [DOI] [PubMed] [Google Scholar]


