

Abstract
Background
For automated prevention of hypoglycemia, there is a need for glucagon (or an analog) to be sufficiently stable so that it can be indwelled in a portable pump for at least 3 days. However, under some conditions, solutions of glucagon can form amyloid fibrils. Currently, the usage instructions for commercially available glucagon allow only for its immediate use.
Methods
In NIH 3T3 fibroblasts, we tested amyloid formation and cytotoxicity of solutions of native glucagon and the glucagon analog MAR-D28 after aging under different conditions for 5 days. In addition, aged native glucagon was subjected to size-exclusion chromatography (SEC). We also studied whether subcutaneous aged Novo Nordisk GlucaGen® would have normal bioactivity in octreotide-treated, anesthetized, nondiabetic pigs.
Results
We found no evidence of cytotoxicity from native glucagon or MAR-D28 (up to 2.5 mg/ml) at a pH of 10 in a glycine solvent. We found a mild cytotoxicity for both compounds in Tris buffer at pH 8.5. A high concentration of the commercial glucagon preparation (GlucaGen) caused marked cytotoxicity, but low pH and/or a high osmolarity probably accounted primarily for this effect. With SEC, the decline in monomeric glucagon over time was much lower when aged in glycine (pH 10) than when aged in Tris (pH 8.5) or in citrate (pH 3). Congo red staining for amyloid was very low with the glycine preparation (pH 10). In the pig studies, the hyperglycemic effect of commercially available glucagon was preserved despite aging conditions associated with marked amyloid formation.
Conclusions
Under certain conditions, aqueous solutions of glucagon and MAR-D28 are stable for at least 5 days and are thus very likely to be safe in mammals. Glycine buffer at a pH of 10 appears to be optimal for avoiding cytotoxicity and amyloid fibril formation.
Keywords: amyloid, cell culture, cytotoxicity, diabetes, glucagon
Introduction
Glucagon has a tendency to form amyloid fibrils in aqueous solutions during aging1 and aged preparations have been reported to be cytotoxic to NIH 3T3 fibroblasts in culture.2 Nonetheless, for use in a dual hormone artificial pancreas setting,3,4 there is a need for glucagon or a suitable analog to be sufficiently stable so that it can be indwelled in a portable pump for at least 3 days. Currently, the FDA-approved instructions for commercially available glucagon allow only for immediate usage of glucagon after the powder is reconstituted in aqueous solution.
In this study, we were interested in whether aging at different pH values and solvents would reduce cyto-toxicity in fibroblast cell culture and the tendency toward amyloid formation. We were particularly interested in studying the alkaline range in addition to the more commonly utilized acidic range. Since glucagon is minimally soluble, the neutral range is not suitable for storage after aqueous reconstitution.
To avoid misattribution of toxicity to glucagon per se, we were also interested in understanding the specific effects of pH and osmolarity on cytotoxicity in the fibroblasts, especially because we knew that some of the earlier studies did not adequately address these issues.
We also sought to address the bioactivity of amyloid-rich aged glucagon solutions in nondiabetic pigs, since earlier data from our group5 and the Boston University group6 suggested that aged solutions might have greater bioactivity that one might expect. To understand the pharmacokinetic effects of aged glucagon in these animals, we also collected periodic serum samples for measurement of glucagon during these studies.
Materials and Methods
Cytotoxicity Measurements in Cell Culture
Studies assessing the potential cytotoxic effects of native glucagon and MAR-D28, a synthetic analog (Marcadia Biotech Inc., Carmel, IN), employed NIH 3T3 cells cultured in Dulbecco’s modified Eagle’s medium (DMEM) (Invitrogen, Carlsbad, CA) and 10% fetal bovine serum (FBS) (Invitrogen) in a 37 °C incubator set at 5% CO2 and 95% humidity. The creation of MAR-D28 is described in detail in another article in this symposium.7 Cytotoxicity was examined after cultured cells were exposed either to native glucagon or MAR-D28 , both of which were either freshly prepared or aged in aqueous solution for varying lengths of time at different concentrations. Two types of native glucagon preparations were studied: a lactose-rich commercial preparation of glucagon hydrochloric acid (HCl) (GlucaGen®, Novo Nordisk A/S, Princeton, NJ) and a lactose-free glucagon preparation (described later).
Study of Commercially-Available Lactose-Rich Glucagon
Twenty-four hours prior to glucagon exposure, cells were seeded at approximately 1–2 × 10⁴ cells per well in 96-well plates (Corning Inc., Lowell, MA) with DMEM, which was supplemented with 10% FBS and 2 μM insulin. Immediately prior to glucagon exposure, the media was replaced with serum-free DMEM. The glucagon HCl mixture (GlucaGen) was received freeze-dried and was a generous gift from Novo Nordisk A/S. GlucaGen is enriched with lactose, and when reconstituted with water to the FDA-approved concentration of 1 mg/ml, is designed to yield a pH of approximately 3.
The GlucaGen mixture was reconstituted with sterile water in order to create concentrations of 5.0 mg/ml, 1.0 mg/ml, 0.5 mg/ml, 0.3 mg/ml, and 0.1 mg/ml. All concentrations were allowed to age for 0, 1, 2, and 7 days in a tissue culture incubator. NIH 3T3 cells were then treated with each aged glucagon preparation for 24 hours before cytotoxicity tests were carried out. Each glucagon preparation was added to the wells as a 1:1 ratio of glucagon and DMEM. In addition, the commercial 1.0 mg/ml preparation of GlucaGen was assayed for amyloid with Congo red immediately after reconstitution and after 4 hours, 1 day, 3 days, and 5 days of aging at 37 °C. A description of the Congo red procedure is given later in this article. This reconstitution was carried out in sterile water according to the manufacturer’s instructions.
A cell lysis solution composed of acetic acid and ethanol was used as the positive control for cytotoxicity and DMEM alone was the negative control. Lactate dehydro-genase (LDH) release was used to measure cell death8 (Roche Cell Death Kit, Roche Applied Science, Inc., Indianapolis, IN). In this assay, 120 μl of the reaction mixture (a mixture of diaphorase/nicotinic acid dinucleotide, iodotetrazolium chloride, and sodium lactate) was placed into each well. The plate was then incubated for 30 minutes at room temperature away from direct light. Absorbance at 492 nm with a reference wavelength of 690 nm was measured using a SpectraMax M5 spectrophotometer (Molecular Devices Inc., Sunnyvale, CA).
For some studies, cell viability was measuring using a Cell Proliferation Reagent WST-1 (Roche Applied Science, Inc., Indianapolis, IN), which is based upon the cleavage of water-soluble tetrazolium-1 (WST-1) to formazan.9 After cells were exposed to a 1:1 ratio of glucagon and DMEM for 24 hours, 12 μl of WST-1 reagent was added to each well. The plate was then incubated for 3 hours in a 37 °C incubator at 5% CO2 and 95% humidity, and absorbance was then measured as described earlier at 450 nm with a reference wavelength of 690 nm.
Studies of Lactose-Free Glucagon and MAR-D28
Twenty-four hours prior to glucagon exposure, cells were seeded at approximately 1–2 × 10⁴ cells/well in 96-well plates in DMEM supplemented with 10% FBS and 2 μM insulin. Immediately prior to glucagon exposure, all media was replaced with serum-free DMEM. Lyophilized synthetic glucagon (Sigma-Aldrich Product #G2044, St. Louis, MO) and lyophilized MAR-D28 glucagon analog were studied.
Both native glucagon and MAR-D28 were reconstituted with sterile phosphate-buffered saline (PBS), pH 7.4; 20 mM Tris buffer, pH 8.5; and 20 mM glycine buffer, pH 10. After buffer solutions were prepared and adjusted to specific pH levels, they were filtered through a 0.22 μm sterile MilliporeTM syringe (Millipore Corp., Billerica, MA) before use. Three concentrations of glucagon or MAR-D28 were prepared: 2.5 mg/ml, 1.0 mg/ml, and 0.3 mg/ml. All concentrations were allowed to age for 0, 3, and 5 days in a tissue culture incubator. The 3T3 cells were then treated with each aged glucagon preparation for 24 hours before cytotoxicity tests were carried out.
After glucagon was added to DMEM, the resulting pH value for the GlucaGen (at an original concentration of 5 mg/ml) was 6.55 and for the original concentration of 1 mg/ml was 7.49. For the lactose-free glucagon (2.5 mg/ml original concentration), the resulting pH was 8.15 for Tris and 8.84 for glycine.
To avoid hypotonicity of the glucagon-DMEM solutions, the DMEM was supplemented with sodium chloride (NaCl) for the Tris and glycine solutions, so that the final osmolarity fell in the range of 320–350 mOsm/kg. Both native glucagon and MAR-D28 were clearly insoluble (yielding a precipitate) in PBS, and, for this reason, cytotoxicity results are not reported for PBS-buffered glucagon or MAR-D28.
pH Study
A pH study was carried out to assess the direct effect of pH on cytotoxicity in NIH 3T3 cells. Serum-free DMEM was used as the test solution. The pH of the DMEM was adjusted using HCl and sodium hydroxide (both from Sigma-Aldrich, St. Louis, MO). In order to assess cytotoxicity, pH values of 10.0, 8.5, 7.6, 6.5, 5.0, 4.0, and 3.0 were used. All pH solutions were prepared the day of use. Twenty-four hours prior to exposure to the pH treatments, cells were seeded at approximately 1–2 × 10⁴ cells/well in 96-well plates with DMEM supplemented with 10% FBS and 2 μM insulin. Immediately prior to exposure to the various pH solutions, all media was removed from the cells. The pH treatments were then added to the cells and incubated at 37 °C for 24 hours. The WST-1 assay was used to assess cytotoxicity and viability.
Osmolarity Study
In order to determine effects of osmolarity on cell viability, osmolarities of 85, 170, 340, 685, 855, and 1030 mOsm were tested. The lower osmolarities of 85 and 170 mOsm were obtained by dilution of serum-free stock DMEM (Invitrogen) with sterile water. The osmolarity of 340 mOsm was obtained by using this same stock DMEM (340 mOsm, as reported by the manufacturer’s Certificate of Analysis) without dilution with sterile water or supplementation with NaCl. The higher osmolarities of 685, 855, and 1030 mOsm were obtained by supplementing the stock DMEM with NaCl.
Twenty-four hours prior to exposure of osmolarity treatments, cells were seeded at approximately 1–2 × 10⁴ cells/well in 96-well plates with DMEM supplemented with 10% FBS and 2 μM insulin. Immediately prior to the exposure of varying osmolarities, all media was removed from the cells. The osmolarity treatments were then added to the cells for 24 hours. The WST-1 assay was used to assess cell viability, as described earlier.
Congo Red Binding Assay
Glucagon aggregates that reacted with Congo red were studied using a protocol modified from Klunk and colleagues.10 A solution of Congo red (Sigma-Aldrich, St. Louis, MO) was prepared by adding 5 μl of 25 μM Congo red to 1 ml of 20 mM potassium phosphate buffered to pH 7.4. This solution was filtered through a 0.22-μm filter. Ten μl of each glucagon preparation (each aged at 37 °C at 1 mg/ml) were added to this Congo red solution. To confirm that the Congo red staining procedure would not be impaired by assaying an alkaline sample, we verified that adding the highly alkaline glycine (pH 10) sample to the buffered salt solution with Congo red did not change that solution’s pH.
When fibrillation occurred, a small gel-like precipitate stained with Congo red was typically found without a diffuse change in the color of the solution. Accordingly, there were very inconsistent readings with the spectro-photometer. For this reason, a visual test by a researcher who was unaware of the study conditions was used for data analysis. More specifically, the intensity of bound Congo red was scored by a visual test based on a scale of 0 to 6, according to the size and intensity of the red-colored gel. Before this visual test was conducted, a number of the samples were shown separately to two of the authors. A very high degree of concordance was observed.
Solubility Study
A solubility study for native glucagon was carried out at alkaline pH levels prior to the 5-day glucagon aging study. It is already known that glucagon is highly soluble in an acidic pH,11 so solubility in the acid range was not studied. For glucagon dissolved in Tris at pH 8.5 and the glucagon dissolved in glycine at pH 10, various concentrations were prepared in 96-well plates at 37 °C and their absorbance was measured at 280 nm. The absorbance at 280 nm increases linearly as the concentration of soluble protein increases, but when the soluble concentration is exceeded, the absorbance plateaus. We found that at pH values of 8.5 and 10, when the concentration of glucagon was raised to approximately 3 mg/ml or higher, the absorbance response no longer rose in a linear fashion, demonstrating reduced solubility. For this reason, at alkaline pH, the highest concentration used in these studies was 2.5 mg/ml.
Size-Exclusion Chromatography (SEC)
Glucagon (native) was purchased from Sigma-Aldrich (St. Louis, MO). The glucagon was dissolved and aged for 21 days at 37 °C in three buffers: citrate buffer (pH 3.0), Tris (pH 8.5), and glycine (pH 10.0), all at 1 mg/ml concentrations. Buffer solutions were filtered through a 0.22-μm, sterile Millipore syringe before use. Samples of fresh and aged glucagon were fractionated on a Tosoh TSK-Gel 4000SWxl column (Tosoh Bioscience LLC, Montgomeryville, PA) at ambient temperature using an Agilent 1100 HPLC system (Agilent Technologies, Inc., Santa Clara, CA). Each preparation was studied using a citrate mobile phase (20 mM citrate buffer containing 130 mM NaCl, pH 3.0). The glucagon aged in glycine was also studied using a mobile phase of PBS (Invitrogen) at pH 7.4. The peptides were eluted under constant flow at 0.7 ml/min and the absorbance monitored at 214 nm (peptide bond) and 280 nm (aromatic ring). The column was calibrated with blue dextran (2,000,000 Da) and a series of protein standards of varying molecular weight including, thyroglobulin (690,000 Da), glucose oxidase (160,000 Da), bovine serum albumin (66,500 Da), porcine insulin (5777 Da), glucagon (3482 Da), and buserelin (1239 Da). The outcome metric was the area under the absorbance curve (280 nm) for the peak that eluted at 19.5 minutes (i.e., the glucagon monomer peak, 3.5 kDa).
Glucagon Administration in Pigs
Studies that involved animals followed the United States National Institute of Health guidelines for the use and care of laboratory animals. In addition, the Legacy Institutional Animal Care and Use committee gave written approval for the study before it was carried out. The purpose of the pig study was to test the hyperglycemic properties of commercially available GlucaGen given by subcutaneous (SC) injection to swine after 0 vs 7 days of aging at 37 °C, and to collect blood for analysis of glucagon plasma levels. GlucaGen was reconstituted with sterile water as per the manufacturer’s instructions to a concentration of 1 mg/ml.
Prior to addition of blood to serum collection tubes for later glucagon assay, 1000 KIU of aprotinin solution per milliliter of whole blood were added to each tube as a proteolysis inhibitor.
Young Yorkshire farm pigs (25–40 kg) were used for this study. Pigs were not fed on the morning of the study. A pig was sedated with Telazol and weighed. The animal then underwent tracheal intubation. For anesthesia, the pig was maintained on 1.5–2% isoflurane with oxygen. A SC dose of octreotide acetate (44 μg/kg) was given to block endogenous secretion of insulin and glucagon. An 18-gauge catheter was placed in the ear vein and normal saline was given slowly to keep the vein open. A heating pad was placed over the catheter to arterialize the venous blood. When vital signs were stable, the study was initiated.
Every 15 minutes throughout the study, 0.1 ml of blood was drawn from the intravenous catheter for measurement of blood glucose using a Hemocue 201 glucose analyzer (Hemocue Inc., Lake Forest, CA). At intervals (see Results), blood was obtained for later measurement of glucagon immunoreactivity (radioimmunoassay) in serum.
Thirty minutes after giving the octreotide, a SC dose of glucagon (either a low dose of 1 μg/kg (n = 2 for fresh glucagon and n = 2 for aged glucagon) or a maximal dose of 1 mg (n = 1 for fresh and n = 1 for aged) was given subcutaneously. A second dose of octreotide acetate (same dose as first) was administered 2 hours after the first dose. When the blood glucose returned to fasting or near-fasting levels, the study was terminated. The pig was observed during emergence from anesthesia until it could stand unassisted.
Statistics
Student’s t-test with the Bonferroni adjustment was used for comparisons (paired or unpaired, as appropriate). Before the adjustment, the starting alpha was 0.05. Thus, for the study of cytotoxicity of GlucaGen, there were five concentrations and four study durations, yielding a final alpha of 0.05/20 = 0.0025. Similarly, for the study of lactose-free glucagon, there were two types of glucagon, three concentrations, two storage pH levels, and two durations, yielding a final alpha of 0.05/24 = 0.0021.
Results
The direct effects of pH and osmolarity on cytotoxicity in NIH 3T3 fibroblasts are shown in Figures 1A and 1B, respectively. The ranges for pH and osmolarity that did not induce cytotoxicity, as measured by the WST-1 assay, were approximately 7.0–9.5 and 250–400, respectively.
Figure 1.
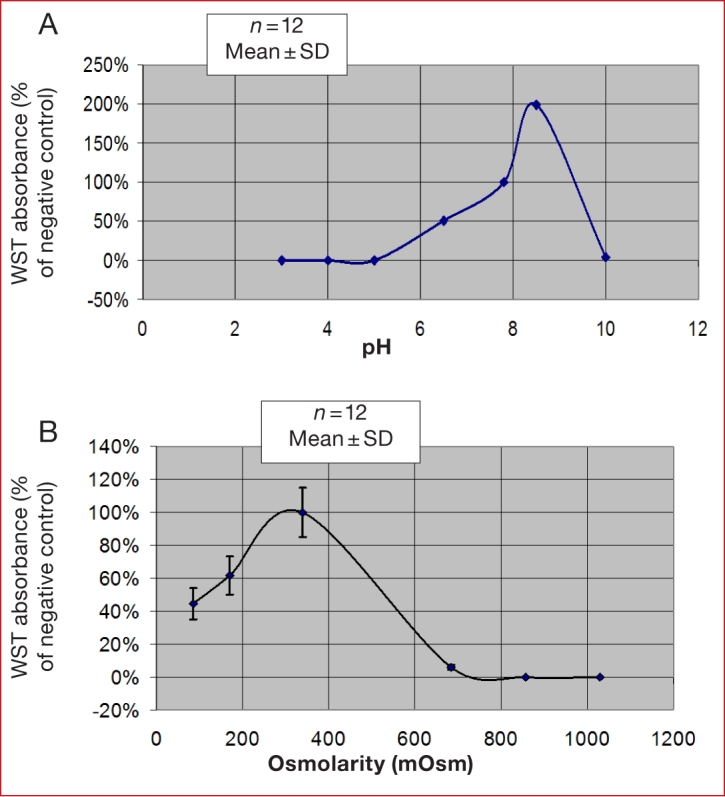
The effect of (A) pH and (B) osmolarity on cytotoxicity of NIH 3T3 fibroblasts in culture, using the WST-1 cell viability assay.
The results of the LDH and WST-1 assays in our initial experiments were concordant. However, owing to its better reproducibility during repeated measures for 5–7 days, subsequent cytotoxicity assays used the LDH assay. Figure 2 shows the LDH assay results for NIH 3T3 cells exposed to the commercially available lactose-rich glucagon preparation (GlucaGen) at pH 3 after aging for 0, 1, 2, and 7 days. Only the highest concentration (5 mg/ml) led to cytotoxicity, and it was clear that this toxicity was not related to the duration of aging. Indeed, the toxic effect of the highest concentration of glucagon was as prominent at day 0 as it was at day 7. Concentration of the lactose-rich glucagon mixture, not aging duration, was the relevant factor.
Figure 2.

LDH assay results in NIH 3T3 fibroblasts exposed to commercially available lactose-rich glucagon preparation (GlucaGen) at pH 3 after aging for 0, 1, 2, and 7 days. Positive and negative controls performed as expected. Only the highest concentration (5 mg/ml) led to cytotoxicity, but it is clear that the toxicity was not related to the duration of aging.
Figure 3 shows the cytotoxicity results for lactose-free glucagon and the lactose-free glucagon analog MAR-D28 at different concentrations with no aging (Figure 3a) and after aging for 5 days (Figure 3b). With no aging, there was no significant cytotoxicity at any concentration of the native hormone or the analog at either pH 8.5 or 10. After aging for 5 days, there was some evidence of toxicity at pH 8.5, with similar results for native glucagon and MAR-D28. At 5 days at a pH of 10 in glycine buffer, there was no evidence of cytotoxicity for either preparation.
Figure 3.

Cytotoxicity results for lactose-free glucagon and the lactose-free glucagon analog MAR-D28 at different concentrations with (A) no aging and (B) after aging for 5 days. With no aging, there was no significant cytotoxicity at any concentration of the native hormone or the analog at either pH 8.5 or 10. After aging for 5 days, there was some evidence of toxicity at pH 8.5 with both preparations but no toxicity of either preparation at a pH of 10 in glycine buffer.
We carried out Congo red studies on GlucaGen reconsti-tuted at 1 mg/ml. The Congo red assay was carried out in triplicate on this lactose-rich preparation immediately after reconstitution and after being aged at 37 °C for various lengths of time. Using a scale of 0–6, with a score of 6 being maximal, we observed Congo red scores of 0 with no aging, 0 after 4 hours of aging, 1.5 after 24 hours of aging, 3.75 after 3 days of aging, and 6 after 5 days of aging (data not shown).
We also carried out a series of Congo red assays on lactose-free preparations aged for longer periods of time, as shown in Figure 4. This figure shows results of Congo red binding to preparations of lactose-free native glucagon and MAR-D28. There was no Congo red binding at day 0 (freshly prepared, without aging) under any condition. Beginning at day 8, Congo red amyloid intensity was greatest in citrate buffer at pH 3. At a mildly alkaline pH of 8.5, there was substantial Congo red intensity at day 8 with the native glucagon but not with the analog MAR-D28. At a pH of 10, there was no Congo red staining for native glucagon or for the MAR-D28 analog, even after 28 days.
Figure 4.

Results of Congo red assay for glucagon preparations aged at 37 °C for varying lengths of time. For fresh glucagon and MAR-D28, there was no Congo red binding under any condition. Beginning at day 8, Congo red amyloid intensity was greatest in citrate buffer at pH 3. At a pH of 10, there was no Congo red staining for native glucagon or for the MAR-D28 analog, even after 28 days.
In terms of SEC data, the principal metric was the area under the curve (units are absorbance × minutes) for the monomeric glucagon peak, the data for which are shown in Figure 5. When glucagon was aged in citrate at pH 3, the size of the glucagon monomeric peak declined rapidly and was absent after 7 days. When aged in Tris at pH 8.5, there was also a substantial loss of the glucagon peak. In contrast, when aged in glycine at pH 10, there was very little loss of the monomeric peak at 7 days, although modest loss occurred after 14 and 21 days. There was no obvious difference in the results for the glycine preparation when a mobile phase of PBS (pH 7.4) was used versus a mobile phase of citrate (pH 3).
Figure 5.

Results of SEC carried out on fresh and aged preparations of native glucagon. Shown here are the areas under the curve for the main monomeric glucagon peak (molecular weight 3.5 kDa) obtained at different periods of aging at 37 °C up to 21 days for glucagon aged in glycine (pH 10), Tris (pH 8.5), and citrate (pH 3). All preparations were studied using a citrate mobile phase (red lines). The glycine preparation was also studied using a PBS mobile phase (black lines). Irrespective of the mobile phase, the glucagon dissolved in glycine (pH 10) demonstrated the greatest preservation of the monomeric glucagon peak over time.
Although the monomeric glucagon peak and the peaks from the various protein standards were always well-delineated, there were little if any large molecular weight peaks that would have indicated amyloid aggregates, even in preparations that lost the glucagon peak and were shown by other techniques to be rich in amyloid. We believe that this finding was due to the fact that when the aging solution showed both solids (gels) and liquid, the very narrow gauge pipette tip used to acquire the sample tended to serve as a screen, allowed acquisition only of the nongelled liquid.
Figure 6 shows data for the pig study in which fresh or aged (at 1 mg/ml) GlucaGen was given to anesthetized pigs at two different doses. For the lower dose (1 μg/kg), the hyperglycemic responses were similar for both fresh and aged, although there was a tendency for the aged preparation to have a somewhat lower response. For the high dose (1 mg), hyperglycemic responses were also similar between the fresh and aged preparations, with the aged preparation demonstrating a somewhat higher response. If one compares the low and high doses, the initial rate of glucose rise was similar for both doses, but the maximal response, typically at 45–60 minutes, was somewhat greater for the higher dose.
Figure 6.

Data for the pig study in which fresh or aged glucagon (GlucaGen) was given to anesthetized pigs at two different doses. For the lower dose (1 µg/kg), the hyperglycemic responses was similar among the fresh (n = 2) and aged (n = 2), although there was a tendency for the aged preparation to have a somewhat lower response. For the high dose (1 mg), the hyperglycemic responses were also similar between fresh and aged glucagon.
Figure 7 shows the plasma levels of glucagon obtained during the high-dose glucagon studies. Although the maximal plasma levels were very similar for fresh vs aged glucagon, there was a tendency for the rise in glucagon to be slightly delayed in the aged preparation.
Figure 7.

The plasma levels of glucagon obtained during the high-dose glucagon studies. Although the maximal plasma levels were very similar, there was a tendency for the rise in glucagon to be slightly delayed in the aged preparation.
Discussion
There is a need for glucagon, or a glucagon-like analog, to be sufficiently stable so that it can be indwelled in a portable pump for at least 3 days. The delivery apparatus for portable insulin pumps must be changed every 3 days, and fresh aqueous glucagon could be loaded into the pump chamber at these intervals. The benefit of intermittent delivery of glucagon was reported both by our group3 and El-Khatib and colleagues.4 Both groups found that, in the setting of an artificial pancreas, glucagon delivered intermittently during declining incipient hypoglycemia usually protects against overt hypoglycemia in subjects with type 1 diabetes. These studies demonstrate the need for a stable aqueous preparation of glucagon. Currently, usage instructions for commercially available glucagon allow only for immediate usage of glucagon after the powder is reconstituted in aqueous solution. As is the case for many other proteins, glucagon has a tendency to form amyloid fibrils in aqueous solutions during aging.10 Onoue et al.2 asserted that aging of aqueous solutions of glucagon form amyloid fibrils that directly cause cytotoxicity, a conclusion similar to that of Maji and colleagues.12
In this study, we found that under certain conditions, both native glucagon and the glucagon analog MAR-D28 are free of cytotoxicity even after aging in aqueous solution at body temperature for 5 days. We found no evidence of cytotoxicity from native glucagon or MAR-D28 at a pH of 10 in a glycine solvent up to maximally soluble concentrations of 2.5 mg/ml. We found a mild to moderate cytotoxicity when the native glucagon and MAR-D28 were aged in Tris buffer at pH 8.5. We also found that the maximally soluble concentration (5 mg/ml) of the commercial glucagon preparation (GlucaGen), whose pH after aqueous reconstitution is 3, caused marked cyto-toxicity. It is important to note, however, that this toxicity was found at time zero, with no additional cytotoxicity after aging (discussed further later). Taking all the cytotoxicity results into consideration, including our study addressing the pH effect, we believe that the alkaline pH range (especially a pH of 10) is the safest option for avoiding cytotoxicity and amyloid fibril formation. It should be noted that this pH 10 preparation, after dilution with the DMEM culture medium, yielded a pH of 8.8, a level that was only minimally toxic in the pH study.
With the same cell line that we used (NIH 3T3 fibroblasts) and the same assay for cytotoxicity (LDH), Onoue and colleagues2 reported that glucagon aged at a high concentration (5 mg/ml) caused definite cytotoxicity, even after aging for only 1 day. In that study, the preparation that was cytotoxic when aged was not cytotoxic with no aging. The reasons for the differing results of our studies are not perfectly clear, although there are several possibilities, including the conditions under which the cells were studied. First, we found substantial direct effects of pH and osmolarity on cytotoxicity with NIH 3T3 cells. The ranges of pH and osmolarity that showed acceptably low cytotoxicity were 7–9.5 and 250–400 mOsm, respectively. In the study of Onoue and colleagues, the concentration of HCl to which the glucagon was exposed was 0.01 M, which would result in a pH of approximately 2. Although it is true that when added to buffered cell media, the resulting pH could have been somewhat higher in their study, we believe that the resulting pH probably remained low and contributed to cell death. The osmolarity to which the cells were exposed during LDH testing was not provided in the Onoue study.
Given the effects of pH and osmolarity on cell viability, there are several possible causes of our observation of cytotoxicity at high concentrations of the commercial glucagon preparation from Novo Nordisk: (1) the hyper-osmolarity of the solutions caused by the lactose in the high glucagon concentration study; (2) the low pH of the solutions; or (3) a direct toxic effect of amyloid fibrils. The finding of an immediate cytotoxic effect (with no aging) suggests that low pH or hyperosmolarity were the likely culprits, since we and others have found that the concentration and potential toxicity of amyloid fibrils increases with time. The high lactose concentration in the 5 mg/ml GlucaGen preparation (over 100 mg of lactose per mg of glucagon) was associated with a very high, nonphysiologic osmolarity of approximately 900 mOsm.
In our study, we were interested in aging glucagon at maximally soluble concen trations. We found that the high concentration of 5 mg/ml examined in the acid pH experi ments could not be achieved at higher pH levels. The maximal solubility of glucagon in the alkaline range with glucagon was 2.5–3.0. Pedersen et al.1 reported solubility data that was similar to ours, i.e., maximal solubility at acid pH, very little solubility at neutral pH, and rising solubility as pH is raised above neutral.
Our Congo red results showed that formation of amyloid occurred quickly, with very high levels at 5–8 days when glucagon was aged in acid solutions, either with the commercial lactose-rich preparation or with the lactose-free preparation. In contrast, Congo red binding was much lower in alkaline preparations. At the highest pH of 10, there was no Congo red staining for native glucagon or for MAR-D28 , even after 28 days. At a pH of 8.5, there was a tendency after 8 days toward less amyloid formation with the MAR-D28 as compared to native glucagon, but by 21 days there was substantial Congo red staining in both preparations.
These Congo red results are helpful in understanding the cytotoxicity results. Cytotoxicity in NIH 3T3 cells was the greatest for high concentrations of glucagon aged in acid (commercial preparation dissolved in HCl), somewhat less for the high concentrations of glucagon and MAR-D28 aged at pH 8.5, and absent for glucagon and MAR-D28 prepared at pH 10 in glycine buffer, even at high concentrations. The fact that Congo red binding, which indicates amyloid formation, was highest in the same preparations that led to substantial cytotoxicity suggests that beta sheet amyloid likely contributed to the cytotoxicity. Congo red intensity was very low in the glucagon aged in glycine buffer at pH 10, suggesting stability of the monomer and lack of amyloid formation under this condition. This finding, coupled with the lack of cytotoxicity with the glycine preparation, further support a safety advantage for this condition. Using SEC, there was also much greater preservation of the glucagon monomeric peak over 21 days under the glycine (pH 10) condition as compared to the Tris (pH 8.5) condition or the citrate (pH 3) conditions. It will be necessary to carry out studies of glucagon stability using reverse-phase high-performance liquid chromatography to evaluate for deamidated compounds and other degradation products.
The studies in nondiabetic pigs whose endogenous endocrine pancreatic secretion had been blocked revealed a preservation of the hyperglycemic effect of aged commercially available glucagon at acid pH (GlucaGen), despite conditions associated with marked amyloid formation. We acknowledge that the anesthesia probably contributed to some degree the hyperglycemia that was noted after glucagon administration, but this effect would be expected to be similar among all the conditions. Although the glucagon assay revealed a mild delay in the rise of glucagon levels, there was no obvious reduction of the rate at which glucagon exerted its hyperglycemic action after injection. The simplest explanation for the delayed rise in plasma glucagon with the aged preparation is the time required for the amyloid to be converted to absorbable monomers or oligomers. The current findings in pigs extend earlier studies from our laboratory5 and from the Boston University group,6 which also showed a greater biological response to aged glucagon that one would otherwise expect. We acknowledge that it will be necessary to carry out further animal studies using the aged alkaline preparations. Although most approved drugs have pH values that are lower than the pH 10 preparation described here, parenteral furosemide has a pH value of approximately 11–12. It is generally well-tolerated when given by intravenous or subcutaneous routes.13
Conclusions
Our results underscore that to understand the potential cytotoxicity of glucagon preparations, conditions such as pH and osmolarity must be carefully considered. In general, the conditions that favor cytotoxicity are acid pH and abnormal osmolarity. When the pH of the glucagon buffer during aging is kept at alkaline levels, amyloid formation and cytotoxicity are much lower than at acid pH. The conditions for native glucagon and for the MAR-D28 glucagon analog that were most effective in minimizing cell toxicity and amyloid formation were a glycine buffer at pH 10. However, even under acid conditions that favor amyloid production, our animal studies demonstrated that the hyperglycemic effect of native glucagon was preserved.
Acknowledgements
We are grateful to the Legacy Comparative medicine staff for assisting with animal studies and to Jessica R. Castle, M.D., for helpful discussions and assistance with cell culture studies.
Abbreviations
- (DMEM)
Dulbecco’s modified Eagle’s medium
- (FBS)
fetal bovine serum
- (FDA)
Food and Drug Administration
- (HCl)
hydrochloric acid
- (LDH)
lactate dehydrogenase
- (NaCl)
sodium chloride
- (PBS)
phosphate-buffered saline
- (SC)
subcutaneous
- (SEC)
size-exclusion chromatography
- (WST-1)
water-soluble tetrazolium-1
References
- 1.Pedersen JS, Dikov D, Flink JL, Hjuler HA, Christiansen G, Otzen DE. The changing face of glucagon fibrillation: structural polymorphism and conformational imprinting. J Mol Biol. 2006;355(3):501–523. doi: 10.1016/j.jmb.2005.09.100. [DOI] [PubMed] [Google Scholar]
- 2.Onoue S, Ohshima K, Debari K, Koh K, Shioda S, Iwasa S, Kashimoto K, Yajima T. Mishandling of the therapeutic peptide glucagon generates cytotoxic amyloidogenic fibrils. Pharm Res. 2004;21(7):1274–1283. doi: 10.1023/b:pham.0000033016.36825.2c. [DOI] [PubMed] [Google Scholar]
- 3.Castle JR, Engle JM, El Youssef J, Massoud RG, Yuen KC, Kagan R, Ward WK. Novel use of glucagon in a closed-loop system for prevention of hypoglycemia in type 1 diabetes. Diabetes Care. 2010;33(6):1282–1287. doi: 10.2337/dc09-2254. [DOI] [PMC free article] [PubMed] [Google Scholar]
- 4.El-Khatib FH, Russell SJ, Nathan DM, Sutherlin RG, Damiano ER. A bihormonal closed-loop artificial pancreas for type 1 diabetes. Sci Transl Med. 2(27):27ra27. doi: 10.1126/scitranslmed.3000619. [DOI] [PMC free article] [PubMed] [Google Scholar]
- 5.Ward WK, Engle J, Duman HM, Bergstrom CP, Kim S, I F. The benefit of subcutaneous glucagon during closed-loop glycemic control in rats with type 1 diabetes. IEEE Sensors. 2008;8(1):89–96. [Google Scholar]
- 6.El-Khatib FH, Jiang J, Gerrity RG, Damiano ER. Pharmacodynamics and stability of subcutaneously infused glucagon in a type 1 diabetic swine model in vivo. Diabetes Technol Ther. 2007;9(2):135–144. doi: 10.1089/dia.2006.0006. [DOI] [PubMed] [Google Scholar]
- 7.Chabenne JR, DiMarchi MA, Gelfanov VM, DiMarchi RD. Optimization of the native glucagon sequence for medicinal purposes. J Diabetes Sci Technol. 2010;4(6):1322–1331. doi: 10.1177/193229681000400605. [DOI] [PMC free article] [PubMed] [Google Scholar]
- 8.Korzeniewski C, Callewaert DM. An enzyme-release assay for natural cytotoxicity. J Immunol Methods. 1983;64(3):313–320. doi: 10.1016/0022-1759(83)90438-6. [DOI] [PubMed] [Google Scholar]
- 9.Mosmann T. Rapid colorimetric assay for cellular growth and survival: application to proliferation and cytotoxicity assays. J Immunol Methods. 1983;65((1-2)):55–63. doi: 10.1016/0022-1759(83)90303-4. [DOI] [PubMed] [Google Scholar]
- 10.Klunk WE, Pettegrew JW, Abraham DJ. Quantitative evaluation of congo red binding to amyloid-like proteins with a beta-pleated sheet conformation. J Histochem Cytochem. 1989;37(8):1273–1281. doi: 10.1177/37.8.2666510. [DOI] [PubMed] [Google Scholar]
- 11.Pedersen JS, Otzen DE. Amyloid-a state in many guises: survival of the fittest fibril fold. Protein Sci. 2008;17(1):2–10. doi: 10.1110/ps.073127808. [DOI] [PMC free article] [PubMed] [Google Scholar]
- 12.Maji SK, Perrin MH, Sawaya MR, Jessberger S, Vadodaria K, Rissman RA, Singru PS, Nilsson KP, Simon R, Schubert D, Eisenberg D, Rivier J, Sawchenko P, Vale W, Riek R. Functional amyloids as natural storage of peptide hormones in pituitary secretory granules. Science. 2009;325(5938):328–332. doi: 10.1126/science.1173155. [DOI] [PMC free article] [PubMed] [Google Scholar]
- 13.Verma AK, da Silva JH, Kuhl DR. Diuretic effects of subcutaneous furosemide in human volunteers: a randomized pilot study. Ann Pharmacother. 2004;38(4):544–549. doi: 10.1345/aph.1D332. [DOI] [PubMed] [Google Scholar]