

Abstract
Amantadine-sensitive proton uptake by liposomes is currently the preferred method of demonstrating M2 functionality after reconstitution, to validate structural determination with techniques such as solid-state NMR. With strong driving forces (two decades each of both [K+] gradient-induced membrane potential and [H+] gradient), M2(22-62) showed a transport rate of 78 H+/ tetramer-s (pHo 6.0, pHi 8.0, nominal Vm = -114 mV), higher than previously measured for similar, shorter, and full-length constructs. Amantadine sensitivity of the conductance domain at pH 6.8 was also comparable to other published reports. Proton flux rate was optimal at protein densities of 0.05-1.0% (peptide wt% in lipid). Rundown of total proton uptake after addition of valinomycin and CCCP, as detected by delayed addition of valinomycin, indicated M2-induced K+ flux of 0.1 K+/tetramer-s, and also demonstrated that the K+ permeability, relative to H+, was 2.8×10⁻⁶. Transport rate, amantadine and cyclooctylamine sensitivity, acid activation, and H+ selectivity were all consistent with full functionality of the reconstituted conductance domain. Decreased external pH increased proton uptake with an apparent pKa of 6.
Keywords: M2 protein, influenza A virus, liposome assay, acid activation, specific transport activity, membrane protein
1. Introduction
The Influenza A virus contains a 97-residue, single-pass integral membrane protein, M2, which associates into tetrameric, proton-selective ion pores in cellular (and therefore viral) membranes. This protein is the target of the adamantane-derived antiviral drugs amantadine and rimantadine. With the emergence of the 2009 pandemic H1N1 strain, virtually all Influenza A strains circulating in human populations, now, have acquired one or more mutations in the M2 protein which confer amantadine resistance[1, 2]. Elucidation of the structural and functional features underlying M2 proton transport is critical to the search for new antiflu drugs. Functional assays used to study this protein electrophysiologically have ranged from in vivo studies in transformed, M2-expressing Xenopus oocytes[3-5] or mouse erythroleukemia cells[6] to wholly in vitro planar bilayer[7, 8] studies. When purified, reconstituted protein is available, the currently preferred method[9] is the proteoliposome proton flux assay, using either pH-sensitive fluorophores[3, 10, 11] or direct measurement of extra-liposomal pH to quantify proton influx into liposomes[12, 13]. This method is not limited by the constraints of cellular physiological tolerance, yet utilizes a more natural lipid arrangement than a solvent-inflated planar bilayer or micellar environment. Recently, the structure of M2 (residues 22-62) was determined in planar lipid bilayers using solid state NMR spectroscopy[14]. Here, we assess the functionality of this peptide in a similar lipid bilayer environment.
From reversal potentials[5, 6] and related electrophysiological calculations[5], the M2 current is exquisitely proton selective (permeability, relative to that of Na+, of 1.6×10⁶). Initially, qualitative methods of assessing selectivity in liposomes were used and suggested similar values [11]. A more quantitative approach was suggested[12] and used to establish that M2’s proton selectivity is of the same order of magnitude as in erythroleukemia cells. Here the quantitative approach is fully implemented, giving an improved estimate of M2(22-62) selectivity and exploring the time course of vesicle depolarization by M2 transport of K+. The concept that small but finite alkali metal transport by M2 would be physiologically valuable for virus acidification was highlighted in a recent study by Årsköld and colleagues[15].
In cell expression systems, the transport rate of full-length M2 is very low, i.e. 210 H+/s = 34 aA (pHo 6.2, Vm -130 mV[16], as calculated in [11]). Liposome assays have previously yielded much lower (>20-fold) transport rates[3, 11-13]. In these studies, either electrical or pH gradient was used to motivate proton flux. Here, we report that, when using a combination of electrical and chemical gradients, proton flux rates of M2(22-62) in liposomes approach those measured in oocytes. The Årsköld study showed similar levels of proton transport in liposomes[15].
Proton transport through M2 is induced by external acidification[17]. This is due in part to increased driving force for proton current, but can also be ascribed, at least in certain cases, to a gating effect. Udorn[5] and Weybridge[18] Influenza strains show strong signs of N-terminal acid activation, namely reduction of external/N-terminal pH reduces outward proton currents in spite of the increased driving force. Here, it is assumed that the basic pH inside the vesicles will block proton uptake by the half[11] of the tetramers whose N-terminus is inside the liposomes, so that the uptake is done only by the other half.
M2 currents are reduced by 50% when exposed to external 9 μM amantadine (full-length protein, pH 7.5[19]), and show similar sensitivity to rimantadine[6], cyclooctylamine[11], and 2-[3-azaspiro (5,5)undecanol]-2-imidazoline (BL-1743)[20]. Numerous related compounds have also been shown to inhibit viral growth and/or to inhibit M2 conductance[21-25] (for additional references, see [9]). Here we assess the amantadine and cyclooctylamine sensitivities of M2(22-62), exploring the block with increasingly acid external solution.
It is generally assumed that M2 is fully tetrameric in lipid bilayers, although the monomer-tetramer equilibrium is evident in analytical ultracentrifugation for M2 suspended in detergent micelles[26, 27]. Here we assess the specific activity of M2(22-62) over a broad range of peptide densities in liposomes to examine whether there is any departure from constancy that would indicate incomplete tetramerization.
2. Materials and Methods
2.1 Peptide Expression and Purification
The M2(22-62) construct used in these liposome assays included the transmembrane domain and post-TM amphipathic helix. The construct, expressed in transfected E. coli BL21 (DE3), was comprised of an N-terminal 6-histidine tag followed by the large, soluble maltose binding protein, then a TEV-protease cleavage site, and finally the insoluble M2(22-62) peptide. The fusion protein was collected from the bacterial membrane fraction by solubilization with dodecylmaltoside, and purified via affinity chromatography with a Ni-NTA column. The peptide was cleaved from the fusion protein with TEV protease for 20 h. The reaction mixture was precipitated with trichloroacetic acid and lyophilized. The cleaved M2(22-62) peptide was solubilized using methanol and the concentration determined by aborbance at 280 nm using a generic extinction coefficient (1 ml mg-1 cm-1). It contains a fragment of the TEV cleavage site (Ser, Asn, Ala) at the N-terminus, such that the total length is 44 amino acids, with a calculated molecular weight of 5014.9 Da.
2.2 Liposome Preparation
Liposomes were prepared by mixing chloroform-suspended E. coli polar lipid extract (67% phosphatidylethanolamine, 23.2% phosphatidylglycerol, 9.8% cardiolipin, average molecular weight: 798 Da; Avanti Polar Lipids, Alabaster, AL, USA) with the methanol-suspended M2(22-62) peptide. The solvent was then evaporated under a steady stream of N2 gas. The resulting clear lipid film was placed in a vacuum for 1-2 hours to remove any remaining traces of solvent. Internal buffer (50 mM KCl, 50 mM K2HPO4, 50 mM KH2PO4, pH 8.0, 320 mOsm) was added to the thin film, vortexed to form nonuniform liposomes, then extruded through a 100-nm pore-size polycarbonate filter (Liposofast membrane extruder, Avestin, Ottawa, Canada) at 50-60°C. After extrusion, samples were divided for matched-pair drug block assessment. Amantadine or cycloctylamine were added to liposome and external buffers to a nominal concentration of 100 μM. The average vesicle diameter was found to be 145±15 nm by dynamic light scattering (Brookhaven Instruments, Holtsville, NY, USA).
2.3 Experimental Protocol
The proton uptake assay was modelled after a paradigm developed previously[12, 13]. Liposomes were diluted 100-fold (except as noted for Figure 1) into 3 ml of external buffer (either weak phosphate buffer: 165 mM NaCl, 0.05 mM KH2PO4/K2HPO4, pH 7, 320 mOsm, or strong citrate buffer: 165 mM NaCl, 1.67 mM sodium citrate, 0.33 mM citric acid, 320 mOsm, titrated appropriately for the target pH) in a 1-dram vial. Because [K+] is negligible in the external buffer, the dilution creates a 100x gradient in [K+] across the liposome membrane, which yields an electrical potential of -110 mV for a K+-selective membrane at room temperature (after compensating for K+ activity coefficients). A pH electrode (Accumet combination electrode with calomel reference, model 13-620-293, Fisher Scientific, Houston, TX, USA) was used to measure proton movement into or out of the liposomes throughout the experiment. After liposome addition, valinomycin (Sigma-Aldrich Corp.) was added to the solution to a concentration of 30 nM to render the membrane dominantly permeable to K+ and produce the membrane potential. In some cases, the external buffer was acidified with 0.1 M HCl after liposome dilution and at least two minutes before valinomycin addition. Two minutes after valinomycin, CCCP was then added to a concentration of 1.67 μM. Finally, two calibration aliquots of 30 nEq HCl were averaged for conversion of the pH changes into nEq H+ influx. In several experiments, valinomycin was again added after complete CCCP-gradient neutralization to evaluate the time course and size of the direct impact of the valinomycin and its ethanol carrier on the bath pH. It was found to produce a small, fast step rise in bath pH of 0.002 units and requiring about 2 s (depending on stirring) to reach a new level, which was taken into account in the data analyses by considering the first 2 s after valinomycin to be dead time.
Fig. 1.
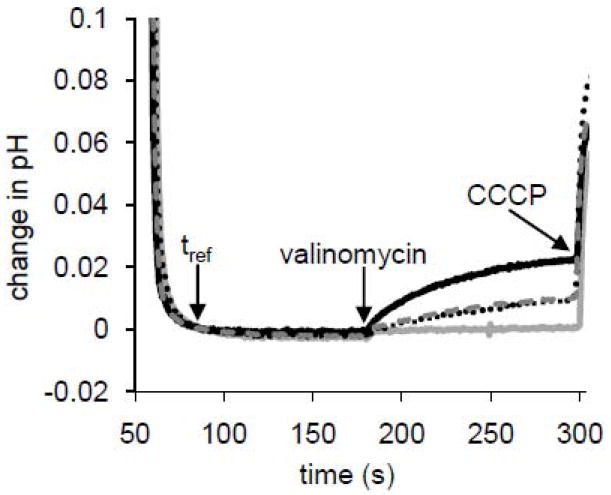
Four traces are shown: M2(22-62) proteoliposomes only (solid black line), M2(22-62) proteoliposomes in the presence of 10 μM amantadine (dotted black line), M2(22-62) in the presence of 10 μM cyclooctylamine (dashed gray line), and protein-free liposomes (solid gray line). A modest linear positively sloped baseline drift has been subtracted. Vertical axis shows change in pH relative to that at an arbitrary reference time used in this plot to align traces vertically, t=90 s post acid-addition. Horizontal axis is time (in seconds) after external acidification. Arrows indicate the reference time, addition of valinomycin to 30 nM, and addition of CCCP to 1.67 μM. For the conditions used in this experiment (60-fold dilution of liposomes into external buffer producing K+ concentration ratio of 67 and nominal K+ Nernst potential, and thus membrane potential after valinomycin addition, of Vm = -104 mV; 20 mg lipid: 0.2 mg protein:ml solution, 150 nm diameter vesicles, pHo 6.8, pHi 8.4), which represents a comparatively modest driving force and acid activation, each tetramer transported 4.6 H+/s in the absence of drugs. Amantadine treatment reduced transport by 61% and cyclooctylamine by 50%.
2.4 Analysis of Potassium Flux Rates
The rate of total signal decay was used to indicate the rate of depolarization of liposomes deriving from K+ permeability. Because of variability in the trapped volume between liposome preparations, this required normalization of the total signal heights extrapolated back to the time when the liposomes were first exposed to a pH gradient. The total signals from each experiment, corrected for ethanolic reagent artifacts, were first fitted with an exponential decay function and then divided by the respective zero time (acidification time) intercept for trapped volume normalization before averaging with the other two experiments in its group. The normalized averages were then fit with a unity-amplitude exponential decay function (solid lines on the semi-log plot), the characteristic time of the protein-free curve was subtracted from that of the proteoliposome curve, and the result was multiplied by the zero-time intercept for the protein-containing liposomes to obtain the denormalized decay due to K+ flux (nmol K+/minute) through M2(22-62). This was then divided by the total protein content in the sample (0.15 nmol tetramers) and converted to units of seconds.
3 Results
The data from liposome assays presented here, testing drug sensitivity, selectivity, acid activation and responses, and proton flux rate all indicated robust function of M2(22-62) in the E. coli lipid environment, and demonstrate increased specific activity over previous liposome assay reports. Figure 1 demonstrates the high sensitivity of M2(22-62) to the known blockers, amantadine and cyclooctylamine. After injection of liposomes into external buffer, diluting the external [K+] by 67-fold (in this case), the exterior is acidified to pH 6.8 (t=0 s). Proton uptake under these modest gradients is initiated at t = 180 s by addition of valinomycin, giving an initial uptake rate of 4.6 H+/tetramer-s. The initial slope was approximately halved by the presence of drugs: 10 μM amantadine (Ki = 9 μM in the full-length protein[19]) reduced proton transport by 61%. 10 μM cyclooctylamine (a blocker with potency similar to amantadine) reduced transport by 50%.
The effect of amantadine block is further illustrated in Figure 2, where the raw uptake traces (without background subtraction) in the presence of 100 μM amantadine are shown. Without amantadine, the initial slope (inset, R2=0.94) corresponds to 40 H+/tetramer-s if one takes into account the size of the 30 nEq H+ back-titration and the nominal protein content in the sample, 0.15 nmoles of M2(22-62) tetramers - half of which are nominally active. Subtraction of the equivalent of 6.5 H+/tetramer-s observed independently with protein-free liposomes yields an M2 flux of 33.5 H+/tetramer-s. (Here, the two-decade [K+] and [H+] gradients were used; this flux rate was at the low end for the group, which is reported more completely below). With amantadine, the initial slope was reduced to the equivalent of 16.5 H+/tetramer-s (inset, R2=0.92). After subtraction of an equivalent of 7.8 H+/tetramer-s for protein-free liposomes in 100 μM amantadine, the initial flux with amantadine is calculated to be 8.7 H+/tetramer-s. Thus, amantadine treatment reduced transport to 26% of the original level, i.e.74% block for the experiment shown in Figure 2.
Figure 2.
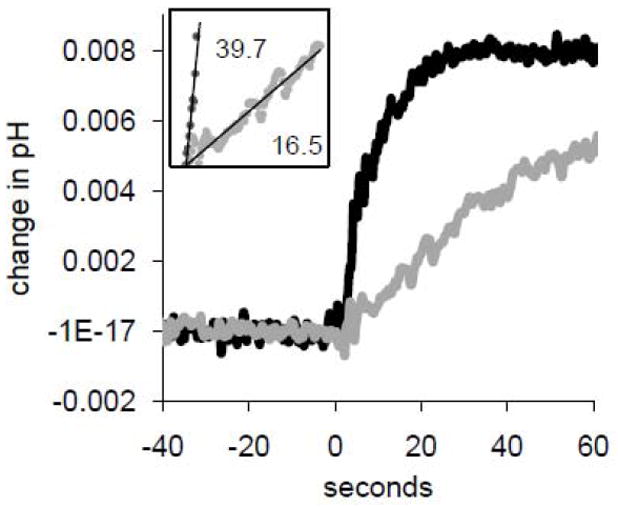
Valinomycin-induced uptake as inhibited by 100 μM amantadine, showing the small change in external pH under consideration. Valinomycin was added at t = 0 seconds. A linear baseline drift has been subtracted. Black dots: M2(22-62) proteoliposomes. Gray dots: M2(22-62) in the presence of 100 μM amantadine. Inset: Linear regression of data from addition of valinomycin until initial pH change of 0.005. Slopes, after conversion of units to H+/tetramer-s using subsequent back titrations, are reported. pHo 6.0; strong citrate buffer external; initial slope measured 8 s after valinomycin addition based on back-titration settling time.
To assess the oligomerization of M2(22-62), the proton transport rate as a function of protein density was measured. Figure 3 shows the log of the initial liposomal proton uptake rate after valinomycin injection (H+/s) plotted against log of peptide content (nmoles of tetramer in the 3-ml assay). The theoretical line of unity slope shows the best fit of a line constrained to pass through the origin on a linear-linear plot, with slope of 23.8 H+/tetramer-s after gating/orientation correction.
Figure 3.
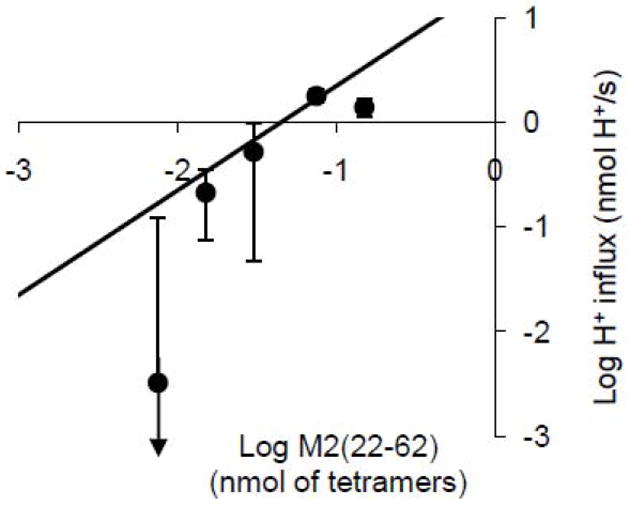
Log-log representation of M2(22-62) initial proton flux (mean ± S.D., N=3 except for the middle point, where N=2) with varying protein content expressed as nmoles of tetramer in the assay cuvette (using a monomeric molecular weight of 5 kD) incorporated into 300 μg lipid. Theoretical line with unity slope: best fit of the four left-hand points to a straight line constrained to pass through the origin (y = mx). The least-squares-fit line slope, m, after correction for orientation and gating, corresponds to a value of 23.8 H +/tetramer-s. The points correspond to 0.05% (peptide mass as a percentage of lipid mass) at the far left and 1.0% at the far right. pHo 6.7-7.1.
To test selectivity of the M2(22-62)-induced ion conductance, the basic liposome assay paradigm was modified to allow increased amounts of time between liposome acidification and valinomycin addition (5, 15, and 30 minutes), which is then followed two minutes later by CCCP addition and subsequently by back-titration tests as usual. Degradation of the total proton uptake signal (i.e. the sum of the valinomycin and CCCP signals, taken as the pH change from just before valinomycin addition to just before back titration with acid addition) is presumably due to K+ leakage out of the liposomes between the time of dilution and the time of CCCP addition. We therefore take total proton uptake signal as a proxy of K+ efflux. Specifically, based on dynamic steady state modeling of relaxation to Donnan equilibrium[12], we make the simplifying assumption that for conditions of selective potassium and proton permeability, K+ efflux through M2 leads to an equivalent reduction in the possible total proton uptake signal height.
To a certain extent, the K+ leaks through the lipid as well as through the M2 transporter, as is demonstrable with protein-free liposomes. Figure 4 shows raw data demonstrating rundown of total proton uptake into liposomes after addition of valinomycin and CCCP at varying time intervals. The initial drift before addition of valinomycin is strong in these experiments because of the low buffering capacity of the external bath. It is only observed in the presence of liposomes (the electrode response is very rapid) and is therefore interpreted to represent uptake of protons by liposomes. The external pH at the time of valinomycin injection is given on the plot and is approximately the same for each experiment. The upper group of three traces shows decay in the height of the total signal with M2(22-62) present for longer delays. This is also seen with the protein-free liposomes in the lower three traces, but the decay in the total signal is not as great. Some prep-to-prep variability is observed, as with the central (15 minute) experiment in the lower group, but the trend of pre-valinomycin drift and decay of total signal is clear.
Figure 4.
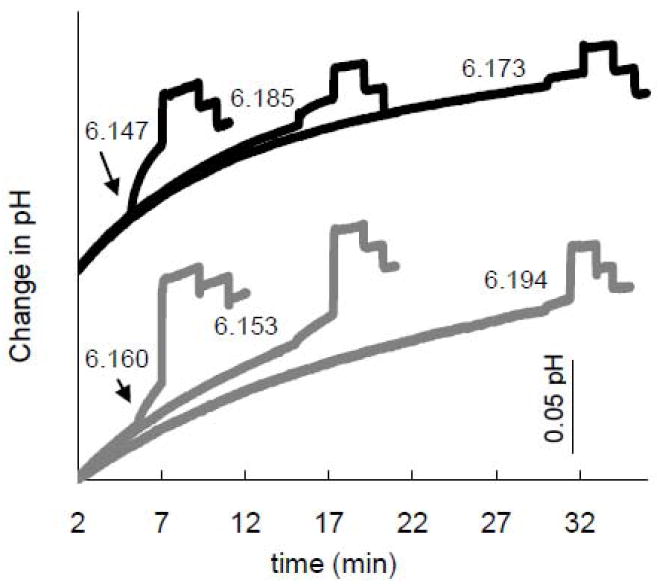
pH traces with varying delays after acidification to evaluate total liposome proton-uptake signal rundown, (the sum of the valinomycin and the CCCP uptake signals). Each trace is representative of a set of three equivalent experiments. pH traces for protein-containing (black) and protein-free (grey) liposomes were aligned vertically to start at different levels (at the arbitrary reference time of t=2 min)for ease of comparison. The exact pH at the time of valinomycin addition for each individual experiment is indicated next to each trace. The start time is designated as the time of bath acidification, which establishes a pH gradient but should only cause minimal H+ flux in the absence of antiport of K+. 0.1 mg M2(22-62):20 mg lipid:1 ml internal buffer diluted 100-fold into weak external buffer. Blank-subtracted specific activity at t=5 minutes: 19±4 H+/tetramer-s (N=2; pHo 6.2).
Figure 5 shows the normalized average total proton uptake signal degradation from the experiment in Figure 4 and two additional identical experiments. As shown qualitatively in figure 4, the decay rate is lower for the protein-free liposomes (squares) than for the proteoliposomes (diamonds), indicating that M2 enhances K+ leakage. The average K+ flux through M2(22-62) for the three experiments was 0.10 K+/tetramer-s, yielding a single-channel time-average K+ efflux permeability (K+ efflux/[K+]i) of 1.1×10⁻⁶ aLs-1. The single-channel time-average proton influx permeability (H+ influx/[H+]o) was 40 aLs-1. One estimate of the permeability ratio is the product of the ratio of these efflux and influx permeabilities, 2.8×10⁻⁸, and the electric driving force ratio, which equals 100 (the K+ dilution factor). Neglecting the rundown of the membrane potential, this product gives a net electrochemical permeability ratio of 2.8×10⁻⁶.
Figure 5.
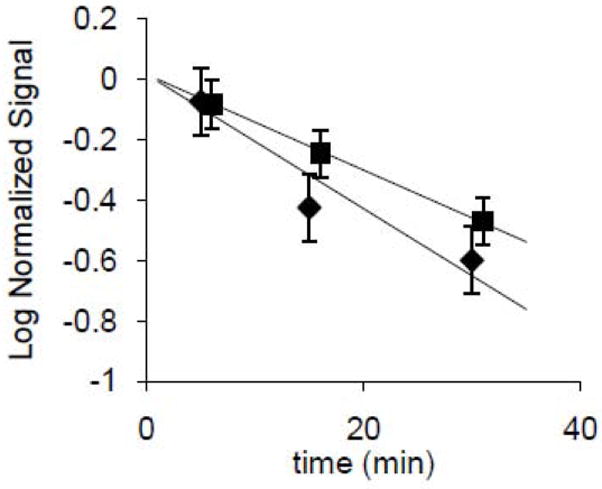
Logarithmic representation of total liposomal proton uptake, a proxy for effective trapped volume, from figure 4. Diamonds (laterally offset for clarity) represent proteoliposomes and squares represent protein-free liposomes. Total signal, corrected for artifacts (measured separately) due to addition of ethanolic valinomycin and CCCP, was normalized by extrapolation of the assumed exponential decay to 0-time total uptakes of 143±4 nEq H+ (proteoliposomes) and 200±40 nEq H+ (protein-free liposomes). The difference is presumably due to different decays during the 3 minute period between dilution and acidification, which apparently was greater for the M2(22-62) liposomes than the protein-free liposomes, (also self-consistent with the steeper slope for M2(22-62) liposomes). The normalization thus corrects for unequal initial effective total trapped volumes at the time of acidification. Total heights were corrected by subtraction of a small proportion, 15 nEq H+ (one half the back titration pH change) in each case, to compensate for pH changes observed upon addition of the effectively alkaline ethanolic reagents (valinomycin and CCCP), to liposome-free buffer. Error bars for each point represent ±1 SD, N=3.
Results of a range of liposome proton flux experiments performed at pHs ranging from 6.5 to 4.0 are plotted in Figure 6. The flux increases with decreasing pHo down to pH 5.5, but then drops abruptly. With amantadine present, the flux is ~80% blocked at pH 5.5. At pH 6.5, the interexperimental errors are too large to detect block in this set of experiments, so it is not possible to compare these results to those in Figure 1, but there is clear evidence of block at the lower pH levels. Protein-free liposomes fluxes were small (~1 H+/tetramer-s, data not shown)and were subtracted. Transport rises following a theoretical binding curve having a pK of 6.0, a maximum flux of 170 H+/tetramer-s, and a Hill coefficient that doesn’t differ significantly from unity.
Fig. 6.
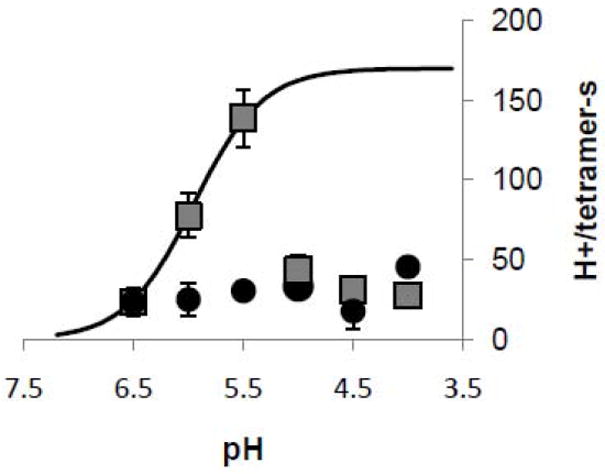
Acid activation of M2(22-62) (squares). Proton flux measurements were done with pHo of 6.5 to 4.0. For experiments with amantadine (circles), liposomes were incubated in 0.1 mM amantadine overnight, and external buffer contained 0.1 mM amantadine as well. Proton flux measurements were corrected for baseline H+ leakage into the liposomes prior to valinomycin addition, and for valinomycin-induced H+ leak observed in protein-free liposomes. Fluxes are doubled as a correction for protein orientation and gating. The saturation curve was fitted with a pKa of 6.0, a maximum flux of 170 H+/tetramer-s, and a Hill coefficient of 1.4. The error bar for each point represents ±1 S.E., calculated as the square root of the sum of the standard errors of the means for the test group and the control (protein-free liposomes) group. From left to right, N=6, 5, 6, 9, 8, and 4 for the protein; N=3, 3, 2, 3, 3, and 3 for the amantadine experiments. Strong external citrate buffer was used. Nominal membrane potential: -114 mV; pHi=8.0.
4 Discussion
As has been demonstrated previously for M2(18-60)[13] and M2(19-62)[3], M2(22-62) has proton flux activity, amantadine sensitivity, and H+ selectivity similar to the full-length protein. The proton initial-flux per tetramer is higher than in prior liposome assay reports using either full-length M2[3, 11] or similar conductance domain constructs[3, 13], due in part to the use here of dual gradients: pH and Vm. The peptide is acid activated and yields higher transport rates at low external pH, but ceases to function below pH 5.5, which we interpret to mean that transporter function is disrupted at low pH, consistent with a decrease (for decreasing pH) in tetramerization constant for the TMD in detergent micelles[26]. Because the vesicle interior starts at pH 8.0, the assumption that tetramers with N-terminus inside (presumably half the total[11]) are gated closed[5, 6, 9, 18] seems justified for the initial-flux period. However, complete block has not been confirmed in the liposome environment, and in erythroleukemia cells Weybridge M2 is only blocked 50%[18]. Peptide density affects specific activity. At the lowest density tested (0.05% peptide weight relative to lipid weight, or 4 tetramers per 150-nm diameter liposome), specific activity was diminished, consistent with diminished tetramericity[28], but not statistically significant. At high density, specific activity also falls off, as if non-specific transport depolarizes the liposomes prematurely. This would be consistent with disruption of membrane integrity, perhaps by lateral aggregation of tetramers. The optimal density for the external pH assay was determined to be a protein:lipid (wt:wt) ratio of 1:200. Total signal degradation was used to estimate M2(22-62) K+ transport and found to be small, considering the potassium concentration inside the liposomes, yet high enough to largely depolarize the vesicles on the 30 minute time scale. Amantadine and cyclooctylamine were found to inhibit transport by 61 and 50%, respectively, at very low concentrations (10 μM), as would be expected for a single site binding isotherm with Ki = 9 μM[19]. Acid activation was demonstrated for the first time in the liposome assay using external acidification. The maximal activity of 139 protons/tetramer-s (Fig. 6) was observed at pH 5.5. Possible protein destabilization or desensitization, or liposome depolarization eliminated proton flux at lower pHs. This may have influenced the parameters of the fitting function, so the maximum flux rate of >160 H+/tetramer-s should be taken as a conservative estimate. The amantadine block was most accurately determined at pH 5.5 where it was 78%.
4.1 Analysis of Uncertainties
We observe variations, from experiment to experiment, in the shape of the valinomycin and CCCP peaks, the baseline drift, and to a lesser extent in the shape of the back-titration pH drop. We take the shape of the back-titration as an indication of variations in stirring. Typically, the back titration settles in about 2 seconds. Initial flux is taken from the linear portion of the valinomycin peak, typically 2-7 seconds post valinomycin addition. This approach is based on the assumption that the valinomycin peak shape is a single exponential, but in some experiments there appear to be multiple exponentials, perhaps representing embedded compartments. We also observe substantial baseline drift before addition of valinomycin, probably due to the low intrinsic lipid permeability to both protons and potassium ions. In addition to variations in signal shapes in the liposome assays, two major sources of uncertainty, unaddressed to date, might affect the specific activity estimates: liposome activity and protein functionality. For liposomes to be fully functional, they must be configured to hold a membrane potential, namely they must be enclosed shells impermeable to the ions. Likewise, any protein not forming parallel tetramers (e.g. monomers, dimers, surface-associated protein, or protein dissolved in water or lost in extrusion) would contribute no flux in the assay. There is also some decay in the polarization of the vesicles after dilution and/or acidification and decay in the apparent initial flux during the dead time. These uncertainties all lead to underestimation of the specific activity, so the values presented here represent lower bounds. We note that amantadine concentrations reported here are total concentrations with no correction for lipid binding. The partition constant of amantadine in charged phosophocholine bilayers is 84[29]. Because the E. coli lipid bears a similar amount of charge, we estimate that the aqueous concentration of amantadine in the experiments reported here was only reduced by ~1.7%.
4.2 Comparison to previous results
The specific transport rate of full-length M2 in oocytes was initially reported[16] as 0.5 fA (3100 protons/tetramer-s) at Vm = -130 mV, pHo 6.2, pHi ~7.4. However, the reported measurements of protein density and total oocyte conductance were subsequently reevaluated[11] and shown to indicate a time average single channel proton current of 34 aA (210 protons/tetramer-s). This time-average conductance is low, but is actually higher than one might expect for an open gramicidin channel, which should conduct 127 aA at (symmetrical) pH 6.2, -130 mV (assuming linear extrapolations from 7.7 pA in phosphatidylcholine bilayers with 0.1 N HCl at 50 mV[30] to lower [H+] and more negative Vm). Considering the Po for gA under similar phospholipid environment conditions, 0.027[31], the time-averaged gA current would be predicted to be 3.4 aA, ten times lower than M2. At the pH levels attainable in cellular systems, M2 does not produce the membrane current noise expected for on-off oscillations of pS-conductance and noise analysis suggested a single channel current below 10 fA[6]. The time-average single-channel K+ current reported here, at 0.1 ions/s, i.e. 1.6×10⁻⁸ pA, would also be undetectable using single-channel current measurements or noise analysis. Hence, the proton transport rates observed with the liposome assay here are not inconsistent with aqueous pore expectations for a proton-selective channel. Nevertheless, we favor the use of the term “proton transporter”[9] because of the apparent saturation of transport at modest [H+] levels[6, 32]. The permeability of M2(22-62) to K+, relative to H+ determined quantitatively here from the total signal decay (2.8×10⁻⁶) is consistent with the lower bound on selectivity (3×10⁻⁷) determined previously from short time scale experiments with liposomes[11].
The proton uptake rates observed in our liposome assays are higher than previously published, perhaps because previous work relied only on a membrane potential driving force[11, 12] or only on a pH gradient[13], and here both gradients are applied. In liposome assays, reconstituted full-length Udorn influenza A M2 protein was found to be randomly oriented in liposomes and to transport protons selectively and with the typical amantadine sensitivity at transport rates of 7 protons/tetramer-s[11] (efflux, with symmetric pH ~7.4 and Vm = 150 mV, 18° C), 4.8 protons/tetramer-s (influx, symmetric pH 7.4, Vm = -120 mV, 18° C)[3] or lower[12]. Changing pHo to 5.7 enhanced conductance (reported Vm = -94 mV), to 17 protons/tetramer-s[11]. But, for these experiments, we would argue that the membrane potential set by the outward sodium gradient (if monensin transport dominates), would be -150 mV or -131 mV, depending on the dilution that was used, and that the thermodynamic driving force due to the H+ gradient, -94 mV would add to the electrical potential. Therefore, the increase in current may not have corresponded to as great a conductance increase as presented because the driving force was considerably higher as well. Nevertheless, there was an increase in transporter activity at low pH. The isolated transmembrane domain, M2(20-or 22-46), yielded a similar proton uptake in the liposome assay[3, 13, 33]. Longer constructs yielded transport rates of 6.5 protons/tetramer-s (M2(18-60) with symmetrical K+ and valinomycin, pHo = 6.1; pHi = 7.7, presumably at room temperature)[13] and 2.3 protons/tetramer-s (M2(19-62) with symmetrical pH 7.4, Vm = -120 mV, 18° C)[3]. In all but one[3] of the aforementioned reports of liposome transport rates to date, the measured specific activity has been doubled to yield an apparent specific activity that accounts for the assumed random orientation of the tetramers and N-terminal acid gating. The results reported here indicate that the transport rate in liposomes is considerably higher, and may be higher still when uncertainties about liposome and protein activity are settled. The high internal pH might be key to the high proton influx we observed at pH 5.5 (200 H+/tetramer/s), as previous liposome experiments with symmetrical pH 5 did not produce such a large proton uptake[11, 12]. The transport rate under conditions (pHo 6.0, pHi 8.0, -114 mV) nearest to those used for measuring specific activities in the oocytes is 78±14 (SE, N=6) H+/tetramer-s, approaching the reevaluated value for oocytes, 210 H+/tetramer-s[11].
5 Conclusions
The truncated M2(22-62) protein shows normal functionality for proton flux activity when compared to the full-length M2 protein, including amantadine and cyclooctylamine sensitivity, acid activation, and proton selectivity. When combined pH and voltage gradients and low protein density are used, single channel proton transport rates approach those observed in oocytes.
Acknowledgments
The authors are grateful to William DeGrado and Sindra Peterson Årsköld for sharing a manuscript prior to publication. Supported by NIH AI23007.
Footnotes
Publisher's Disclaimer: This is a PDF file of an unedited manuscript that has been accepted for publication. As a service to our customers we are providing this early version of the manuscript. The manuscript will undergo copyediting, typesetting, and review of the resulting proof before it is published in its final citable form. Please note that during the production process errors may be discovered which could affect the content, and all legal disclaimers that apply to the journal pertain.
References
- 1.Hayden FG. Antiviral resistance in influenza viruses--implications for management and pandemic response. N Engl J Med. 2006;354:785–788. doi: 10.1056/NEJMp068030. [DOI] [PubMed] [Google Scholar]
- 2.Gubareva L, Okomo-Adhiambo M, Deyde V, Fry AM, Sheu TG, Garten R, Smith C, et al. Update: Drug Susceptibility of Swine-Origin Influenza A (H1N1) Viruses, April 2009. Morbidity Mortality Weekly. 2009;58:1–3. [PubMed] [Google Scholar]
- 3.Ma C, Polishchuk AL, Ohigashi Y, Stouffer AL, Schön A, Magavern E, Jing X, Lear JD, Freire E, Lamb RA, DeGrado WF, Pinto LH. Indentification of the functional core of the influenza A virus A/M2 proton-selective ion channel. Proc Natl Acad Sci U S A. 2009;106:12283–12288. doi: 10.1073/pnas.0905726106. [DOI] [PMC free article] [PubMed] [Google Scholar]
- 4.Jing X, Ma C, Ohigashi Y, Oliveira FA, Jardetzky TS, Pinto LH, Lamb RA. Functional studies indicate amantadine binds to the pore of the influenza A virus M2 proton-selective ion channel. Proc Natl Acad Sci U S A. 2008;105:10967–10972. doi: 10.1073/pnas.0804958105. [DOI] [PMC free article] [PubMed] [Google Scholar]
- 5.Mould JA, Drury JE, Frings SM, Kaupp UB, Pekosz A, Lamb RA, Pinto LH. Permeation and activation of the M2 ion channel of influenza A virus. J Biol Chem. 2000;275:31038–31050. doi: 10.1074/jbc.M003663200. [DOI] [PubMed] [Google Scholar]
- 6.Chizhmakov IV, Geraghty FM, Ogden DC, Hayhurst A, Antoniou M, Hay AJ. Selective proton permeability and pH regulation of the influenza virus M2 channel expressed in mouse erythroleukaemia cells. J Physiol. 1996;494(Pt 2):329–336. doi: 10.1113/jphysiol.1996.sp021495. [DOI] [PMC free article] [PubMed] [Google Scholar]
- 7.Duff KC, Ashley RH. The transmembrane domain of influenza A M2 protein forms amantadine-sensitive proton channels in planar lipid bilayers. Virology. 1992;190:485–489. doi: 10.1016/0042-6822(92)91239-q. [DOI] [PubMed] [Google Scholar]
- 8.Vijayvergiya V, Wilson R, Chorak A, Gao PF, Cross TA, Busath DD. Proton conductance of influenza virus M2 protein in planar lipid bilayers. Biophys J. 2004;87:1697–1704. doi: 10.1529/biophysj.104.043018. [DOI] [PMC free article] [PubMed] [Google Scholar]
- 9.Busath DD. Influenza A M2: Channel or Transporter? Vol. 10. Academic Press; Burlington: 2009. pp. 161–201. [Google Scholar]
- 10.Lin TI, Heider H, Schroeder C. Different modes of inhibition by adamantane amine derivatives and natural polyamines of the functionally reconstituted influenza virus M2 proton channel protein. J Gen Virol. 1997;78(Pt 4):767–774. doi: 10.1099/0022-1317-78-4-767. [DOI] [PubMed] [Google Scholar]
- 11.Lin TI, Schroeder C. Definitive assignment of proton selectivity and attoampere unitary current to the M2 ion channel protein of influenza A virus. J Virol. 2001;75:3647–3656. doi: 10.1128/JVI.75.8.3647-3656.2001. [DOI] [PMC free article] [PubMed] [Google Scholar]
- 12.Moffat JC, Vijayvergiya V, Gao PF, Cross TA, Woodbury DJ, Busath DD. Proton transport through influenza A virus M2 protein reconstituted in vesicles. Biophys J. 2008;94:434–445. doi: 10.1529/biophysj.107.109082. [DOI] [PMC free article] [PubMed] [Google Scholar]
- 13.Pielak RM, Schnell JR, Chou JJ. Mechanism of drug inhibition and drug resistance of influenza A M2 channel. Proc Natl Acad Sci U S A. 2009;106:7379–7384. doi: 10.1073/pnas.0902548106. [DOI] [PMC free article] [PubMed] [Google Scholar]
- 14.Sharma M, Yi M, Dong H, Qin H, Peterson E, Busath DD, Zhou H-X, Cross TA. Atomistic Mechanism of the Influenza A Proton Channel from a Structure Solved in a Lipid Bilayer. Science Accepted Pending Acceptable Revisions. doi: 10.1126/science.1191750. [DOI] [PMC free article] [PubMed] [Google Scholar]
- 15.Leiding T, Wang J, Martinsson J, Degrado WF, Arskold SP. Proton and cation transport activity of the M2 proton channel from influenza A virus. Proc Natl Acad Sci U S A. doi: 10.1073/pnas.1009997107. [DOI] [PMC free article] [PubMed] [Google Scholar]
- 16.Mould JA, Li H-C, Dudlak CS, Lear JD, Pekosz A, Lamb RA, Pinto LH. Mechanism for proton conduction of the M2 ion channel of influenza A virus. J Biol Chem. 2000;275:8592–8599. doi: 10.1074/jbc.275.12.8592. [DOI] [PubMed] [Google Scholar]
- 17.Pinto LH, Holsinger LJ, Lamb RA. Influenza virus M2 protein has ion channel activity. Cell. 1992;69:517–528. doi: 10.1016/0092-8674(92)90452-i. [DOI] [PubMed] [Google Scholar]
- 18.Chizhmakov IV, Ogden DC, Geraghty FM, Hayhurst A, Skinner A, Betakova T, Hay AJ. Differences in conductance of M2 proton channels of two influenza viruses at low and high pH. J Physiol. 2003;546:427–438. doi: 10.1113/jphysiol.2002.028910. [DOI] [PMC free article] [PubMed] [Google Scholar]
- 19.Wang C, Takeuchi K, Pinto LH, Lamb RA. Ion channel activity of influenza A virus M2 protein: characterization of the amantadine block. J Virol. 1993;67:5585–5594. doi: 10.1128/jvi.67.9.5585-5594.1993. [DOI] [PMC free article] [PubMed] [Google Scholar]
- 20.Tu Q, Pinto LH, Luo G, Shaughnessy MA, Mullaney D, Kurtz S, Krystal M, Lamb RA. Characterization of inhibition of M2 ion channel activity by BL-1743, an inhibitor of influenza A virus. J Virol. 1996;70:4246–4252. doi: 10.1128/jvi.70.7.4246-4252.1996. [DOI] [PMC free article] [PubMed] [Google Scholar]
- 21.Whitney JG, Gregory WA, Kauer JC, Roland JR, Snyder JA, Benson RE, Hermann EC. Antiviral Agents: 1. Bicyclo[2.2.2]octan- and oct-2-enamines. J Med Chem. 1970;13:254–260. doi: 10.1021/jm00296a021. [DOI] [PubMed] [Google Scholar]
- 22.Aldrich PE, Hermann EC, Meier WE, Paulshock M, Prichard WW, Synder JA, Watts JC. Antiviral agents. 2. Structure-activity relations of compounds related to 1-adamantanamine. J Med Chem. 1971;14:535–543. doi: 10.1021/jm00288a019. [DOI] [PubMed] [Google Scholar]
- 23.Hay AJ, Wolstenholme AJ, Skehel JJ, Smith MH. The molecular basis of the specific anti-influenza action of amantadine. EMBO J. 1985;4:3021–3024. doi: 10.1002/j.1460-2075.1985.tb04038.x. [DOI] [PMC free article] [PubMed] [Google Scholar]
- 24.Balannik V, Wang J, Ohigashi Y, Jing X, Magavern E, Lamb RA, Degrado WF, Pinto LH. Design and pharmacological characterization of inhibitors of amantadine-resistant mutants of the M2 ion channel of influenza A virus. Biochemistry. 2009;49:696–708. doi: 10.1021/bi9014488. [DOI] [PMC free article] [PubMed] [Google Scholar]
- 25.Kolocouris N, Zoidis G, Foscolos GB, Fytas G, Prathalingham SR, Kelly JM, Naesens L, De Clercq E. Design and synthesis of bioactive adamantane spiro heterocycles. Bioorg Med Chem Lett. 2007;17:4358–4362. doi: 10.1016/j.bmcl.2007.04.108. [DOI] [PubMed] [Google Scholar]
- 26.Salom D, Hill BR, Lear JD, DeGrado WF. pH-dependent tetramerization and amantadine binding of the transmembrane helix of M2 from the influenza A virus. Biochem. 2000;39:14160–14170. doi: 10.1021/bi001799u. [DOI] [PMC free article] [PubMed] [Google Scholar]
- 27.Kochendoerfer GG, Salom D, Lear JD, Wilk-Orescan R, Kent SB, DeGrado WF. Total chemical synthesis of the integral membrane protein influenza A virus M2: role of its C-terminal domain in tetramer assembly. Biochem. 1999;38:11905–11913. doi: 10.1021/bi990720m. [DOI] [PubMed] [Google Scholar]
- 28.Veatch WR, Mathies R, Eisenberg M, Stryer L. Simultaneous fluorescence and conductance studies of planar bilayer membranes containing a highly active and fluorescent analog of gramicidin A. J Mol Biol. 1975;99:75–92. doi: 10.1016/s0022-2836(75)80160-4. [DOI] [PubMed] [Google Scholar]
- 29.Wang J, Schnell JR, Chou JJ. Amantadine partition and localization in phospholipid membrane: a solution NMR study. Biochem Biophys Res Commun. 2004;324:212–217. doi: 10.1016/j.bbrc.2004.09.039. [DOI] [PubMed] [Google Scholar]
- 30.Phillips LR, Cole CD, Hendershot RJ, Cotten M, Cross TA, Busath DD. Noncontact dipole effects on channel permeation. III. Anomalous proton conductance effects in gramicidin. Biophys J. 1999;77:2492–2501. doi: 10.1016/S0006-3495(99)77085-2. [DOI] [PMC free article] [PubMed] [Google Scholar]
- 31.Jones TL, Fu R, Nielson F, Cross TA, Busath DD. Gramicidin channels are internally gated. Biophysical Journal. 2010;96 doi: 10.1016/j.bpj.2009.11.055. TBA. [DOI] [PMC free article] [PubMed] [Google Scholar]
- 32.Shimbo K, Brassard DL, Lamb RA, Pinto LH. Ion selectivity and activation of the M2 ion channel of influenza virus. Biophys J. 1996;70:1335–1346. doi: 10.1016/S0006-3495(96)79690-X. [DOI] [PMC free article] [PubMed] [Google Scholar]
- 33.Hu J, Fu R, Nishimura K, Zhang L, Zhou HX, Busath DD, Vijayvergiya V, Cross TA. Histidines, heart of the hydrogen ion channel from influenza A virus: toward an understanding of conductance and proton selectivity. Proc Natl Acad Sci U S A. 2006;103:6865–6870. doi: 10.1073/pnas.0601944103. [DOI] [PMC free article] [PubMed] [Google Scholar]