

Abstract
Inbred strains of mice differ in their susceptibility to excitotoxin-induced cell death, but the genetic basis of individual variation is unknown. Prior studies with crosses of the FVB/NJ (seizure-induced cell death susceptible) mouse and the seizure-induced cell death resistant mouse, C57BL/6J, revealed the presence of three quantitative trait loci (QTLs), named Sicd1 to Sicd3. To better localize and characterize the Sicd2 locus, two reciprocal congenic mouse strains were created. While the B6.FVB-Sicd2 congenic mouse was without effect on modifying susceptibility to seizure-induced excitotoxic cell death, the FVB.B6-Sicd2 congenic mouse, in which the Chr 15 region of C57BL/6J was introgressed into FVB/NJ, showed reduced seizure-induced excitotoxic cell death following kainate administration. Phenotypic comparison between FVB and the congenic FVB.B6-Sicd2 strain confirmed that the Sicd2 interval harbors gene(s) conferring strong protection against seizure-induced excitotoxic cell death. Interval-specific congenic lines (ISCL) that encompass Sicd2 on Chr 15 were generated and were used to fine-map this QTL. Resultant progeny were treated with kainate and examined for the extent of seizure-induced cell death in order to deduce the Sicd2 genotypes of the recombinants through linkage analysis. All of the ISCLs exhibited reduced cell death associated with the C57BL/6J phenotype, however, ISCL-2 showed the most dramatic reduction in seizure-induced cell death in both area CA3 and in the dentate hilus. These findings confirm the existence of polymorphic loci within the reduced critical region of Sicd2 that regulate the severity of seizure-induced cell death.
Keywords: seizure, kainate, quantitative trait locus, hippocampus, excitotoxicity, FVB/NJ, C57BL/6J
INTRODUCTION
Excitotoxic cell death is a process that is of critical importance in the neuronal death that occurs after epilepsy, stroke, traumatic brain injury and a range of other central nervous system pathologies (Olney et al., 1986; Choi, 1988; Olney, 1989). It has become increasingly clear that susceptibility to excitotoxic cell death is influenced by multiple genetic factors, and much research has focused on identifying genes that may contribute to the pathogenic sequelae of neuronal damage. We and others have reported that inbred strains of mice differ in the severity of seizure-induced excitotoxic cell death following kainate administration, providing a model to study the differences in responses associated with a spectrum of pathological outcomes (Schauwecker and Steward, 1997; McKhann et al., 2003; McLin and Steward, 2006). However, the genetic elements responsible for the differing severities of seizure-induced cell death have not been identified.
One approach to the dissection of complex forms of susceptibility to seizure-induced cell death is to study common variations in rodent animal models (Darvasi, 1998; Cardon and Bell, 2001; Mackay, 2001). Quantitative trait locus (QTL) mapping analyses have identified the susceptible loci contributing to seizure-induced excitotoxic cell death in inbred mouse strains (Schauwecker et al., 2004). Highly significant QTLs that control susceptibility to seizure-induced cell death were identified on chromosomes 18, 15, and 4 and designated Sicd, for seizure-induced cell death. By QTL analysis of the Chr 15 locus with a B6 X FVB N2 backcross (Schauwecker et al., 2004), we previously demonstrated significant LOD scores for susceptibility. This locus encompassed a region of approximately 29.5 cM and was designated as the seizure-induced cell death 2 locus (Sicd2). We chose congenic mapping as a strategy to dissect the Sicd2 loci.
Confirmation of linkage is best achieved using congenic mouse strains (Wakeland et al., 1997; Nadeau et al., 2000) that allow further characterization and the eventual identification of the actual gene contributing to seizure-induced cell death susceptibility. In keeping with proven strategies for analyzing seizure-induced cell death QTL in the FVB-B6 model, we describe here the generation of a reciprocal pair of Chromosome 15 congenic strains that is based on previous genome scan data. We hypothesized that if alleles on Chromosome 15 are sufficient to confer resistance to seizure-induced excitotoxic cell death, then the congenic strain FVB.B6-Sicd2, should show reduced excitotoxic cell death relative to the FVB background strain. Subsequently, to evaluate the Sicd2 QTL exhibiting linkage and refine its location, and as the first step toward positionally cloning the respective genes, we generated interval-specific congenic lines (ISCL) encompassing Sicd2 (Chr 15). Results from these studies confirmed the importance of the Chr 15 QTL in modifying seizure-induced excitotoxic cell death, established congenic mice to further resolve this Sicd susceptibility locus, and narrowed the Sicd2 interval.
MATERIALS AND METHODS
Animals and generation of congenic strains
Single congenics (FVB.B6-Sicd2, B6.FVB-Sicd2), interval-specific congenic strains of FVB.B6-Sicd2 and control FVB mice were used. All breeding was performed at the Zilkha Neurogenetic Institute at the USC Keck School of Medicine and both FVB mice and congenic mice were bred in parallel in the same colony room. Congenic mouse strains had been generated using a speed congenic strategy as previously described for the Sicd1 strain (Lorenzana et al., 2007), and were bred separately from FVB mice. In the Sicd2 single congenic strain, the region is on Chromosome 15 between markers D15Mit174 (33.9 Mb) and D15Mit156 (71.15 Mb), spanning 37.3 Mb, about 36% of the chromosome. Briefly, two congenic strains, for chromosome 15 (B6.FVB-Sicd2 and FVB.B6-Sicd2) were established by using a backcross marker-assisted breeding schedule to fix the Sicd2 interval from the donor strain onto the recipient strain. Animals were selected for the presence of donor markers within the desired interval and recipient markers in the remainder of the genome before each new round of backcrossing. After an average of 5–6 successive generations of selective backcrossing, the recipient genetic background was eliminated in the specific region by >99.99%, as indicated by six polymorphic markers. Male and female N6F1 congenic animals that were homozygous for the introgressed D15Mit174-D15Mit156 region from either the B6 (FVB.B6-Sicd2) or FVB (B6.FVB-Sicd2) strain were identified and mated together to complete and perpetuate the strain for future studies. The resultant congenic mouse strains were subsequently maintained by sister/brother mating. All mice were maintained on a 12-h light/dark schedule with food and water available ad libitum. All experiments were approved by the University of Southern California Institutional Animal Care and Use Committee, in accordance with The National Institutes of Health Guide for the Care and Use of Laboratory Animals.
Development of a series of interval-specific congenic lines for fine-mapping Sicd2 and progeny testing
The series of ISCL 1–3 was developed and bred in our colony at the Zilkha Neurogenetic Institute at the University of Southern California Keck School of Medicine. Individual congenic recombinant mice (FVB.B6-Sicd2) were backcrossed to FVB mice (purchased from Jackson Laboratories, Bar Harbor, ME), resulting in multiple offspring with the same recombination (also referred to as an ISCL). Conventional congenic mice (FVB.B6-Sicd2) were backcrossed to FVB mice. Individual progeny were genotyped using 6 microsatellite markers within or flanking the Sicd QTL on mouse chromosome 15 (referred to as Sicd2) to identify recombinant mice and define the boundaries of the introgressed region. Individual recombinant mice were backcrossed to FVB mice (purchased from Jackson Laboratories, Bar Harbor, ME), resulting in multiple offspring with the same recombination (ISCL). At the same time that recombinations in the previous generation were being replicated, additional recombinants were sought in two subsequent backcross generations in an ever-narrowing QTL interval and replicated as needed. These mice were heterozygous for a reduced B6 interval; they were then intercrossed to produce homozygotes, which were intermated to produce and maintain the ISCLs. A final intercross using ISCL-1-3 animals was performed to isolate the donor homozygotes, which constituted the finished ISCL strain. No genotyping, other than on the B6 interval, was done in the ISCLs as the backcross was always to FVB. A total of three ISCLs were developed and replicated for phenotype analysis.
A total of three ISCLs were developed and replicated for phenotype analysis. The phenotoypic effects of the Sicd2 region in ISCLs1-3 were assessed by progeny testing (Darvasi, 1997, 1998) by comparing the phenotype of mice homozygous for the recombinant chromosome with that of FVB controls. Identification of the ISCLs that show a QTL effect on the phenotype of susceptibility and the ISCLs that do not show a QTL effect on the phenotype of susceptibility defined the critical genomic interval required for the QTL effect.
Isolation of DNA and microsatellite genotyping
High-molecular weight mouse tail DNA was used as a template for PCRs. Genomic DNA was extracted from the tail of the animal according to a previously established protocol (Miller et al., 1988). Briefly, a small piece (~1 cm) of the tip of the tail was cut off using sharp scissors. Tail tips were incubated overnight at 55°C in 635 μL of lysis solution containing 600 μL Tris-NaCl-EDTA-SDS buffer (10 mm Tris, pH 7.5, 400 mm NaCl, 100 mm EDTA and 0.6% sodium dodecyl sulfate) and 35 μL proteinase K (10 mg/mL). DNA was isolated using a high-salt method, and standard procedures of ethanol precipitation and resuspension in Tris-EDTA (10 mm Tris, 1 mm Na2-EDTA, pH 7.4) and storage at 4°C. After redissolving the DNA, DNA concentrations were determined spectrophotometrically and samples diluted to 100 ng/μl.
Our PCR method has been previously described (Schauwecker et al., 2004). In brief, microsatellite primers were purchased from Invitrogen (Carlsbad, CA, USA). Primers were selected based on their map locations and on their being polymorphic between parental strains (http://www.genome.mit.edu). After a 3-min incubation at 94°C, the reactions were amplified through 35 cycles of 30 s at 94°C, 60 s at 55°C and 45 s at 72° C, followed by 10 min at 72°C. For markers with allele differences of 8 bp or greater, we used a non-isotopic method of analysis involving sizing of the PCR products by loading them onto 4% agarose gels (Genepure Hi-Res Agarose, ISC Bioexpress, Kaysville, UT, USA) and visualizing them with ethidium bromide staining of PCR products. After electrophoresis, two independent scorers recorded genotypes from gels analysed with a digital gel documentation system (Gel-Doc It, UVP, Upland, CA, USA) that provides digital images from ethidium bromide-stained gels. To minimize genotyping errors, any discrepancies or inconsistencies in genotype readings were resolved either by retyping or discarding questionable genotypes. The map positions of the microsatellite markers and genes were derived from either the April 2007 (NCBI Build m37) release of the Mouse Genome Sequencing Consortium (http://www.genome.ucsc.edu/) or its centimorgan (cM) position from the Mouse Genome Database (http://www.informatics.jax.org/ January 2009).
Kainate model of temporal lobe epilepsy
Young adult mice (6–8 weeks old) [FVB/NJ, FVB.B6-Sicd2, B6.FVB-Sicd2, ISCLs 1–3] were used in these studies. Sustained seizures (SE) were induced in animals by the administration of kainic acid (KA), a potent agonist of the AMPA/KA class of glutamate receptors. KA (Nanocs, New York) was dissolved in isotonic saline (pH 7.3) and administered subcutaneously to adult mice at a dose of 20 mg/kg. To minimize mortality due to dehydration or starvation, animals were fed moist high-fat rodent chow until animals were observed to be eating dry chow. In our experience, 20% of mice die either during SE or within 48 h.
Behavioral assessment of KA-induced seizure activity
Mice were monitored, behaviorally by an observer, continuously for 4 hours for the onset and extent of seizure activity. The behavioral progression of KA-induced seizures was rated and recorded using Racine’s classification (1972), as previous studies have shown that the behavioral seizures observed in kainate-induced SE are similar to those in the kindling model (Turski et al., 1987; Fisher, 1989; Ben-Ari and Cossart, 2000; Leite et al., 2002). The behavioral progression of KA-induced seizures was rated and recorded using the following classification: Stage 1, immobility; Stage 2, forelimb and/or tail extension, rigid posture; Stage 3, repetitive movements, head bobbing; Stage 4, rearing and falling; Stage 5, continuous rearing and falling; and Stage 6, severe tonic-clonic seizures. Only those mice exhibiting at least 45 min of continuous stage 5 seizures were included in this study, as previous studies have suggested that there is a direct relationship between the generation of epileptiform activity and the extent of damage in hippocampal subfields (Sperk et al., 1983; Ben-Ari, 1985; Sperk, 1994).
Tissue preparation and histological staining
To evaluate the severity of brain damage associated with seizures, brains from animals of each strain were processed for light microscopic histopathologic evaluation, according to previously published methods (Schauwecker and Steward, 1997; Schauwecker et al., 2004; Lorenzana et al., 2007). Briefly, seven days following kainate administration, mice were anesthetized and transcardially perfused with 4% paraformaldehyde in 0.1M phosphate buffer (pH 7.4). Brains were removed and post-fixed overnight. Brains were left in 30% sucrose for at least 12–18 hours for cryoprotection. Horizontal (40 μm) frozen sections were cut on a sliding microtome and immersed in 0.1M phosphate buffer (pH 7.4) free-floating, until histological processing has begun.
Every sixth section (~240 μm) was processed for cresyl violet staining to assess cell loss and morphology. Alternate sections were stained with a modification of the selective Fink-Heimer silver stain, which stains degenerating fibers, synaptic terminals, and cell bodies (Nadler and Evenson, 1983), and examined for the appearance of degenerative debris. Additional sections were stained with Fluoro-Jade, a fluorescent marker for dying neurons, according to a method outlined previously (Schmued et al., 2005). Briefly, horizontal sections were mounted onto gelatin-coated slides and allowed to air-dry. Slides were then immersed in absolute alcohol for 3 min, followed by 70% ethanol for 2 min and distilled water for 2 min. The slides were then transferred to 0.06% potassium permanganate for 15 min. After rinsing with distilled water for 2 min, the slides were then incubated for 30 min in 0.001% Fluoro-Jade C solution (Chemicon, Temecula, CA) made in 0.1% acetic acid. Slides were rinsed briefly in water, allowed to air-dry for several minutes, cleared in xylene, and coverslipped with nonfluorescent mounting media (Kirkegaard and Perry Laboratories, Gaithersburg, MD). Tissue sections were examined with an epifluorescent microscope equipped for visualizing fluorescein isothiocyanate.
Morphological assessment of neuronal damage
To provide an overall picture of genotype-dependent effects on cell loss throughout the hippocampus, neuronal degeneration was evaluated in sections stained with cresyl violet. The number of degenerating neurons in both the right and left hippocampus from every sixth section (240 μm separation distance) in CA3, CA1, dentate hilus and dentate gyrus, was estimated and a histological damage score was assigned on a 0–3 grading scale according to the following criteria: grade 0, absence of pyknotic cells; grade 1.0, mild (<25% of cells pyknotic); grade 2.0, moderate (<50% of hippocampal neurons pyknotic); and grade 3.0, extensive (>50% of cells pyknotic) according to a previously defined scale (Fujikawa et al., 1994; Fujikawa, 1995, 1996; Morrison et al., 1996; Schauwecker et al., 2004). All grading was performed by an observer blinded to the treatment groups.
Values for right and left hemispheres were averaged for each mouse. For the hippocampus, scores from sections were averaged and used for calculating group values. As histological damage scores were normally distributed, we were able to use standard parametric methods of data analysis. Thus, to determine whether differences in histological scores existed among the groups of mice, results were assessed statistically by one-way ANOVA with the computer program SIGMASTAT (Jandel Scientific, San Rafael, CA) and intergroup differences were analyzed by Student Newman-Keul’s post-hoc test.
Quantitative analysis of hippocampal cell loss
To determine the susceptibility of individual hippocampal subfields to neurotoxic insult, we counted neurons in Nissl-stained sections. Quantitative analysis of hippocampal cell loss was performed by an observer blinded to the groups using unbiased stereological methods on cresyl violet-stained sections according to previously published protocols (Schauwecker and Steward, 1997; Schauwecker et al., 2000; Santos and Schauwecker, 2003). The number of Nissl-stained neurons was counted in both the right and left hemispheres in area CA3, area CA1, the dentate hilus, and the dentate gyrus. Hippocampal subfields were based on Franklin and Paxinos (1997) classification and discrimination between the CA3 and dentate hilus region was based on morphological features and locations of the cells (West et al., 1991). Specifically, for dentate hilar cell counts, the hilus was operationally defined as the region bordered by the supra- and infrapyramidal granule cell layers and excluding the densely packed pyramidal neurons of area CA3.
Neuron counts were made in all subfields and in both hemispheres of each mouse. Values for each side were averaged into single values for each animal. Surviving cells were counted only if they were contained within the pyramidal cell layer or dentate hilus, possessed a visible nucleus and characteristic neuronal morphology, and had a cell body larger than 10 μm. Counting was initiated within the ventral hippocampus at the first point where hippocampal subfields could be easily identified. This level corresponded to horizontal section 54, based on the atlas of Sidman et al. (1971). Six square counting frames (200 × 200 μm) were randomly placed in the pyramidal layer of fields CA1 and CA3 or in the dentate hilus in four to five regularly-spaced horizontal sections from each animal that were at least 240 μm apart. Only those neuronal nuclei in the focal plane were counted with a 40X objective and considered as a counting unit. Neuronal counting was performed with the aid of Image Pro-Plus software (Media Cybernetics, Inc., Silver Spring, MD) in combination with a SPOT digital camera (Diagnostic Instruments, Inc., Sterling Heights, MI) and a motorized Z-stage (Optiscan, Prior Scientific, Fairfax, VA). All data were expressed as average number of neurons per field and final cell counts are expressed as the percentage of cells as compared with intact mice.
Statistical analysis
SigmaStat (Jandel Scientific, San Rafael, CA) was used for all statistical tests. Data were presented as mean ± SEM, and differences between groups were compared statistically by one-way analysis of variance. This comparison was used to determine the mean difference in susceptibility expected from the introgressed B6 or FVB, respectively, region and the 95% confidence interval for that difference. One-way ANOVA with Student Newman Keul’s post-hoc multiple comparison test was used to assess all ISCLs for significant reduction in the extent of cell damage relative to FVB. Mean values are given for phenotypes ± SEM. Data were considered to be statistically significant when the probability value was <0.05.
RESULTS
Construction of congenic strains
By QTL analysis, we previously identified a Sicd2 locus on mouse Chr 15 that regulated susceptibility to seizure-induced excitotoxic cell death (Schauwecker et al., 2004). Two mouse congenic strains were created through introgression of the Sicd2 locus for chromosome 15. The resulting strains carried either B6 alleles for Chr 15 from 33.94 to 71.15 Mb or FVB alleles for Chr 15 from 33.94 to 71.15 Mb. As each backcross reduced the number of alleles from B6 or FVB outside the Sicd2 locus by ~50%, at the tenth backcross generation approximately 99.8% of the genome outside the Sicd2 locus was derived from B6 or FVB. Thus, any phenotypic differences between the Sicd2 congenic strains and the parental B6 or FVB strain are most likely due to B6 or FVB alleles within the Sicd2 locus that influences susceptibility to seizure-induced cell death. The size and position of each transferred Sicd2 segment as defined by testing with molecular markers is shown in Figure 1.
Fig. 1. Schematic diagram of chromosome 15 in FVB.B6-Sicd2 congenic mice.

Genetic map illustrating the introgressed chromosomal segment in the congenic strain FVB.B6-Sicd2. The first abbreviation (FVB) refers to recipient and the second abbreviation (B6) refers to donor. Darkly shaded regions reflect genomic contribution from the donor strain, C57BL/6J (B6) and lightly shaded regions reflect genomic contribution from the background, FVB/NJ (FVB) strain. DNA microsatellite markers used for genomic introgression are shown to the left of the chromosome. Numbers to the far left represent the genetic map position (http://www.informatics.jax.org/) and are given in centimorgans (cM). Sicd, seizure-induced cell death.
Influence of the Sicd2 QTL on seizure-induced excitotoxic cell death
We hypothesized that if alleles on Chr 15 are sufficient to confer resistance to seizure-induced excitotoxic cell death, then the congenic strain FVB.B6-Sicd2, should show reduced excitotoxic cell death relative to the FVB background strain. As predicted from mapping studies (Schauwecker et al., 2004), and as shown in Figures 2 and 3, histopathological evaluation confirmed that FVB.B6-Sicd2 mice (n=46) exhibited significantly reduced susceptibility to seizure-induced cell death compared to parental FVB mice (n=14) by ANOVA (F1,58=10.296, P=0.002). Cell damage scores throughout the whole hippocampus for FVB.B6-Sicd2 mice averaged 2.13 ± 0.27 versus 3.0 ± 0.1 in FVB littermates (Fig. 2a). Quantitative analysis of subfield group means revealed that FVB.B6-Sicd2 mice (n=41) showed a substantial reduction in the extent of cell death in area CA3 by ANOVA (F1,44=5.296; P=0.026) and a statistically non-significant reduction in area CA1 at 7 days following kainate administration (Figs. 2b and 3c), as compared with FVB-like littermates (n=5; Fig 3a). Thus, B6 genomic introgression with a FVB genetic background is sufficient to confer reduced susceptibility to seizure-induced cell death. These results suggest that the gene(s) responsible for the observed phenotypic effect is located in the 29.5 cm interval flanked by makers D15Mit174 and D15Mit156. In contrast, we found that susceptibility to seizure-induced cell death was no different in the B6.FVB-Sicd2 congenic strain (n=39), in which the Sicd2 interval is introgressed onto a C57BL/6J background, as compared to C57BL/6-like littermates (n=14; Fig. 2a).
Fig. 2. Confirmation that the FVB.B6-Sicd2 congenic strain captures a gene(s) that influences susceptibility to seizure-induced cell death.

(a) Data represent neuronal damage scores for the entire right and left hippocampus (in arbitrary units, mean ± SEM) for FVB.B6-Sicd2 congenic (n=46), B6.FVB-Sicd2 congenic (n=39), FVB/NJ (n=14) and C57BL/6J strains (n=14). Note that modulation of susceptibility to seizure-induced cell death was only statistically significant in FVB.B6-Sicd2 mice. (b) Quantitative analysis of neuronal density in hippocampal subfields following kainic acid (KA) administration to FVB.B6-Sicd2 congenic (n=41) and FVB mice (n=5). A strain-dependent difference in cell loss in area CA3 was observed at 7 days following KA administration. Data represent the mean ± SEM. B6, C57BL/6J; DG, dentate gyrus; Sicd, seizure-induced cell death.
Fig. 3. Kainate-induced cell death susceptibility is reduced in the FVB.B6-Sicd2 congenic strain. Susceptibility to kainate-induced cell death in the FVB/NJ (FVB) background strain and FVB.B6-Sicd2 congenic strain at 7 days following systemic administration of kainic acid.

Low-magnification Fluoro-Jade B staining (a and c) and high magnification Fluoro-Jade B staining (b and d) of horizontal sections through the hippocampus (box denotes area of high magnification). Note the significant reduction of cell loss (decreased Fluoro-Jade fluorescence) in representative sections from the FVB.B6-Sicd2 congenic mice (c,d). CA1 and CA3 hippocampal subfields; H, dentate hilus. Scale bars: a and c, 750 μm; b and d, 100 μm. B6, C57BL/6J; Sicd, seizure-induced cell death.
As susceptibility to seizure-induced cell death can be modulated by the duration and severity of seizure induction (Suchomelova et al., 2006; Berger et al., 1986; Ferraro et al., 1995; Galanopoulou et al., 2002; Holmes, 2002), we also characterized congenic strains for seizure activity following kainate administration. Following kainate injection, we found a significant decrease in the latency to first seizure by ANOVA in FVB.B6-Sicd2 mice (n=42) as compared to FVB-like littermates (n=14; Fig. 4a; F1,54=99.784, P<0.001), as well as a significant increase by ANOVA (F1,54=4.768, P=0.033) in seizure duration (Fig. 4b). In contrast, B6-like littermates (n=14) and homozygous B6.FVB-Sicd2 congenic mice (n=39) did not differ significantly with regard to latency to first seizure (Fig. 4a) or seizure duration (Fig. 4b) in response to KA injection.
Fig. 4. Histograms of seizure parameters in FVB.B6-Sicd2 and B6.FVB-Sicd2 congenic mice following kainic acid-induced status epilepticus.

(a) Data represent latency scores in minutes (mean ± SEM) for FVB.B6-Sicd2 (n=42) and B6.FVB-Sicd2 congenic (n=39), FVB/NJ (FVB; n=14) and C57BL/6J (B6; n=14) strains. ANOVA testing revealed a significant reduction in latency between FVB.B6-Sicd2 and FVB strains. (b) Data represent the seizure duration scores in minutes (mean ± SEM) for FVB.B6-Sicd2 and B6.FVB-Sicd2 congenic and FVB and B6 strains. ANOVA testing revealed a significant increase in duration of severe seizures between FVB.B6-Sicd2 and FVB strains.
Higher resolution mapping of Sicd2
The FVB.B6-Sicd2 mouse strain carries a B6-derived Chr 15 segment that spans the Sicd2 interval from D15Mit174 to D15Mit156. In order to generate ISCLs for fine-mapping the Sicd2 locus, we backcrossed the FVB.B6-Sicd2 strain to FVB and screened for recombinants. We generated three ISCLs that divided the Sicd2 locus into proximal and distal segments. Figure 5 shows the overlapping marker patterns that define a series of three interval-specific congenic strains derived from the original FVB.B6-Sicd2 congenic strain. Only backcrosses of the B6 Sicd2 interval onto the FVB background were pursued because of the apparent dominance of the B6 allele.
Fig. 5. Fine mapping of Sicd2 on Chromosome 15 with interval-specific congenic strains.
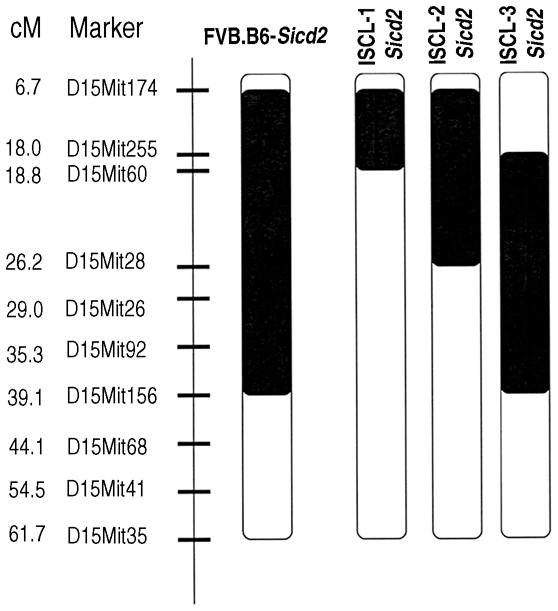
Interval-specific congenic lines (ISCL) with varying B6-derived Chr 15 segments. The B6-derived interval is shown in black, and white denotes the interval containing the recipient, FVB/NJ, strain. Strains were produced as described in Materials and methods. Microsatellite DNA markers used for selecting interval-specific recombinants are shown to the left of the chromosome. Numbers to the far left represent the genetic map position (http://www.informatics.jax.org/) and are given in centimorgans (cM). Sicd, seizure-induced cell death.
Phenotypic analysis of susceptibility to seizure-induced cell death in the Sicd2 interval-specific congenic lines
Phenotypic analysis of the extent of seizure-induced cell death in the homozygous FVB.B6-Sicd2 congenic strain suggested that a gene(s) underlying Sicd2 was captured in the introgressed interval. This conclusion is supported by data demonstrating the dramatic reduction in susceptibility to seizure-induced cell death within the FVB.B6-Sicd2 strain relative to the FVB background strain. In order to fine-map the Sicd2 locus on mouse Chr 15, we constructed a set of ISCLs selected for smaller B6-derived subintervals. Using these three novel, interval-specific congenic strains and recombinant progeny testing to reduce our Chr 15 QTL, we assessed progeny for differences in latency to seizure onset, duration of severe seizures, and susceptibility to seizure-induced cell death.
Results for latency to first seizure and seizure duration following kainate administration for the three sub-congenic lines shown in Fig. 5 are presented in Figures 6a,b. As depicted in Figure 6a, the latency to the onset of the first severe seizure differed significantly as tested by ANOVA among ISCL congenic strains and the parental inbred strain, FVB (F3,121=12.085, P<0.001). In particular a reduction by nearly 50% was observed amongst all 3 ISCL strains, as compared to the parental FVB strain. Similarly, a significant increase in the duration of severe seizures was observed in ISCLs 1(n=37) and 3 (n=45) as compared to the parental FVB strain (n=14; Fig. 6b; F3,121=14.276, P<0.001). In contrast, seizure duration in ISCL-2 (n=29) was no different than that observed in the parental FVB strain.
Fig. 6. Seizure parameters of FVB/NJ (FVB) and interval-specific recombinant strains of the FVB.B6-Sicd2 congenic mice.

(a) Latency to onset of first seizure among FVB (n=14) and interval-specific congenic lines (ISCL) 1–3 of FVB.B6-Sicd2 congenic mice is significantly reduced in ISCL-1 (n=37), ISCL-2 (n=29) and ISCL-3 (n=45) strains. Bars represent mean ± SEM. (b) Duration of severe seizures among FVB and ISCL1-3 of FVB.B6-Sicd2 congenic mice. Seizure duration was significantly increased in ISCL-1 and ISCL-3 strains as compared to FVB/NJ mice. Bars represent mean ± SEM.
Consistent with previous studies in mice (Schauwecker and Steward, 1997; Schauwecker et al., 2004), administration of KA to FVB/NJ mice led to the degeneration and loss of CA3 pyramidal neurons and hilar neurons, and sporadic loss of CA1 pyramidal neurons. Phenotypic results for the three ISCLs that underwent kainate testing are shown in Figure 7. In particular, all ISCL strains showed overall reduced hippocampal cell damage as compared with the parental FVB/N strain (n=16) when hippocampal subfields were assessed as a whole (Fig. 7a). Whereas ISCLs 1 (n=37) and 3 (n=42) showed a 23% reduction in the extent of cell death throughout the hippocampus, ISCL-2 (n=18) showed a statistically significant 49% reduction in the extent of cell death throughout the whole hippocampus (F3,109=4.886, P=0.003). Sections from each of the three ISCL groups, sacrificed 7 days following kainate injection and processed for Fluoro-Jade C and Cresyl Violet staining are shown in Figure 8. As demonstrated in Fig. 8, following kainate administration, a significant attenuation in the extent of cell loss, in area CA3, was observed in all three ISCL strains (Fig 8a–i). In particular, ISCLs 1 and 3 revealed a 26–38% loss of CA3 pyramidal neurons (Fig. 8a–f) as compared with the typical 64% loss observed in the FVB parental strain. The potent neuroprotective effect observed in ISCL-2 is illustrated in Figure 8d–f, in which a nearly 55% reduction in the extent of cell death within area CA3 is observed.
Fig. 7. Kainate-induced cell death susceptibility phenotype of FVB/NJ (FVB) and interval-specific recombinant strains of the FVB.B6-Sicd2 congenic mice.

Three interval-specific congenic lines (ISCLs 1-3) were developed and tested to attain higher resolution mapping of seizure-induced cell death (Sicd2). Strains were produced as described in Materials and Methods. (a) Susceptibility scores (cell damage score for the whole hippocampus) are given for the ISCL-1-3 (n=37 for ISCL-1; n=18 for ISCL-2; n=42 for ISCL-3) progeny (FVB.B6) and their FVBFVB littermates (n=16). Susceptibility to seizure-induced cell death was significantly less severe in ISCL-2 (FVB.B6) mice than their FVBFVB littermates. Bars represent mean ± SEM. (b) Quantitative analysis of neuronal density in hippocampal subfields following kainic acid (KA) administration to ISCL1-3 congenic lines (n=33 for ISCL-1; n=22 for ISCL-2; n=38 for ISCL-3) and FVB mice (n=16). Strain-dependent differences in cell loss in hippocampal subfields were observed at 7 days following KA administration. Data represent the mean ± SEM. B6, C57BL/6J; CA1 and CA3, hippocampal subfields; DG, dentate gyrus.
Fig. 8. Comparison of susceptibility to kainate-induced cell death in three interval-specific congenic line (ISCL) strains of the FVB.B6-Sicd2 congenic mice.

(a,d,g) Low-magnification Fluoro-Jade staining of horizontal sections through the hippocampus in ISCL-1 (a), ISCL-2 (d), and ISCL-3 (g) at 7 days following systemic administration of kainic acid. High-magnification Fluoro-Jade staining (B,E,H) and Cresyl Violet staining (c,f,i) of horizontal sections through the hippocampus in ISCL-1 (b and c), ISCL-2 (e and f), and ISCL-3 (h and i). Note that a dramatic reduction in the extent of cell death is observed in ISCL-2 throughout area CA3 (d,e,f). CA1 and CA3, hippocampal subfields; H, dentate hilus. Scale bars: a,d,g, 750 μm; b,c,e,f,h,i, 100 μm. Sicd, seizure-induced cell death. High-magnification photomicrographs represent details of the boxed area of CA3 shown in a.
Quantitative analysis of hippocampal subfield group means also revealed some surprising findings, as well (Fig. 7b). While all three ISCLs showed a significant protective effect in area CA3 as compared with the FVB/N parental strain (F3,94=38.887, P<0.001), ISCL-1 (n=33) showed a 1.6-fold reduction and ISCL-3 (n=38) showed a 1.3-fold reduction in cell death. In contrast, ISCL-2 (n=22) showed a 2.2-fold reduction in cell death as compared with FVB littermates (n=16). Within the dentate hilus, only ISCL-2 displayed a statistically significant reduction (1.3-fold) in the extent of cell death (F1,25=5.471, P=0.028) as compared with the FVB parental strain (Fig. 7b). Within the CA1 subfield, no significant reduction in the extent of cell death was observed in any of the ISCLs.
DISCUSSION
Previously, we had determined that resistance to excitotoxic cell death varies among mouse strains and some of this variation is assumed to have a genetic basis (Schauwecker and Steward, 1997). More recently, we have used QTL mapping strategies to show that this strain difference in seizure-induced cell death is a multifactorial trait determined by a complex interaction between a set of genes (Schauwecker et al., 2004). A QTL of significant effect was detected on Chromosome 15 in an N2 backcross population using a paradigm involving systemic administration of kainic acid (KA) and was termed Sicd2 (Schauwecker et al., 2004). As a strategy to confirm this locus and to map Sicd2 to a defined genomic interval, we chose to isolate the Sicd2 locus on mouse Chr 15 on a common genetic background as reciprocal congenic mouse strains. The results of experiments with reciprocal congenic strains reported here confirm that a gene(s) with a strong genetic influence on susceptibility to seizure-induced cell death lies between markers D15Mit174 and D15Mit156 on Chromosome 15.
Phenotypic analysis of the extent of seizure-induced cell death in the FVB.B6-Sicd2 congenic strain confirmed that a gene(s), located between D15Mit174 and D15Mit156 on Chr 15, plays an intrinsic role in susceptibility to seizure-induced cell death. In particular, the extent of cell death in the FVB.B6-Sicd2 congenic strain was shown to be significantly less than that of the FVB strain, thus confirming the presence of the Sicd2 QTL. A somewhat puzzling finding is the lack of significant difference in susceptibility to seizure-induced cell death between the B6.FVB-Sicd2 congenic strain and C57BL/6 background strain. The lack of an effect observed in the C57BL/6 background could reflect the influence of epistatic genetic interactions or the loss of effect of alleles, which have an opposing effect on seizure-induced cell death. As to the nature of the genetic ‘regulators’ of the Sicd2 QTL in the B6 genome, it can only be speculated at the present time. It is possible that genome regulation, probably in the form of cell death ‘suppressors’ in the C57BL/6 background could exist. As well, it is also likely that another QTL could play a role, an interaction between alleles on Chromosome 15 and specific alleles on other chromosomes may exist, and/or that genes other than QTLs could function in that capacity. Nevertheless, our results suggest that a more thorough understanding of the pathogenesis of seizure-induced cell death will require not only the identification of individual QTLs, but also a comprehension of their regulation.
Prior studies have suggested that reduced susceptibility to seizure-induced cell death could result from a reduction in seizure activity (Berger et al., 1986; Ferraro et al., 1995; Galanopoulou et al., 2002; Holmes, 2002; Suchomelova et al., 2006). Thus, we examined several seizure parameters in FVB.B6-Sicd2 congenic mice, such as latency to the onset for the first seizure and duration of severe seizures. Interestingly, despite the dramatic protective effect we observed in FVB.B6-Sicd2 congenic mice with regard to susceptibility to seizure-induced cell death in comparison to the FVB parental strain, we observed a significant reduction in the latency to the first seizure and a significant increase in seizure duration. Typically, reductions in seizure latency and increases in seizure duration suggest increased seizure sensitivity/susceptibility with resultant increases in cell death. However, we found a considerable discrepancy within the FVB.B6-Sicd2 congenic mice. Although we would have expected increased cell death, due to the decreased seizure latency and increased seizure duration, we instead found increased protection against seizure-induced cell death. The shortened latency and increased duration of seizures gives emphasis to the fact that the FVB.B6-Sicd2 mice may actually have enhanced kainate seizure sensitivity. Additionally, these results suggest that not only may the presence of B6 alleles convey protection against seizure-induced cell death, but may also influence two of our measured parameters of seizure. Nevertheless, it is important to note that although Sicd2 exerts protective effects on the development of susceptibility to seizure-induced excitotoxic cell death, these protective effects are not the result of diminished seizure sensitivity.
The extent of cell death in the FVB.B6-Sicd2 congenic strain was shown to be significantly less than that of the FVB strain, thus suggesting that a gene(s) underlying Sicd2 was captured in the introgressed interval. To address the possibility that more than one resistance gene may be located within this congenic interval and to more precisely define the minimal critical region to search for candidate genes, the original congenic mouse line (FVB.B6-Sicd2) was split into additional homozygous subcongenic mouse strains (ISCLs). While we observed a significant protective effect amongst all 3 ISCL strains when cell death was assessed throughout the whole hippocampus, as compared with FVB littermates, when cell damage was assessed across hippocampal subfields, a different pattern emerged. In particular, a significant protective effect was observed in all 3 ISCL strains throughout area CA3, a pattern reminiscent of what we had observed in FVB.B6-Sicd2 congenic mice. However, we did see a strikingly similar protective effect in area CA3 when comparing FVB.B6-Sicd2 congenic mice with ISCL-2. In contrast, we also saw a significant protective effect within the dentate hilus in ISCL-2 as well, while we did not observe such a protective effect in either FVB.B6-Sicd2 congenic mice or in the other two ISCL strains. Differences in the extent of cell death across hippocampal subfields could result from differences in gene composition within each interval and also from differences in seizure activity. It is important to note that while ISCL-2 showed the greatest protective effect and while we did see a dramatic reduction in the latency to the first seizure amongst all three ISCL strains, we did not see a significant difference in seizure duration in the ISCL-2 strain as compared with FVB/N wildtype littermates. These results seem to suggest that, in contrast to FVB.B6-Sicd2 congenic mice, genes contained within the B6 interval of ISCL-2, likely are most responsible for modulating seizure-induced cell death than seizure sensitivity.
The 21.16 Mb interval that defines the Sicd2-ISCL on Chromosome 15 contains approximately 169 known or predicted genes. Of the 169 genes in this interval between 33.9 and 55.1 Mbp, 57 of them are expressed at moderate to high levels in the brain, and several of these have been the subject of published studies. For example, two loci for familial cortical myoclonic tremor associated with epilepsy have been mapped on Chromosome 5p, Ctnnd2 and Sema5a (Depienne et al., 2010). Sempahorin 5A is a transmembrane protein which may act as a positive axonal guidance factor during development, while Ctnnd2 is a protein from the catenin family which may be involved in neuronal cell adhesion. Gdnf is a member of the transforming growth factor-β superfamily. While Gdnf was initially identified as a survival factor for dopaminergic neurons (Lin et al., 1993), it has subsequently been shown to have similar trophic effects on other neuronal populations, including hippocampal neurons (Humpel et al., 1994; Springer et al., 1994; Boscia et al., 2009). Lifr, leukemia inhibitor factor, is a member of the neuropoietic cytokine family, which has been shown to be upregulated by experimental status epilepticus (Jankowsky et al., 2000; Wenzel et al., 2000; Lehtimaki et al., 2003). Lastly, Slc1a3/GLAST is a member of the solute carrier family that encodes astroglial glutamate transporter 1 (Jen et al., 2005) with particularly high expression in the Bergmann glia of the cerebellum. Numerous studies have demonstrated that transgenic ablation, antisense down-regulation or pharmacological inhibition of Slc1a3 leads to increased extracellular glutamate and neuronal excitability (Maeda et al., 2008). A few of these genes, which are thought to play a relevant role in modulating neuronal excitability on their own, are choice candidates for further investigation. Specifically, their expression levels in the brain before and after kainate and polymorphisms in these genes in FVB and B6 should be examined in future studies.
Several major aspects emerge from the present study. First, we provide evidence that one of the three significant Sicd QTLs mapped under the same conditions gave rise to an independent congenic line in which the individual role of an additional QTL (Sicd2) was experimentally verified and confirmed. Results from progeny testing of our ISCL strains indicate that the Sicd2 critical interval is contained within a smaller region of Chr 15 and supports the proposition that the protective gene(s) is contained within this smaller interval. Although we are currently unable to definitively determine the size of this interval, further refinement of the candidate regions will enable rational candidate gene and positional cloning approaches toward the identification of the underlying genes to be undertaken. This systematic approach to dissecting the Sicd2 critical interval may lead to the identification of the causative genetic variation that underlies significant differences in susceptibility to cell death between B6 and FVB mice. Ongoing efforts in constructing sequence maps of the region together with the use of microarray techniques are expected to accelerate the rates of Sicd2 gene discovery.
Acknowledgments
This work was supported by NIH NS38696 to Paula Elyse Schauwecker. The author wishes to thank Ms. Ariana Lorenzana, Ms. Meghan McCord, and Ms. Margaret Kornacki for technical assistance.
References
- Ben-Ari Y. Limbic seizure and brain damage produced by kainic acid: mechanisms and relevance to human temporal lobe epilepsy. Neuroscience. 1985;14:375–403. doi: 10.1016/0306-4522(85)90299-4. [DOI] [PubMed] [Google Scholar]
- Ben-Ari Y, Cossart R. Kainate, a double agent that generates seizures: two decades of progress. Trends Neurosci. 2000;23:580–587. doi: 10.1016/s0166-2236(00)01659-3. [DOI] [PubMed] [Google Scholar]
- Bennett B, Carosone-Link P, Beeson M, Gordon L, Phares-Zook N, Johnson TE. Genetic dissection of quantitative trait locus for ethanol sensitivity in long- and short-sleep mice. Genes Brain Behav. 2008;7:659–668. doi: 10.1111/j.1601-183X.2008.00403.x. [DOI] [PubMed] [Google Scholar]
- Berger ML, Lefauconnier JM, Tremblay E, Ben-Ari Y. Limbic seizures induced by systemically applied kainic acid: how much kainic acid reaches the brain? Adv Exp Med Biol. 1986;203:199–209. doi: 10.1007/978-1-4684-7971-3_15. [DOI] [PubMed] [Google Scholar]
- Boscia F, Esposito CL, Di Crisci A, de Franciscis V, Annunziato L, Cerchia L. GDNF selectively induces microglial activation and neuronal survival in CA1/CA3 hippocampal regions exposed to NMDA insult through Ret/ERK signaling. PLoS ONE. 2009;4:e6486. doi: 10.1371/journal.pone.0006486. [DOI] [PMC free article] [PubMed] [Google Scholar]
- Cardon LR, Bell JI. Association study designs for complex diseases. Nat Rev Genet. 2001;2:91–99. doi: 10.1038/35052543. [DOI] [PubMed] [Google Scholar]
- Chiu S, Kim K, Haus KA, Espinal GM, Millon LV, Warden CH. Identification of positional candidate genes for body weight and adiposity in subcongenic mice. Physiol Genomics. 2007;31:75–85. doi: 10.1152/physiolgenomics.00267.2006. [DOI] [PubMed] [Google Scholar]
- Darvasi A. Experimental strategies for the genetic dissection of complex traits in animal models. Nat Genet. 1998;18:19–24. doi: 10.1038/ng0198-19. [DOI] [PubMed] [Google Scholar]
- Darvasi A. Interval-specific congenic strains (ICSC): an experimental design for mapping a QTL into a 1-centimorgan interval. Mamm Genome. 1997;8:163–167. doi: 10.1007/s003359900382. [DOI] [PubMed] [Google Scholar]
- Depienne C, Magnin E, Bouteiller D, Stevanin G, Saint-Martin C, Vidailhet M, Apartis E, Hirsch E, LeGuern E, Labauge P, Rumbach L. Familial cortical myoclonic tremor with epilepsy: The third locus (FCMTE3) maps to 5p. Neurology. 2010;74:2000–2003. doi: 10.1212/WNL.0b013e3181e396a8. [DOI] [PubMed] [Google Scholar]
- Ferraro TN, Golden GT, Smith GG, Martin JF, Lohoff FW, Gieringer TA, Zamboni D, Schwebel CL, Press DM, Kratzer SO, Zhao H, Berrettini WH, Buono RJ. Fine mapping of a seizure susceptibility locus on mouse chromosome 1: nomination of Kcnj10 as a causative gene. Mamm Genome. 2004;15:239–251. doi: 10.1007/s00335-003-2270-3. [DOI] [PubMed] [Google Scholar]
- Ferraro TN, Golden GT, Smith GG, Berrettini WH. Differential vulnerability to seizures induced by systemic kainic acid treatment in mature DBA/2J and C57BL/6J mice. Epilepsia. 1995;36:301–307. doi: 10.1111/j.1528-1157.1995.tb00999.x. [DOI] [PubMed] [Google Scholar]
- Fisher RS. Animal models of the epilepsies. Brain Res Rev. 1989;14:245–278. doi: 10.1016/0165-0173(89)90003-9. [DOI] [PubMed] [Google Scholar]
- Franklin KBJ, Paxinos G. The Mouse Brain in Stereotaxic Coordinates. Academic Press; New York: 1997. [Google Scholar]
- Fujikawa DG. Neuroprotective effect of ketamine administered after status epilepticus onset. Epilepsia. 1995;36:186–195. doi: 10.1111/j.1528-1157.1995.tb00979.x. [DOI] [PubMed] [Google Scholar]
- Fujikawa DG. The temporal evolution of neuronal damage from pilocarpine-induced status epilepticus. Brain Res. 1996;725:11–22. doi: 10.1016/0006-8993(96)00203-x. [DOI] [PubMed] [Google Scholar]
- Fujikawa DG, Daniels AH, Kim JS. The competitive NMDA receptor antagonist CGP 40116 protects against status epilepticus-induced neuronal damage. Epilepsy Res. 1994;17:207–219. doi: 10.1016/0920-1211(94)90051-5. [DOI] [PubMed] [Google Scholar]
- Galanopoulou A, Vidaurre J, Moshe SL. Under what circumstances can seizures produce hippocampal injury: evidence for age-specific effects. Dev Neurosci. 2002;24:355–363. doi: 10.1159/000069047. [DOI] [PubMed] [Google Scholar]
- Holmes GL. Seizure-induced neuronal injury: animal data. Neurology. 2002;59:S3–S6. doi: 10.1212/wnl.59.9_suppl_5.s3. [DOI] [PubMed] [Google Scholar]
- Humpel C, Hoffer B, Strömberg I, Bektesh S, Collins F, Olson L. Neurons of the hippocampal formation express glial cell line-derived neurotrophic factor messenger RNA in response to kainite-induced excitation. Neuroscience. 1994;59:791–795. doi: 10.1016/0306-4522(94)90284-4. [DOI] [PubMed] [Google Scholar]
- Jankowsky JL, Derrick BE, Patterson PH. Cytokine response to LTP induction in the rat hippocampus: a comparison of in vitro and in vivo techniques. Learn Mem. 2000;7:400–412. doi: 10.1101/lm.32600. [DOI] [PMC free article] [PubMed] [Google Scholar]
- Jen JC, Wan J, Palos TP, Howard BD, Baloh RW. Mutation in the glutamate transporter EAAT1 causes episodic ataxia, hemiplegia, and seizures. Neurology. 2005;65:529–534. doi: 10.1212/01.wnl.0000172638.58172.5a. [DOI] [PubMed] [Google Scholar]
- Lehtimäki KA, Peltola J, Koskikallio E, Keränen T, Honkaniemi J. Expression of cytokines and cytokine receptors in the rat brain after kainic acid-induced seizures. Mol Brain Res. 2003;110:253–260. doi: 10.1016/s0169-328x(02)00654-x. [DOI] [PubMed] [Google Scholar]
- Leite JP, Garcia-Cairsaco N, Cavalheiro EA. New insights from the use of pilocarpine and kainate models. Epilepsy Res. 2002;50:93–103. doi: 10.1016/s0920-1211(02)00072-4. [DOI] [PubMed] [Google Scholar]
- Lin LF, Doherty DH, Lile JD, Bektesh S, Collins F. GDNF: a glial cell line-derived neurotrophic factor for midbrain dopaminergic neurons. Science. 1993;260:1130–1132. doi: 10.1126/science.8493557. [DOI] [PubMed] [Google Scholar]
- Lorenzana A, Chancer Z, Schauwecker PE. A quantitative trait locus on chromosome 18 is a critical determinant of excitotoxic cell death susceptibility. Eur J Neurosci. 2007;25:1998–2008. doi: 10.1111/j.1460-9568.2007.05443.x. [DOI] [PubMed] [Google Scholar]
- Ma Y, Miller JC, Crandall H, Larsen ET, Dunn DM, Weiss RB, Subramanian M, Weis JH, Zachary JF, Teuscher C, Weis JJ. Interval-specific congenic lines reveal quantitative trait loci with penetrant lyme arthritis phenotypes on chromosomes 5, 11, and 12. Infect Immun. 2009;77:3302–3311. doi: 10.1128/IAI.00396-09. [DOI] [PMC free article] [PubMed] [Google Scholar]
- Mackay TFC. The genetic architecture of quantitative traits. Annu Rev Genet. 2001;35:303–339. doi: 10.1146/annurev.genet.35.102401.090633. [DOI] [PubMed] [Google Scholar]
- Maeda S, Kawamoto A, Yatani Y, Shirakawa H, Nakagawa T, Kaneko S. Gene transfer of GLT-1, a glial glutamate transporter, into the spinal cord by recombinant adenovirus attenuates inflammatory and neuropathic pain in rats. Mol Pain. 2008;4:65. doi: 10.1186/1744-8069-4-65. [DOI] [PMC free article] [PubMed] [Google Scholar]
- McKhann GM, Wenzel HJ, Robbins CA, Sosunov AA, Schwartzkroin PA. Mouse strain differences in kainic acid sensitivity, seizure behavior, mortality, and hippocampal pathology. Neuroscience. 2003;122:551–561. doi: 10.1016/s0306-4522(03)00562-1. [DOI] [PubMed] [Google Scholar]
- McLin JP, Steward O. Comparison of seizure phenotype and neurodegeneration induced by systemic kainic acid in inbred, outbred, and hybrid mouse strains. Eur J Neurosci. 2006;24:2191–202. doi: 10.1111/j.1460-9568.2006.05111.x. [DOI] [PubMed] [Google Scholar]
- Miller SA, Dykes DD, Polesky HF. A simple salting out procedure for extracting DNA from human nucleated cells. Nucl Acids Res. 1988;16:1215. doi: 10.1093/nar/16.3.1215. [DOI] [PMC free article] [PubMed] [Google Scholar]
- Morrison RS, Wenzel HJ, Kinoshita Y, Robbins CA, Donehower A, Schwartzkroin PA. Loss of the p53 tumor suppressor gene protects neurons from kainate-induced cell death. J Neurosci. 1996;16:1337–1345. doi: 10.1523/JNEUROSCI.16-04-01337.1996. [DOI] [PMC free article] [PubMed] [Google Scholar]
- Nadeau JH, Singer JB, Matin A, Lander ES. Analyzing complex genetic traits with chromosome substitution strains. Nat Genet. 2000;24:221–225. doi: 10.1038/73427. [DOI] [PubMed] [Google Scholar]
- Nadler JV, Evenson DA. Use of excitatory amino acids to make axon-sparing lesions of hypothalamus. Meth Enzymol. 1983;103:393–400. doi: 10.1016/s0076-6879(83)03027-x. [DOI] [PubMed] [Google Scholar]
- Olney JW. Excitatory amino acids and neuropsychiatric disorders. Boil Psychiat. 1989;26:505–525. doi: 10.1016/0006-3223(89)90072-3. [DOI] [PubMed] [Google Scholar]
- Olney JW, Collins RC, Sloviter RS. Excitotoxic mechanisms of epileptic brain damage. Adv Neurol. 1986;44:857–877. [PubMed] [Google Scholar]
- Racine RJ. Modification of seizure activity electrical stimulation. II. Motor seizure. Electroencephalogr Clin Neurophysiol. 1972;32:281–294. doi: 10.1016/0013-4694(72)90177-0. [DOI] [PubMed] [Google Scholar]
- Santos JB, Schauwecker PE. Protection provided by cyclosporin A against excitotoxic neuronal death is genotype dependent. Epilepsia. 2003;44:995–1002. doi: 10.1046/j.1528-1157.2003.66302.x. [DOI] [PubMed] [Google Scholar]
- Schauwecker PE, Steward O. Genetic determinants of susceptibility to excitotoxic cell death: implications for gene targeting approaches. Proc Natl Acad Sci USA. 1997;94:4103–4108. doi: 10.1073/pnas.94.8.4103. [DOI] [PMC free article] [PubMed] [Google Scholar]
- Schauwecker PE, Williams RW, Santos JB. Genetic control of sensitivity to hippocampal cell death induced by kainic acid: a quantitative trait loci analysis. J Comp Neurol. 2004;477:96–107. doi: 10.1002/cne.20245. [DOI] [PubMed] [Google Scholar]
- Scherneck S, Nestler M, Vogel H, Blüher M, Block MD, Berriel Diaz M, Herzig S, Schulz N, Teichert M, Tischer S, Al-Hasani H, Kluge R, Schürmann A, Joost HG. Positional cloning of zinc finger domain transcription factor Zfp69, a candidate gene for obesity-associated diabetes contributes by mouse locus Nidd/SJL. PLoS Genet. 2009;5:e1000541. doi: 10.1371/journal.pgen.1000541. [DOI] [PMC free article] [PubMed] [Google Scholar]
- Schmued LC, Stowers CC, Scallet AC, Xu L. Fluoro-Jde C results in ultra high resolution and contrast labeling of degenerating neurons. Brain Res. 2005;1035:24–31. doi: 10.1016/j.brainres.2004.11.054. [DOI] [PubMed] [Google Scholar]
- Sidman RL, Angevine JB, Taber Pierce E. Atlas of the Mouse Brain and Spinal Cord. Harvard University Press; Cambridge, MA: 1971. [Google Scholar]
- Sperk G. Kainic acid seizures in the rat. Prog Neurobiol. 1994;42:1–32. doi: 10.1016/0301-0082(94)90019-1. [DOI] [PubMed] [Google Scholar]
- Sperk G, Lassmann H, Baran H, Kish SJ, Seitelberger F, Hornykiewicz O. Kainic acid induced seizures: neurochemical and histopathological changes. Neuroscience. 1983;10:1301–1315. doi: 10.1016/0306-4522(83)90113-6. [DOI] [PubMed] [Google Scholar]
- Springer JE, Mu X, Bergmann LW, Trojanowski JQ. Expression of GDNF mRNA in rat and human nervous tissue. Exp Neurol. 1994;127:167–170. doi: 10.1006/exnr.1994.1091. [DOI] [PubMed] [Google Scholar]
- Sucholmelova L, Baldwin RA, Kuvoba H, Thompson KW, Sankar R, Wasterlain CG. Treatment of experimental status epilepticus in immature rats: dissociation between anticonvulsant and antiepileptogenic effects. Pediatr Res. 2006;59:237–243. doi: 10.1203/01.pdr.0000196333.16608.30. [DOI] [PubMed] [Google Scholar]
- Turski L, Cavalheiro EA, Czuczwar SJ, Turski WA, Kleinrok Z. The seizures induced by pilocarpine: behavioral, electroencephalographic and neuropathological studies in rodents. Pol J Pharmacol Pharm. 1987;39:545–555. [PubMed] [Google Scholar]
- Wakeland E, Morel L, Achey K, Yui M, Longmate J. Speed congenics: a classic technique in the fast lane (relatively speaking) Immunol Today. 1997;18:472–477. doi: 10.1016/s0167-5699(97)01126-2. [DOI] [PubMed] [Google Scholar]
- Wenzel HJ, Woolley CS, Robbins CA, Schwartzkroin PA. Kainic acid-induced mossy fiber sprouting and synapse formation in the dentate gyrus of rats. Hippocampus. 2000;10:244–260. doi: 10.1002/1098-1063(2000)10:3<244::AID-HIPO5>3.0.CO;2-7. [DOI] [PubMed] [Google Scholar]
- West MJ, Slomianka L, Gundersen HJ. Unbiased stereological estimation of the total number of neurons in the subdivisions of the rat hippocampus using the optical fractionator. Anat Rec. 1991;231:482–497. doi: 10.1002/ar.1092310411. [DOI] [PubMed] [Google Scholar]