Abstract
A femtosecond CARS-based nonlinear optical microscope was used to simultaneously image extracellular structural proteins and lipid-rich structures within intact aortic tissue obtained from myocardial infarction-prone Watanabe heritable hyperlipidemic rabbits (WHHLMI). Clear differences in the NLO microscopic images were observed between healthy arterial tissue and regions dominated by atherosclerotic lesions. In the current ex-vivo study, we present a single parameter based on intensity changes derived from multi-channel NLO image to classify plaque burden within the vessel. Using this parameter we were able to differentiate between healthy regions of the vessel and regions with plaque, as well as distinguish plaques relative to the age of the WHHLMI rabbit.
OCIS codes: (170.3880) Medical and biological imaging; (170.4580) Optical diagnostics for medicine; (180.4315) Nonlinear microscopy; (300.6230) Spectroscopy, coherent anti-Stokes Raman scattering
1. Introduction
Atherosclerosis is a chronic progressive disease associated with plaque accumulation in the coronary, carotid and peripheral arteries [1–3]. Plaque development once considered to be a passive accumulation of lipids and cellular debris is now recognized as part of a complex process. Structurally, early disease manifests through a focal thickening of the endothelium and the formation of localized fatty streaks beneath the endothelium. Fatty streaks can progress to advanced lesions where lipid-laden cells and extracellular lipid droplets form a lipid rich necrotic core capped by vascular smooth muscle cells and a collagen-rich fibrous network [1,2]. Rupture or erosion of the fibrous cap results in the ejection of the lipid core into the vessel resulting in a clot or thrombosis that impedes blood flow in the artery. Imaging techniques are relied upon to detect blockages and localize plaques.
X-ray fluorescence angiography remains an important imaging modality for detecting and localizing stenotic lesions in patients [4]. However, 2D x-ray angiography cannot detect non-stenotic lesions making it of little value in quantifying plaque burden or as a tool for understanding plaque development. The ability of multi-detector computed tomography (MDCT) to detect calcified plaque is well established and preliminary studies suggest that MDCT may be able to distinguish between fat and fibrous as well as calcified tissue based on CT density values [5]. Coronary magnetic resonance imaging was also reported in classification and quantification of plaque burden, yet its relatively low resolution limits its clinical use [6]. Differentiation of plaque type and assessment of plaque burden, in-vivo, so far largely relies on the use of intravascular ultrasound (IVUS). Although IVUS allows visualization, in-vivo, of the geometry of the artery and atherosclerotic lesions [7–9], according to histopathological studies it suffers from low specificity and low sensitivity in detecting early lesions and lipid-rich lesions. Despite these short-comings IVUS has contributed significantly to our understanding of plaque development. Recently optical coherence tomography (OCT) and Raman spectroscopy were also reported to be useful in detecting and characterizing atherosclerotic lesions. Intravascular OCT shows particular promise and several research groups have demonstrated its potential [10–13] by characterizing plaque morphology at much higher resolution (~10 µm) than IVUS. Raman spectroscopy is ideal for identifying gross biochemical changes in tissue and has great potential to discriminate between lipid-rich, calcified and fibrotic plaques [14–18]. It is however a slower technique limited by lower sensitivity. The recent trends in MDCT, IVUS and OCT to develop methods to differentiate tissue types underlines that both morphological and compositional information are crucial for understanding plaque development, plaque burden and predicting the risk of plaque rupture or erosion. Despite these advances in imaging, differentiation of types of plaque and assessment of plaque burden can only be verified by histological examination that conveys compositional information in a structural context.
As key structural protein constituents of the extracellular matrix, elastin and collagen are the dominant biomolecules associated with atherosclerotic disease progression. Similarly, modified cholesterols as the primary lipid species triggering plaque development are inextricably linked to the disease. Developing a practical method capable of interrogating these extracellular bio-molecules that are so closely linked to the disease is of great interest to many. Recently nonlinear optical (NLO) microscopic imaging has emerged as a powerful tool for label-free tissue imaging [19]. It is fast, biochemically specific and possess intrinsic 3-D resolution better than confocal microscopy. Two-photon excited fluorescence (TPEF), second-harmonic generation (SHG) and coherent anti-Stokes Raman scattering (CARS) have been intensively studied in imaging extracellular elastin, type-I collagen fibrils and lipid-rich molecules in bulk tissue without preparation or the use of dyes or stains [20–28]. Such label-free imaging capability renders NLO imaging well suited to understanding the role and interplay between these biochemical species in plaque development. In fact, TPEF and SHG have been used to study arterial tissue structures and atherosclerotic lesions previously [29–31]. First label-free NLO imaging of atherosclerotic lesions using three NLO modalities (TPEF, SHG and CARS) was reported recently by Le et al using a multimodal CARS microscope and an Ossabaw swine animal model of metabolic syndrome-induced arterial disease [32]. In this study they visualized CARS signals using two tightly synchronized pico-second laser beams and another femto-second Ti:sapphire laser for generating TPEF and SHG signals. Based on a similar optical setup and animal model, Wang et al. [33] also demonstrated quantitative measurements of collagen and lipids contents in atherosclerotic lesions on thin histological sections using a multimodal NLO microscope. Previously we have also demonstrated label-free atherosclerotic tissue imaging using a femtosecond CARS-based multimodal NLO microscope developed earlier [34] and myocardial infarction-prone Watanabe heritable hyperlipidemic (WHHLMI) rabbit strain [35]. The current study develops a quantitative metric based on the NLO images obtained from arterial tissue of WHHLMI rabbits and explores how this metric could be used to study the mechanisms of plaque development and quantify plaque burden. All measurements are performed on intact bulk tissue using backscattering detection (or Epi-) mode for its practicality for in vivo measurements. Endoscopic TPEF/SHG based on 2-D raster scanning and radial scanning were both reported in the literature [36,37]. Although endoscopic CARS has not been realized thus far due to challenges in dual laser-pulse delivery in the same optical fiber, progress in this direction was reported recently [38]. Thus, it is believed that with the fast advancement of new laser sources and nonlinear optical fiber, endoscopic multi-modal CARS could become a reality in the not too distant future. In this ex-vivo study we define an intensity based summary parameter from multimodal NLO images which correlates with atherosclerotic plaque burden in the WHHLMI rabbit model. This parameter also shows a marked dependence on the age of the animal. This dependence is consistent with the expected temporal pattern of plaque accumulation within the aorta of these rabbits.
Multimodal NLO imaging is capable of rapidly surveying bulk arterial tissue and can display information with respect to key biochemical components and structures that portend advanced atherosclerosis in the WHHLMI model. Along with this visual representation through TPEF, SHG and CARS images, simple intensity based parameters summarizing the images can be devised that correlate with disease burden and could be used to further quantify disease progression. Given the differences between human disease and the plaques developed by the WHHLMI model, this index is unlikely to be a good predictor of human plaque pathology. However, the work demonstrates the possibility of developing similar indices predictive of human plaque composition and morphology from NLO imaging of human vessels.
2. Experimental
2.1. Animal model and tissue preparation
This study was approved by the local animal care committee at Institute for Biodiagnostics, National Research Council Canada. In this study, myocardial infarction prone Watanabe heritable hyperlipidemic rabbits, designated as WHHLMI rabbits [39,40], were used as an animal model to mimic spontaneous myocardial infarction in humans. Due to a hereditary defect in LDL processing, WHHLMI rabbits develop atherosclerotic plaques without requiring a modified diet. Four WHHLMI rabbits 4, 16, 17 and 24 months old, respectively, representing various stages of atherosclerotic disease progression were studied with the 24 months-old rabbit being considered to be nearing the end of its life cycle.
The three older rabbits used in the study were born and raised in the Institute for Experimental Animals, Kobe University, School of Medicine (Kobe, Japan) until they were at almost 12 months of age. These rabbits were later transported from Kobe University (Kobe, Japan) to the Institute for Biodiagnostics, National Research Council Canada (NRC-IBD). The younger rabbit used in the study was born at NRC-IBD.
The aorta was dissected from the ascending aorta to the external iliac artery and then rinsed in heparinized saline. The exterior aorta was delicately cleaned of connective tissue prior to being subdivided into ~20-30 mm sections resulting in 5-7 pieces. Additionally, some short segments were set aside for histology at this point. Each section was cut open longitudinally exposing the luminal surface. The samples were placed in petri-dishes with the luminal surface facing up on a moist surface and hydration was maintained throughout the measurements by periodically applying phosphate buffered saline (PBS) solution to the tissue. Digital photos of the luminal surface were acquired and regions of interest were identified prior to measurements.
For histology, the artery was cross-sectioned on a cryotome into sections 8µm in thickness while embedded in OCT (optical cutting temperature) cutting medium. Adjacent artery sections were used in multimodal CARS imaging, H&E (hematoxylin and eosin) staining to reveal general tissue morphology, picro-sirius red staining for highlighting collagen, and oil red O staining for accenting lipid content. The tissue sections prepared for CARS imaging received no further treatment after cutting while those prepared for histology were immersion-fixed in either 95% ethanol or 10% buffered formalin based on individual staining protocols. In visualizing collagen, cross-handed circularly-polarized microscopy was employed to provide higher contrast [41]. Histology images were obtained using a 10x air objective lens on a Zeiss Axio Observer Z1 system equipped with AxioCam ICc3 CCD camera (Carl Zeiss Canada, Toronto, ON, Canada).
2.2. Femtosecond CARS-based multimodal NLO microscopic imaging
A home-built multimodal nonlinear optical (NLO) laser scanning microscope illustrated in Fig. 1 was used for TPEF, SHG and CARS imaging of arterial tissues and was described previously [35]. The light source for TPEF and SHG imaging was a Ti:Sapphire oscillator (Tsunami, Spectra-Physics) centered at 800 nm with a 100 fs pulse duration and a 20 nm bandwidth. Average output power was measured at 1W when the oscillator was pumped with a 7.25 W green laser at 532 nm (Millennium Pro, Spectra-Physics). A Faraday isolator (Newport) was placed close to the emission exit of the Ti:Sapphire oscillator to prevent any back reflections of the femto-second pulses from re-entering the laser cavity. Re-compression of the pulses was accomplished using a pair of GTI laser mirrors (Layertec GmbH, Germany) in compensation for the large positive group velocity dispersion (GVD) introduced by Faraday isolator and other microscope optics.
Fig. 1.
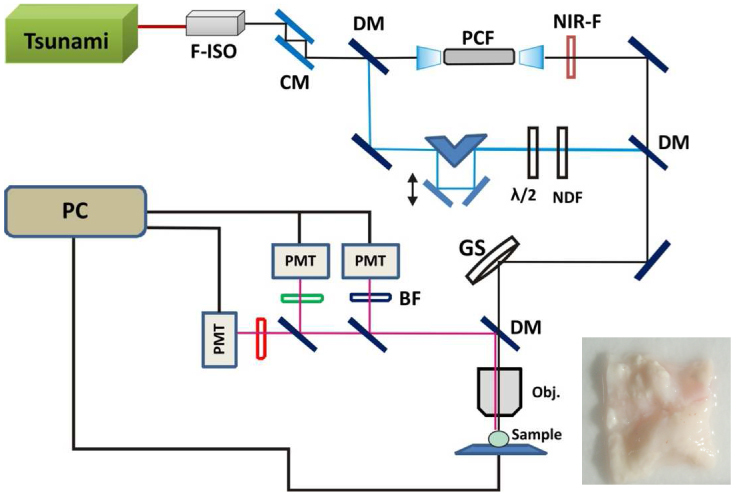
Schematic of the home-built multimodal nonlinear optical laser scanning microscope. Light source for TPEF and SHG imaging is a Ti:Sapphire femto-second oscillator (Tsunami,Spectra-Physics). For CARS imaging, Stokes pulses are generated in PCF which is pumped by the same Ti:sapphire laser. Inset shows a typical video image of a tissue sample with lumen surface facing up. F-ISO: Faraday isolator; CM: chirp laser mirrors; BS: beam splitter; NIR-F: near-IR filter;; GS: galvo scanner; DM: dichroic mirror; OBJ: objective lens; BF: bandpass filter; NDF: neutral density filter; λ/2: half waveplate.
The femto-second pulse was then split into two beams using a 50:50 beam splitter. The reflected pulses were used as the pump beam for CARS imaging and also as the light source for TPEF and SHG imaging. Approximately 300mW transmitted pulse after the beam splitter was coupled into a PCF (NL-1.4.775-945, NKT Photonics A/S, Denmark) through a 20x objective lens (Newport) generating a broadband emission both in the visible and in the near infrared (NIR). The NIR portion (>900nm) of this broadband emission was used as the Stokes beam for CARS imaging. The pump and Stokes pulses were combined at a beam combiner before proceeding into the laser scanning microscope assembly. A 20x, 0.75 NA infinity corrected air objective lens (Olympus Canada, Markham, ON, Canada) focused the laser pulses on samples and also collected the epi-TPEF/SHG/CARS signals. The collected NLO signals were transmitted to three non-descanned PMT detectors (H9656 series, Hamamatsu, Bridgewater, NJ, USA) mounted on the microscope assembly for simultaneous TPEF, SHG and CARS imaging at 530 ± 20nm, 400 ± 30nm and 630 ± 30nm, respectively. Typically 25mW of pump and 8mW of Stokes (measured after the 20x air objective lens) were used for imaging.
ScanImage (ver. 3.5) software [42] was used for image acquisition and laser scanning control. Pixel dwell time for an average of 4 scans for a single collection was 21 µs. Post image viewing and 3 channels separation were performed in ImageJ ver 1.42b. Image background correction, intensity normalization and calculation of various image parameters were carried out using Matlab.
3. Results and discussion
3.1. Validating multimodal CARS imaging with histology
Three different types of histological stains were compared with the multimodal CARS image of an adjacent unstained artery section in Fig. 2 . Figure 2A, 2B and 2C illustrate H&E (bright field), picro-sirius red (circularly polarized light) and oil red O (bright field) stains of adjacent artery sections, respectively, to help visualize general tissue morphology and particular extra-cellular components. Three major biochemical components relevant to atherosclerotic plaque development, extra-cellular elastin in tunica media, collagen fibrils in tunica adventitia, on intima-media boundary and forming the cap on the atherosclerotic plaque as well as lipids in plaque bodies are all correctly visualized in a multimodal CARS image with elastin fiber color-coded in green (TPEF), collagen fibrils in blue (SHG) and lipids in red (CARS) (shown in Fig. 2D). The correspondence between the histological sections and the multimodal CARS images validates our understanding of what gives rise to contrast in the multimodal CARS image. This validation ensures accurate interpretation of multimodal CARS imaging in presenting the biochemical composition of atherosclerotic lesions.
Fig. 2.
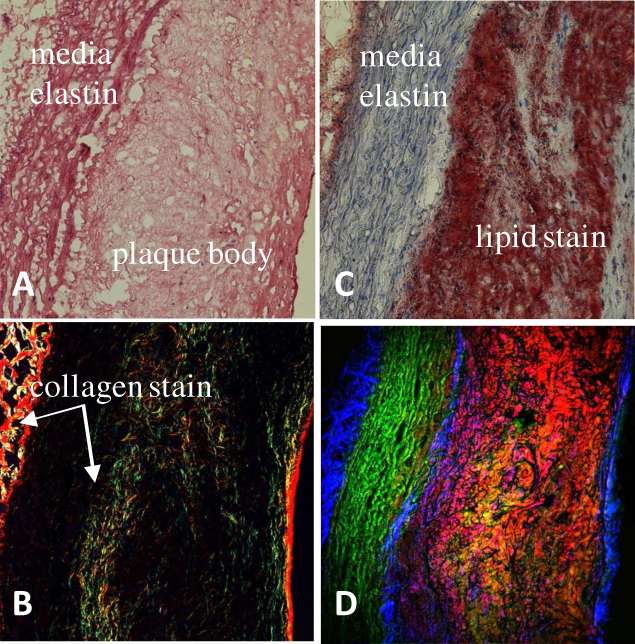
Comparison of (A) H&E (B) picro-sirius red (C) oil red O histological stain with (D) label-free multimodal CARS image of adjacent artery cross-sections. Color-codes shown in (D): green is TPEF representing mainly elastin, blue is SHG representing mainly collagen fibrils and red is CARS representing mainly lipids content. Both SHG and CARS signals are collected in the forward-direction while TPEF is collected in the backscattered (epi-) direction.
3.2. Scoring and image evaluation
Collagen fibril scoring was previously developed using parameters extracted from collagen SHG images, according to Strupler et al. [43]. In that work the authors used three phenomenological scores, D, S, and SF to quantify the distribution and morphology of collagen fibrils in unlabeled fibrotic murine kidney tissue sections using SHG images, where D (density) is the volume density of pixels exhibiting a significant SHG signal; S (signal) is the average value of the SHG signal in a corrected SHG image and SF (signal in fibers) is the ratio of the other two scores: SF = S/D representing average SHG signal intensity in regions exhibiting significant SHG signals.
This method worked well in scoring collagen in sectioned kidney tissue but may prove challenging in classifying complex biological structures such as atherosclerotic lesions using multi-dimensional information (SHG for collagen, TPEF for elastin and other fluorescent particles and CARS for lipid-rich structure) derived from a bulk tissue due to pathological interplay of extracellular components in an atherosclerotic lesion. In order to address the complexity and the dynamic nature of atherosclerotic disease progression, we developed a new parameter that can accurately track plaque burden in the vessel using biochemical data collected through combined elastin, collagen and lipid imaging.
Following the approach proposed by Strupler et al for analyzing fiber score in SHG images, three SF scores were extracted from individual SHG, CARS and TPEF, but co-registered, images of the same sample. Parameters D and S were calculated for all TPEF, SHG and CARS images using definitions given by Stupler et al. [43]. Note that Strupler et al define S/D as a signal in fibres score (SF), but in this study we are using a more generic term, called significant signal score (SS), since not all three imaging channels (SHG, CARS and TPEF), represent biomolecules that have fibrous structures. A significant signal score (SS) was calculated for each image using the equation SS = S/D.
Each individual image (SHG, CARS or TPEF) was first corrected for PMT dark signals and for the PMT amplification level used in different channels by normalizing the whole image to a pre-determined PMT amplification curve. Three SS scores (SSSHG, SSCARS and SSTPEF) were calculated using the corrected SHG, CARS and TPEF images collected over the same sampling location.
3.3. Significant signal score (SS) – correlation with rabbits’ age
In order to calculate the significant signal score (SS), multimodal epi-NLO images were acquired from smooth/healthy luminal surface and atherosclerotic plaques of four WHHLMI rabbits of different ages, 4, 16, 18, and 24 months-old, respectively.
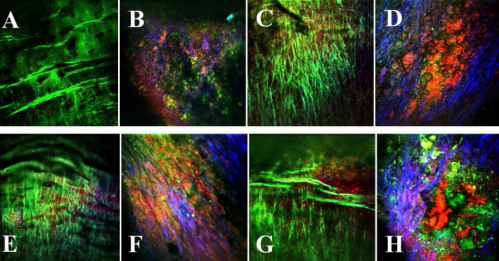
In Fig. 3 some examples of how those regions looks under our multimodal NLO microscope. Figure 3A was acquired at a healthy region of the arterial lumen of a 4 months-old rabbit, while Figs. 3C, 3E and 3G were acquired from healthy lumen of the 16, 18, and 24 months-old rabbits, respectively. The images in Fig. 3B, 3D, 3F, and 3H were acquired from atherosclerotic plaques found in rabbits of 16, 18, and 24 months-old, respectively. The co-localized TPEF/CARS/SHG images acquired by three separate detection channels of the microscope are represented by different colors where TPEF signal is presented in green, CARS signal is presented in red and SHG signal is presented in blue.
Fig. 3.
Representative multimodal epi-NLO image acquired from smooth/healthy luminal surface of the WHHLMI rabbit artery, that is (A) 4 months-old, (C) 16 months-old, (E) 18 months-old, (G) 24 months-old, and atherosclerotic plaques found on the WHHLMI rabbit arteries at (B) 4 months-old, (D) 16 months-old, (F) 18 months-old, and (H) 24 months-old. (20x air objective lens, 0.75 NA).
In a representative NLO image of a healthy lumen, Fig. 3A, only the luminal elastic lamina is clearly visible from the TPEF signal and neither lipid-rich structures nor collagen fibrils in the CARS and SHG signals are evident. On the contrary, Fig. 3H, a representative NLO image from the surface of an advanced arterial plaque, shows abundant lipid-rich structures (CARS in red), collagen fibrils (SHG in blue) along with strongly fluorescent (TPEF in green) macromolecules differing in structure from the luminal elastic lamina that dominate the images of healthy vessels illustrated in Fig. 3A. The enhanced SHG intensity arising from collagen fibrils and the CARS intensity arising from lipid-rich structures, from regions of plaque (see Fig. 3B, 3D, 3F and 3H) are consistent with known plaque pathology and explain the increased SSSHG and SSCARS scores from regions of plaque; however, the SSTPEF score shows no obvious difference between regions of plaque and healthy vessel. The diminishing elastin content at the region of plaque is compensated for by an increasing number of other fluorescent macromolecules detected by TPEF.
In order to better illustrate the change in SS scores with respect to plaque progression represented by the age of the rabbit, the mean SS scores obtained from the images of four rabbits (4, 16, 18, and 24 months-old) are presented in Fig. 4 .
Fig. 4.
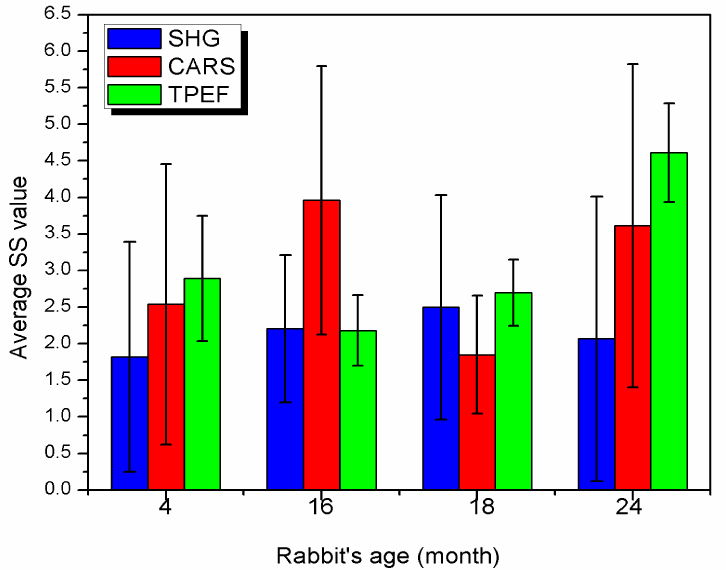
Comparison of the SS scores extracted from SHG, CARS and TPEF images acquired from the arterial lumen of four WHHLMI rabbits: 4 months-old, 16 months-old, 18 months-old and 24 months-old.
The mean SS scores and their standard deviations were obtained by averaging over all SS scores extracted from all of the measurement locations including healthy and atherosclerotic luminal surfaces, along the same artery of the same animal. A total of 31, 29, 38 and 40 different locations were measured for the 4 months-old, 16 months-old, 18 months-old, and 24 months-old rabbit, respectively, resulting in approximately 800 processed images.
According to the data presented in Fig. 4, it is clear that it is not possible to differentiate atherosclerotic plaque burden using any of the SS scores as there is no evident correlation. In principle when atherosclerotic plaques become worse, it should lead to an increase of SHG and CARS signals as both collagen and lipids content increase; however, SSSHG and SSCARS scores are not increasing proportional to plaque development: the SSSHG score for the youngest rabbit (4 months-old) is 1.8 ± 2.6 and for the oldest one (24 months-old) it is 2.1 ± 3.0 Considering the spread of the scores as evident from the standard deviations of both values, it can be concluded that these values are not statistically significant different, therefore SS scores alone is not a good parameter to use to differentiate plaque burden.
3.4. Optical index for plaque burden (OIPB)
As discussed in previous sections, the mean SS scores generally are well correlated in scoring collagen in sectioned kidney tissue, but they are not reliable indicators for distinguishing atherosclerotic plaques. For instance, some NLO images taken from advanced plaques are abundant in lipid-rich structures but show no collagen fibrils (e.g. lipid-rich type-IV atheroma). Others show a high density of collagen fibrils along with abundant lipid (e.g. collagenous type-Va fibrous atheroma). Although both lesion types are considered advanced, the lower SSSHG score derived from a type IV atheroma might underestimate disease severity. We propose a new optical index for plaque burden, or OIPB index.
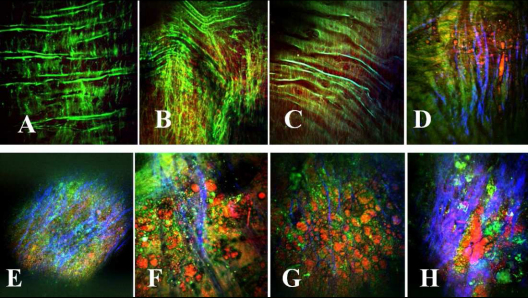
Considering the images presented in Fig. 5 , which are organized based on the level of plaque burden, it is possible for us to define some patterns of changes in all three NLO signal channels. Figure 5A–5C show examples of healthy arterial lumen; Fig. 5D shows an atherosclerotic lesion found in a young rabbit artery; Fig. 5E is an atherosclerotic plaque, where it is possible to note some collagen fibers formation (shown blue); Fig. 5F is an atherosclerotic plaque with higher lipid (shown red) content; Fig. 5G is an atherosclerotic plaque containing a high density of collagen fibers and lipids, and finally Fig. 5H is a very advanced plaque.
Fig. 5.
Representative multimodal epi-NLO image acquired from the luminal surface of WHHLMI rabbit arteries, with (A) -(C) healthy lumen; (D) early atherosclerotic plaque found in young rabbit; (E) atherosclerotic plaque (with dense collagen fibers shown blue); (F) atherosclerotic plaque with higher lipid content shown red; (G) atherosclerotic plaque containing collagen fibers and lipids, and (H) very advanced plaque (20x air objective lens, 0.75 NA).
The three average SS values for each image shown in Fig. 5 are calculated and then presented in Fig. 6 where the SSSHG and SSCARS scores are associated with collagen and lipids (both are associated with plaque regions), respectively, and SSTPEF scores can be associated with elastin in healthy tissue or with other fluorescent macromolecules in the region of plaque.
Fig. 6.
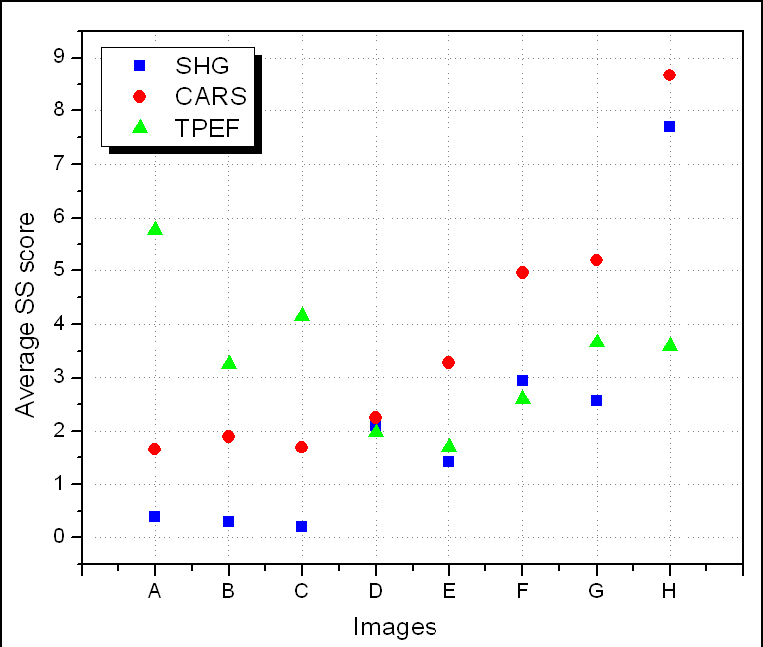
Average SS scores extracted from SHG (blue squares), CARS (red circles) and TPEF (green triangles) images acquired from the arterial lumen of WHHLMI rabbits. Images A-H correspond to those shown in Fig. 5
From Fig. 6, we clearly observe a pattern for each of the SS scores, which can be summarized as follows. The healthier the tissue is, the lower the SSSHG and the SSCARS but the higher the SSTPEF. The opposite is true if the tissue has an increased burden of plaque. In addition, we can also observe a correlation between the differences between the three SS scores based on the health of the tissue. For instance, the healthier the tissue is, as the greater the difference between SSSHG and SSTPEF, with SSTPEF being higher than SSSHG; and also the greater the difference between SSCARS and SSTPEF, with SSTPEF higher than SSCARS. Based on these observations, an OIPB index can be defined by the equation,
| (1) |
where the terms d(SSX, SSY) are the difference between two SS scores (SHG, CARS and TPEF), d(SSx, SSy) = SSx - SSy. Note that SSTPEF score alone was not included in the calculation of OIPB indices because it provides no additional contrast in discriminating between atherosclerosis lesions from healthy vessel wall as mentioned earlier. A term d(SSCARS, SSSHG) was added in the calculation for its value in discriminating between a lipid-rich type-IV atheroma and a type-V fibrous atheroma. OIPB indices were calculated for all NLO images and were normalized using the same method described earlier.
3.5. OIPB index of the arterial lumen as a function of plaque burden
In order to better illustrate the utility of the OIPB index Fig. 7 plots the mean OIPB index obtained from images of the lumen surface from healthy (OIPBhealthy) and atherosclerotic (OIPBathero) regions for each rabbit presented in the order of the age of the rabbit. In all cases, OIPBathero is significantly higher than OIPBhealthy. The OIPB index from regions of plaque increase in a linear fashion with the age of the WHHLMI rabbit, representing the overall burden of plaque in the aorta.
Fig. 7.
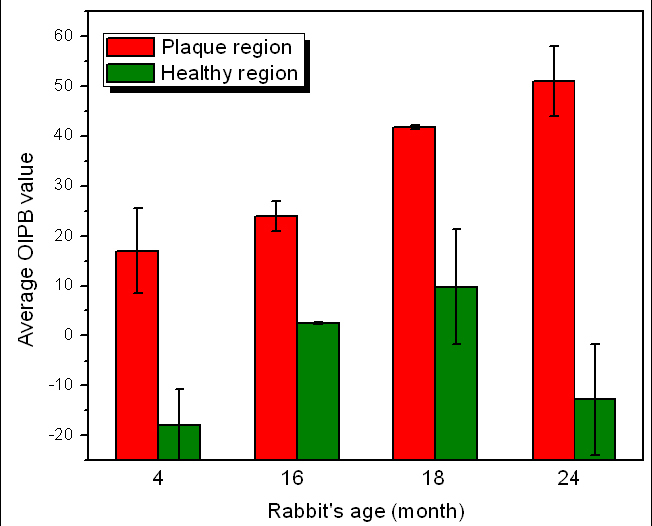
Mean OIPB indexes of healthy and atherosclerotic lumen surfaces as a function of rabbits’ age.
According to previous studies [39,45,46] and the observation in the current study, young WHHLMI rabbits at 4-6 months of age only show lipid streaks on the luminal wall of the aorta while most of the lumen surface remains largely intact. At 15-20 months of age, plaque has accumulated over large areas of the lumen surface of the aorta of the rabbit. Past 20 months, almost the entire rabbit artery is covered with advanced lesions with very limited intact surface. A strong correlation is observed between the OIPB indices and the burden of plaque found in WHHLMI rabbits. Another analysis shows the mean arterial OIPB index for each rabbit pooling all the measurements whether from healthy and plaque dominated regions of the lumen. This age-based mean OIPB index plotted as a function of the age of the rabbit is illustrated in Fig. 8 .
Fig. 8.
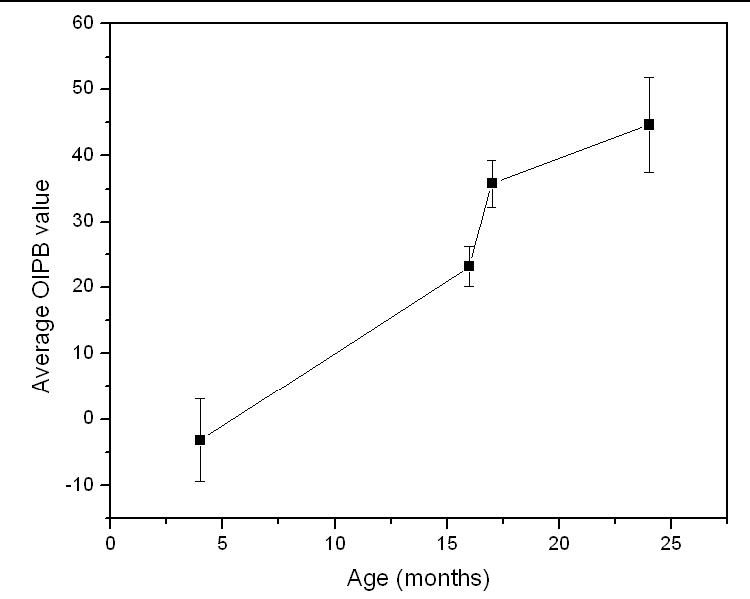
Mean OIPB indexes of all regions of arterial lumen as a function of rabbits’ age.
So far, we demonstrated that the OIPB index is a better discriminatory parameter compared to the SS scores in differentiating plaque burden. This result also illustrates that inter-channel intensity changes detected among TPEF, SHG and CARS correlate with atherosclerotic plaque progression as evident in Fig. 9 which compares the individual OIPB index of Fig. 5A–5H.
Fig. 9.
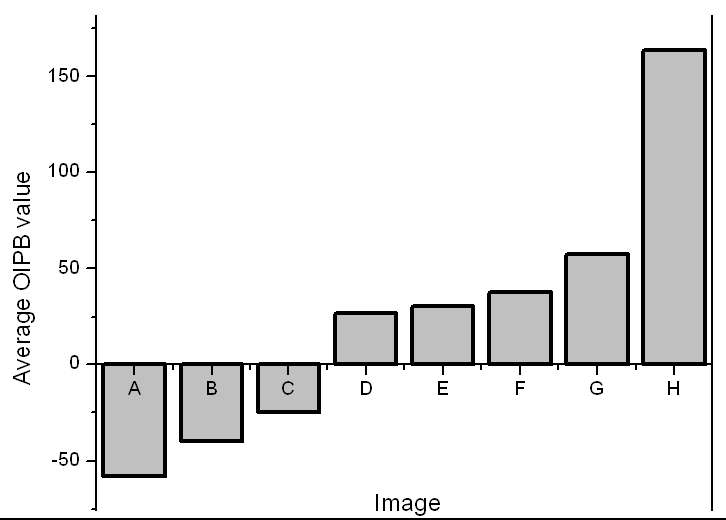
OIPB indices of all images shown in Fig. 5. OIPB index is a better discriminatory parameter in differentiating plaque burden.
To help visualize the correlation between OIPB index, its corresponding NLO image and the age of the animal, NLO images collected from various healthy areas of lumen and atherosclerotic lesions are shown in Fig. 10 along with the respective OIPB index and rabbit’s age.
Fig. 10.
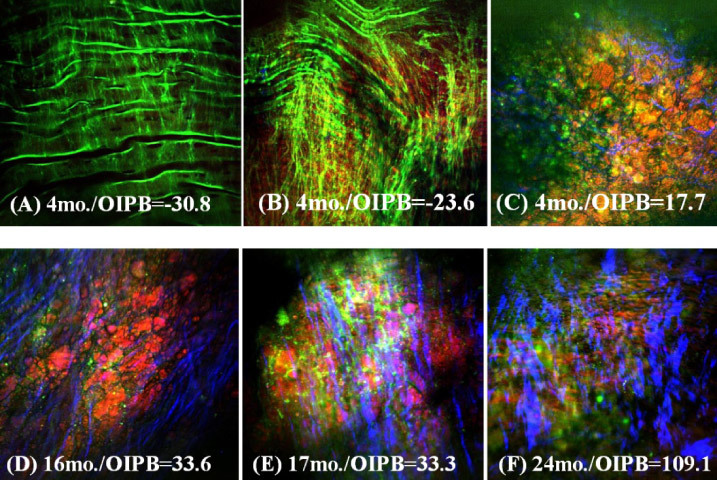
Representative epi-NLO images obtained from the luminal surface of thoracic aorta of rabbits sacrificed at (A), (B) and (C) 4 months (D) 16 months (E) 17 months and (F) 24 months of age. Images were collected using 20x air objective lens. These are the sum images of 5 consecutive image planes taken at 2 µm steps from 20µm to 30µm beneath the luminal surface. Green is TPEF signal representing elastin fiber and other endogenous fluorescent molecules; Blue is SHG signal representing fibrillar collagen; Red is CARS signal representing lipids-rich structures in plaque.
Figures 10A and 10B show a healthy lumen with a very low OIPB index of −30.8 and - 23.6, respectively, and Fig. 10C shows an image with an OIPB of 17.7 taken from an early lesion (or a fatty streak) found in a 4 months-old rabbit artery.
The biochemical tissue morphology looks very different between these three images and this difference is also reflected in their respective OIPB values. Figures 10D and 10E are images of plaques found in the arteries of 16 and 17 months-old rabbits. These lesions are more advanced than that shown in Fig. 10C. The OIPB index for the images in Fig. 10D and 10E are both higher than that of Fig. 10C reflecting the more advanced nature of the plaque. Figure 10F shows an image of the surface of a plaque from a 24 months-old rabbit that died of natural causes. An OIPB index of 109.1 is calculated from this image which is the highest among all those illustrated in Fig. 10.
Correlation analysis using OIPB indices, WHHLMI rabbit age, disease state and biochemical tissue morphology clearly show that younger rabbits with less plaque development have a lower OIPB index with the NLO images of healthy lumen generally having a negative OIPB value. This negative OIPB value is a result of the near-zero significant signal scores, SSSHG and SSCARS, along with the negative values of d(SSSHG, SSTPEF) and d(SSCARS, SSTPEF) in Eq. (1). As shown in Figs. 3A, 3C, 3E, 3G, 5A, 5B, 5C, 10A and 10B, internal elastic membrane and elastin fibers were often the only major extracellular component in the images of healthy lumen thus resulting in near-zero SSSHG and SSCARS scores. As atherosclerotic lesions progress, either SSSHG (collagen content) or SSCARS (lipids content) or both scores increase, thus leading to higher OIPB values. The last term d(SSCARS, SSSHG) in Eq. (1) can help differentiate type V(Va) from type IV atheroma by distinguishing the relative intensity difference between SHG (mostly from collagen) and CARS (mostly from lipid-rich structures) signals. According to the classification of atherosclerotic lesions provided by American Heart Association [44], type IV lesions are characterized by dense accumulation of extracellular lipid while type V display the formation of prominent new fibrous connective tissue. The d(SSCARS, SSSHG) score is therefore more likely to be higher for a type V(Va) lesion than for a type IV lesion due to higher collagen density this in turn will result in a higher OIPB index for a type V(Va) atheroma.
Visual investigation of the NLO images not only show the formation of fibrillar collagen and lipid-rich structures on the lumen surface in progressive plaques, but also the texture of the collagen fibrils change during the course of lesion development. For example, an image acquired from an early lesion shows only thin sparse collagen fibrils (Fig. 10C) but in advanced lesions (Fig. 10E and 10F) the collagen fibrils are thicker and more directional. We believe that more detailed texture analysis of fibrillar collagen visualized by SHG could lead to further objective measures of plaque development that could augment our current intensity-based model in quantifying plaque burden from label–free NLO imaging of arteries.
4. Conclusion
An intensity-based parameter based on three intrinsic nonlinear optical signals, TPEF, SHG and CARS, collected from images of the lumen surface of the aorta from rabbits was developed that provides a quantitative model for differentiating atherosclerotic plaque burden. This new optical index for plaque burden, OIPB, was defined using the NLO images acquired from ex-vivo samples of un-sectioned bulk rabbit arterial tissue. This index showed a correlation with the age of the WHHLMI rabbits and the severity of the atherosclerotic lesions in the rabbits. Additional texture and shape analysis of the collagen fibrils detected in the SHG imaging of lesions and a larger number of samples could further improve the reliability of the proposed model for the quantification of plaque burden in the WHHLMI model. Given that human plaque development goes through stages of development involving the same key biochemical building blocks that can be sensitively detected by NLO imaging, this work suggests that a similar strategy could be used to develop objective measures to classify human disease based on NLO imaging.
Acknowledgements
We acknowledge Vijay Iyer for his assistance provided in using ScanImage software, Luiz C.B.M. Guidolin for his suggestions in data analysis, and Saro Bascaramurty for performing histological analysis. This work was supported by National Research Council Canada, Genomics and Health Initiative under program “Heart disease: better tools for better treatment”.
References and links
- 1.Libby P., “Atherosclerosis: disease biology affecting the coronary vasculature,” Am. J. Cardiol. 98(12), S3–S9 (2006). 10.1016/j.amjcard.2006.09.020 [DOI] [PubMed] [Google Scholar]
- 2.Hansson G. K., “Inflammation, atherosclerosis, and coronary artery disease,” N. Engl. J. Med. 352(16), 1685–1695 (2005). 10.1056/NEJMra043430 [DOI] [PubMed] [Google Scholar]
- 3.Lusis A. J., “Atherosclerosis,” Nature 407(6801), 233–241 (2000). 10.1038/35025203 [DOI] [PMC free article] [PubMed] [Google Scholar]
- 4.Courtney B. K., Munce N. R., Anderson K. J., Thind A. S., Leung G., Radau P. E., Foster F. S., Vitkin I. A., Schwartz R. S., Dick A. J., Wright G. A., Strauss B. H., “Innovations in imaging for chronic total occlusions: a glimpse into the future of angiography’s blind-spot,” Eur. Heart J. 29(5), 583–593 (2008). 10.1093/eurheartj/ehm634 [DOI] [PubMed] [Google Scholar]
- 5.Bluemke D. A., Achenbach S., Budoff M., Gerber T. C., Gersh B., Hillis L. D., Hundley W. G., Manning W. J., Printz B. F., Stuber M., Woodard P. K., “Noninvasive coronary artery imaging: magnetic resonance angiography and multidetector computed tomography angiography: a scientific statement from the american heart association committee on cardiovascular imaging and intervention of the council on cardiovascular radiology and intervention, and the councils on clinical cardiology and cardiovascular disease in the young,” Circulation 118(5), 586–606 (2008). 10.1161/CIRCULATIONAHA.108.189695 [DOI] [PubMed] [Google Scholar]
- 6.Honda Y., Fitzgerald P. J., “Frontiers in intravascular imaging technologies,” Circulation 117(15), 2024–2037 (2008). 10.1161/CIRCULATIONAHA.105.551804 [DOI] [PubMed] [Google Scholar]
- 7.Yock P. G., Fitzgerald P. J., “Optimal Directional Coronary Atherectomy Final Results of the Optimal Atherectomy Restenosis Study (OARS),” Am. J. Cardiol. 81, 27E–32E (1998). [DOI] [PubMed] [Google Scholar]
- 8.Hodgson J. M., Reddy K. G., Suneja R., Nair R. N., Lesnefsky E. J., Sheehan H. M., “Intracoronary ultrasound imaging: correlation of plaque morphology with angiography, clinical syndrome and procedural results in patients undergoing coronary angioplasty,” J. Am. Coll. Cardiol. 21(1), 35–44 (1993). 10.1016/0735-1097(93)90714-C [DOI] [PubMed] [Google Scholar]
- 9.Sun J., Zhang Z., Lu B., Yu W., Yang Y., Zhou Y., Wang Y., Fan Z., “Identification and quantification of coronary atherosclerotic plaques: a comparison of 64-MDCT and intravascular ultrasound,” AJR Am. J. Roentgenol. 190(3), 748–754 (2008). 10.2214/AJR.07.2763 [DOI] [PubMed] [Google Scholar]
- 10.Barlis P., Schmitt J. M., “Current and future developments in intracoronary optical coherence tomography imaging,” EuroIntervention 4(4), 529–533 (2009). [DOI] [PubMed] [Google Scholar]
- 11.Barlis P., Serruys P. W., Devries A., Regar E., “Optical coherence tomography assessment of vulnerable plaque rupture: predilection for the plaque ‘shoulder’,” Eur. Heart J. 29(16), 2023 (2008). 10.1093/eurheartj/ehn085 [DOI] [PubMed] [Google Scholar]
- 12.Barlis P., Ferrante G., Del Furia F., Di Mario C., “In-vivo characterisation of coronary atherosclerosis with optical coherence tomography,” Med. J. Aust. 188(12), 728 (2008). [DOI] [PubMed] [Google Scholar]
- 13.Jang I. K., Tearney G. J., MacNeill B., Takano M., Moselewski F., Iftima N., Shishkov M., Houser S., Aretz H. T., Halpern E. F., Bouma B. E., “In vivo characterization of coronary atherosclerotic plaque by use of optical coherence tomography,” Circulation 111(12), 1551–1555 (2005). 10.1161/01.CIR.0000159354.43778.69 [DOI] [PMC free article] [PubMed] [Google Scholar]
- 14.Rocha R., Silveira L., Jr, Villaverde A. B., Pasqualucci C. A., Costa M. S., Brugnera A., Jr, Pacheco M. T. T., “Use of near-infrared Raman spectroscopy for identification of atherosclerotic plaques in the carotid artery,” Photomed. Laser Surg. 25(6), 482–486 (2007). 10.1089/pho.2007.2111 [DOI] [PubMed] [Google Scholar]
- 15.Komachi Y., Sato H., Tashiro H., “Intravascular Raman spectroscopic catheter for molecular diagnosis of atherosclerotic coronary disease,” Appl. Opt. 45(30), 7938–7943 (2006). 10.1364/AO.45.007938 [DOI] [PubMed] [Google Scholar]
- 16.Motz J. T., Fitzmaurice M., Miller A., Gandhi S. J., Haka A. S., Galindo L. H., Dasari R. R., Kramer J. R., Feld M. S., “In vivo Raman spectral pathology of human atherosclerosis and vulnerable plaque,” J. Biomed. Opt. 11(2), 021003 (2006). 10.1117/1.2190967 [DOI] [PubMed] [Google Scholar]
- 17.Nogueira G. V., Silveira L., Martin A. A., Zângaro R. A., Pacheco M. T., Chavantes M. C., Pasqualucci C. A., “Raman spectroscopy study of atherosclerosis in human carotid artery,” J. Biomed. Opt. 10(3), 031117 (2005). 10.1117/1.1908129 [DOI] [PubMed] [Google Scholar]
- 18.Römer T. J., Brennan J. F., 3rd, Puppels G. J., Zwinderman A. H., van Duinen S. G., van der Laarse A., van der Steen A. F., Bom N. A., Bruschke A. V., “Intravascular ultrasound combined with Raman spectroscopy to localize and quantify cholesterol and calcium salts in atherosclerotic coronary arteries,” Arterioscler. Thromb. Vasc. Biol. 20(2), 478–483 (2000). [DOI] [PubMed] [Google Scholar]
- 19.Zipfel W. R., Williams R. M., Webb W. W., “Nonlinear magic: multiphoton microscopy in the biosciences,” Nat. Biotechnol. 21(11), 1369–1377 (2003). 10.1038/nbt899 [DOI] [PubMed] [Google Scholar]
- 20.Helmchen F., Denk W., “Deep tissue two-photon microscopy,” Nat. Methods 2(12), 932–940 (2005). 10.1038/nmeth818 [DOI] [PubMed] [Google Scholar]
- 21.Zipfel W. R., Williams R. M., Christie R., Nikitin A. Y., Hyman B. T., Webb W. W., “Live tissue intrinsic emission microscopy using multiphoton-excited native fluorescence and second harmonic generation,” Proc. Natl. Acad. Sci. U.S.A. 100(12), 7075–7080 (2003). 10.1073/pnas.0832308100 [DOI] [PMC free article] [PubMed] [Google Scholar]
- 22.Campagnola P. J., Loew L. M., “Second-harmonic imaging microscopy for visualizing biomolecular arrays in cells, tissues and organisms,” Nat. Biotechnol. 21(11), 1356–1360 (2003). 10.1038/nbt894 [DOI] [PubMed] [Google Scholar]
- 23.Williams R. M., Zipfel W. R., Webb W. W., “Interpreting second-harmonic generation images of collagen I fibrils,” Biophys. J. 88(2), 1377–1386 (2005). 10.1529/biophysj.104.047308 [DOI] [PMC free article] [PubMed] [Google Scholar]
- 24.Zoumi A., Yeh A., Tromberg B. J., “Imaging cells and extracellular matrix in vivo by using second-harmonic generation and two-photon excited fluorescence,” Proc. Natl. Acad. Sci. U.S.A. 99(17), 11014–11019 (2002). 10.1073/pnas.172368799 [DOI] [PMC free article] [PubMed] [Google Scholar]
- 25.Cheng J.-X., Xie X. S., “Coherent Anti-Stokes Raman Scattering Microscopy: Instrumentation, Theory, and Applications,” J. Phys. Chem. B 108(3), 827–840 (2004). 10.1021/jp035693v [DOI] [Google Scholar]
- 26.Evans C. L., Potma E. O., Puoris’haag M., Côté D., Lin C. P., Xie X. S., “Chemical imaging of tissue in vivo with video-rate coherent anti-Stokes Raman scattering microscopy,” Proc. Natl. Acad. Sci. U.S.A. 102(46), 16807–16812 (2005). 10.1073/pnas.0508282102 [DOI] [PMC free article] [PubMed] [Google Scholar]
- 27.Nan X., Cheng J.-X., Xie X. S., “Vibrational imaging of lipid droplets in live fibroblast cells with coherent anti-Stokes Raman scattering microscopy,” J. Lipid Res. 44(11), 2202–2208 (2003). 10.1194/jlr.D300022-JLR200 [DOI] [PubMed] [Google Scholar]
- 28.Wu Y.-M., Chen H.-C., Chang W.-T., Jhan J.-W., Lin H.-L., Liau I., “Quantitative assessment of hepatic fat of intact liver tissues with coherent anti-stokes Raman scattering microscopy,” Anal. Chem. 81(4), 1496–1504 (2009). 10.1021/ac8026838 [DOI] [PubMed] [Google Scholar]
- 29.Zoumi A., Lu X., Kassab G. S., Tromberg B. J., “Imaging coronary artery microstructure using second-harmonic and two-photon fluorescence microscopy,” Biophys. J. 87(4), 2778–2786 (2004). 10.1529/biophysj.104.042887 [DOI] [PMC free article] [PubMed] [Google Scholar]
- 30.Lilledahl M. B., Haugen O. A., de Lange Davies C., Svaasand L. O., “Characterization of vulnerable plaques by multiphoton microscopy,” J. Biomed. Opt. 12(4), 044005 (2007). 10.1117/1.2772652 [DOI] [PubMed] [Google Scholar]
- 31.Wang H.-W., Le T. T., Cheng J.-X., “Label-free imaging of arterial cells and extracellular matrix using a multimodal CARS microscope,” Opt. Commun. 281(7), 1813–1822 (2008). 10.1016/j.optcom.2007.07.067 [DOI] [PMC free article] [PubMed] [Google Scholar]
- 32.Le T. T., Langohr I. M., Locker M. J., Sturek M., Cheng J.-X., “Label-free molecular imaging of atherosclerotic lesions using multimodal nonlinear optical microscopy,” J. Biomed. Opt. 12(5), 054007 (2007). 10.1117/1.2795437 [DOI] [PMC free article] [PubMed] [Google Scholar]
- 33.Wang H.-W., Langohr I. M., Sturek M., Cheng J.-X., “Imaging and quantitative analysis of atherosclerotic lesions by CARS-based multimodal nonlinear optical microscopy,” Arterioscler. Thromb. Vasc. Biol. 29(9), 1342–1348 (2009). 10.1161/ATVBAHA.109.189316 [DOI] [PMC free article] [PubMed] [Google Scholar]
- 34.Pegoraro A. F., Ridsdale A., Moffatt D. J., Jia Y., Pezacki J. P., Stolow A., “Optimally chirped multimodal CARS microscopy based on a single Ti:sapphire oscillator,” Opt. Express 17(4), 2984–2996 (2009). 10.1364/OE.17.002984 [DOI] [PubMed] [Google Scholar]
- 35.Ko A. C.-T., Ridsdale A., Smith M. S. D., Mostaço-Guidolin L. B., Hewko M. D., Pegoraro A. F., Kohlenberg E. K., Schattka B., Shiomi M., Stolow A., Sowa M. G., “Multimodal nonlinear optical imaging of atherosclerotic plaque development in myocardial infarction-prone rabbits,” J. Biomed. Opt. 15(2), 020501 (2010). 10.1117/1.3353960 [DOI] [PubMed] [Google Scholar]
- 36.Tang S., Jung W., McCormick D., Xie T., Su J., Ahn Y. C., Tromberg B. J., Chen Z., “Design and implementation of fiber-based multiphoton endoscopy with microelectromechanical systems scanning,” J. Biomed. Opt. 14(3), 034005 (2009). 10.1117/1.3127203 [DOI] [PMC free article] [PubMed] [Google Scholar]
- 37.Liu G., Xie T., Tomov I. V., Su J., Yu L., Zhang J., Tromberg B. J., Chen Z., “Rotational multiphoton endoscopy with a 1 microm fiber laser system,” Opt. Lett. 34(15), 2249–2251 (2009). 10.1364/OL.34.002249 [DOI] [PMC free article] [PubMed] [Google Scholar]
- 38.Balu M., Liu G., Chen Z., Tromberg B. J., Potma E. O., “Fiber delivered probe for efficient CARS imaging of tissues,” Opt. Express 18(3), 2380–2388 (2010). 10.1364/OE.18.002380 [DOI] [PMC free article] [PubMed] [Google Scholar]
- 39.Shiomi M., Ito T., Yamada S., Kawashima S., Fan J., “Development of an animal model for spontaneous myocardial infarction (WHHLMI rabbit),” Arterioscler. Thromb. Vasc. Biol. 23(7), 1239–1244 (2003). 10.1161/01.ATV.0000075947.28567.50 [DOI] [PubMed] [Google Scholar]
- 40.Shiomi M., Ito T., Yamada S., Kawashima S., Fan J., “Correlation of vulnerable coronary plaques to sudden cardiac events. Lessons from a myocardial infarction-prone animal model (the WHHLMI rabbit),” J. Atheroscler. Thromb. 11(4), 184–189 (2004). [DOI] [PubMed] [Google Scholar]
- 41.Whittaker P., Kloner R. A., Boughner D. R., Pickering J. G., “Quantitative assessment of myocardial collagen with picrosirius red staining and circularly polarized light,” Basic Res. Cardiol. 89(5), 397–410 (1994). 10.1007/BF00788278 [DOI] [PubMed] [Google Scholar]
- 42.Pologruto T. A., Sabatini B. L., Svoboda K., “ScanImage: flexible software for operating laser scanning microscopes,” Biomed. Eng. Online 2(1), 13 (2003). 10.1186/1475-925X-2-13 [DOI] [PMC free article] [PubMed] [Google Scholar]
- 43.Strupler M., Pena A. M., Hernest M., Tharaux P. L., Martin J. L., Beaurepaire E., Schanne-Klein M. C., “Second harmonic imaging and scoring of collagen in fibrotic tissues,” Opt. Express 15(7), 4054–4065 (2007). 10.1364/OE.15.004054 [DOI] [PubMed] [Google Scholar]
- 44.Stary H. C., Chandler A. B., Dinsmore R. E., Fuster V., Glagov S., Insull W., Jr, Rosenfeld M. E., Schwartz C. J., Wagner W. D., Wissler R. W., “A definition of advanced types of atherosclerotic lesions and a histological classification of atherosclerosis. A report from the Committee on Vascular Lesions of the Council on Arteriosclerosis, American Heart Association,” Circulation 92(5), 1355–1374 (1995). [DOI] [PubMed] [Google Scholar]
- 45.Buja L. M., Kita T., Goldstein J. L., Watanabe Y., Brown M. S., “Cellular pathology of progressive atherosclerosis in the WHHL rabbit. An animal model of familial hypercholesterolemia,” Arteriosclerosis 3(1), 87–101 (1983). [DOI] [PubMed] [Google Scholar]
- 46.Seddon A. M., Woolf N., La Ville A., Pittilo R. M., Rowles P. M., Turner P. R., Lewis B., “Hereditary hyperlipidemia and atherosclerosis in the rabbit due to overproduction of lipoproteins. II. Preliminary report of arterial pathology,” Arteriosclerosis 7(2), 113–124 (1987). [DOI] [PubMed] [Google Scholar]


