

Abstract
It is well established that the tumour microenvironment can both promote and suppress tumour growth and invasion, however most mathematical models view the normal tissue as inhibiting tumour progression via immune modulation or spatial constraint. In particular, the production of acid by tumour cells and the subsequent creation of a low extracellular pH environment has been explored in several ‘acid-mediated tumour invasion’ models where the acidic environment facilitates normal cell death and permits tumour invasion. In this paper, we extend the acid-invasion model developed by Gatenby and Gawlinski (1996) to include both the competitive and cooperative interactions between tumour and normal cells, by incorporating the influence of extracellular matrix and protease production at the tumour-stroma interface. Our model predicts an optimal level of tumour acidity which produces both cell death and matrix degradation. Additionally, very aggressive tumours prevent protease production and matrix degradation by excessive normal cell destruction, leading to an acellular (but matrix filled) gap between the tumour and normal tissue, a feature seen in encapsulated tumours. These results sugest, counterintuitively, that increasing tumour acidity may, in some cases, prevent tumour invasion.
Keywords: Cancer, pH, Acidity, Proteases, Microenvironment
3 Introduction
Cancer progression involves intimate interactions and signalling between tumour cells and the stroma, the host cells and tissues. Initial research viewed cancer as a linear progression of genetic mutations independent of the surrounding environment, and saw the tumour stroma as providing a suppressive environment through immune system screening (Mueller and Fusenig, 2004).
However, there is overwhelming evidence showing that the tumour microenvironment can play a key role in promoting tumour progression and invasion (Liotta and Kohn, 2001, Shekhar et al., 2003, DeWever and Mareel, 2003, Wernert, 1997, Bissell and Radisky, 2001, Coussens and Werb, 2002, Mueller and Fusenig, 2004). An example of this is the discovery that the majority of proteases responsible for extracellular matrix (ECM) degradation, and thus tumour invasion, in epithelial tumours are made by the stromal cells, not the tumour cells themselves (Chang and Werb, 2001, Pupa et al., 2002, Werb, 1997, Wernert, 1997). Understanding these specific interactions between tumour and stroma is important, especially because experiments which have attempted to normalise the reactive stroma have succeeded in reversing malignancy (Kenny and Bissell, 2003, Mueller and Fusenig, 2004). Hence, this study aims to examine the competitive and cooperative interactions between the tumour cells and stroma.
One aspect of the microenvironment of particular interest to cancer researchers is the low extracellular pH (pHe) produced by invasive tumours. Malignant tumours uptake significantly higher amounts of glucose (approximately one order of magnitude more) than normal tissues or benign tumours (Gatenby and Gillies, 2004, Gillies et al., 2008). The high levels of glycolysis followed by conversion to lactic acid lead to an excess of H+ ions, acidifying the surrounding tumour environment. This has been supported by experiments showing that tumour pHe is usually 0.5–1 units lower than normal tissue (tumour pHe of 6.5–7 versus a normal tissue pHe of 7.4) (Helmlinger et al., 1997, Schornack and Gillies, 2003, Tannock and Rotin, 1989).
In a series of papers, Gatenby and co-workers introduced the ‘acid-mediated invasion hypothesis’, proposing that tumour acidification confers an advantage to the tumour cells, by producing a harsh environment which facilitates tumour proliferation and invasion by promoting normal cell death and matrix degradation (Gatenby and Gawlinski, 1996, 2003, Gatenby and Gillies, 2004, Gatenby et al., 2006, Gatenby and Gillies, 2007, Gillies et al., 2008).
They proposed a series of mathematical models illustrating the process of acid invasion, which included tumour cells, ‘normal’ cells, and excess tumour derived acid (Gatenby and Gawlinski, 1996, Gatenby et al., 2006). The underlying assumption of these models is that the tumour cells create an acidic environment in which normal cells cannot survive. The normal cells subsequently die, and the tumour cells, which can survive in this altered environment, migrate into the free space, a process manifesting itself clinically as tumour invasion.
However, the ‘normal cells’ in a tumour microenvironment are of varied types, and acellular elements such as extracellular matrix and proteases, which are key elements in tumour invasion, are also present. As the tumour microenvironment is comprised of many different cell types, as well as non-cellular components such as extracellular matrix, a reasonable question, given this heterogeneity, is ‘How does acid-invasion work in vivo?’. Furthermore, by incorporating other elements into the model (such as ECM or different cell types), does this add to our understanding of tumour dynamics and suggest new or alternate treatments?
This paper aims to extend the Gatenby and Gawlinski (1996) acid invasion model in order to examine the competitive and cooperative interactions between the tumour cells and stromal cells needed to facilitate invasion. In doing so, we aim to present a model which effectively captures ways in which the stroma can facilitate or prevent malignant progression. We incorporate these complex interactions by separating the cellular and acellular (extracellular matrix) tissue components. Not only do the tumour cells need to degrade the matrix to create space, but actual structural changes are required in the ECM to facilitate cell migration during invasion (Giannelli et al., 1997, Stetler-Stevenson et al., 1993). Each of these components (cells versus extracellular matrix) is ‘removed’ by the tumour by a different mechanism. Normal cells are killed by the acid produced by the tumour, and ECM is degraded by the action of active matrix metalloproteinases (MMPs) which are produced when tumour and normal cells come into contact (see Figure 1) (Sameni et al., 2003).
Figure 1.
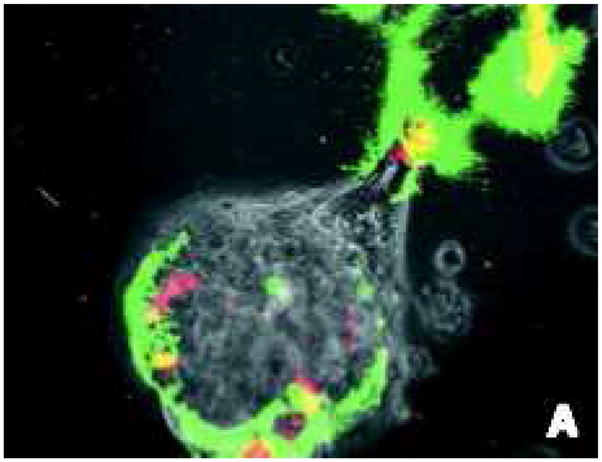
In colour online. Imaging used in vitro to identify active proteolysis (green) at the interface between the tumour cells (light gray sphere in lower middle of frame, extending to the upper left) and fibroblasts (red). Highest levels of degradation (yellow) occur at the direct contact points between tumour cells and fibroblasts. Image reproduced with permission from BC Decker: Molecular Imaging (Sameni et al., 2003).
4 Mathematical Model
The mathematical model presented in this paper is an extension of the acid-invasion model introduced in Gatenby and Gawlinski (1996). The original model included the following components:
Tumour cells produce excess acid, which diffuses into the surrounding tissue via mobile buffering species.
Acidification of the environment causes normal cell death.
Death of normal cells produces potential space into which the tumour cells may proliferate.
Importantly, our extended model incorporates two key additions:
In order to invade, the tumour cells must kill normal cells (as before) and remodel/degrade the extracellular matrix (ECM).
The ECM is remodelled/degraded by active matrix metalloproteinases (MMPs), which are formed at the interface between tumour and normal cells, as motivated below when the equations for the MMPs are discussed in detail.
The mathematical model is therefore as follows, where N1 is normal cell density (in cells/cm3), N2 is the tumour cell density (in cells/cm3), L is excess H+ ion concentration (in mol/cm3), N3 is the ECM density (in g/cm3), and A is active MMP density (in mol/cm3):
| (1) |
| (2) |
| (3) |
| (4) |
| (5) |
As in the Gatenby-Gawlinski model (1996), Equation (1) describes the change in density of the normal cells. The first term describes the normal cell proliferation, with growth rate r1 and carrying capacity K1. For simplicity and because it is not the focus of our investigation nor does it alter the qualitative results found in this study, we invoke the assumption made in Gatenby and Gawlinski (1996) that the carrying capacities of the tumour and normal cells are uncoupled. The normal cells die in proportion to the excess acid produced by the tumour, at a rate of d1. As the normal tissue is assumed to be well regulated, it does not diffuse in space.
Equation (2) details the tumour cell dynamics. The tumour cells grow at a rate r2 with a carrying capacity of K2. As tumour cells are more resilient to low pHe than normal cells, and no decline in growth rate of tumour cells is observed at the pHe in our simulations, we neglect tumour cell death from acidification (Gatenby and Gawlinski, 1996). As in the Gatenby and Gawlinski (1996) model, the tumour cells are assumed to diffuse into free space with a rate of D2, and are confined by the presence of normal cells.
Crucially, in Equation (2), the tumour movement has been altered by the addition of a diffusion limiting ECM component. In the original Gatenby-Gawlinski model, tumour cell diffusion is dependent on the creation of space by normal cell death via acidification. We expand this cell motility term, including the constraints of the ECM, making the tumour diffusion also dependent on the degradation or remodelling of the matrix. The tumour cells must facilitate movement both by killing the normal cells for space, and also by degrading/remodelling the ECM for motility. This is more realistic, as the tumour cells would need to do both to migrate into the surrounding tissue. Here, the ECM has a density of N3, and the tumour must degrade or remodel the ECM in addition to killing the normal tissue in order to invade.
Equation (3) describes excess tumour H+ ions, which are produced by the tumour at a rate r3. The excess acid is evacuated from the tissue via buffers and the vasculature, at a rate d3, which is proportional to the acid concentration. The acid diffuses in the tissue with diffusion rate of D3. To maintain electroneutrality, the diffusion of protons occurs in association with mobile buffer species, and D3 is calculated from an effective diffusion coefficient (Gatenby and Gawlinski, 1996).
Equation (4) represents the ECM, which is present initially at its normal density, K3, and can only be degraded or remodelled. Although matrix elements can be created by the normal cells the regulation of this process is not well understood, and as we are only interested in the net degradation via proteolysis, and not the actual turnover, we neglect that aspect in this model, as has been implemented in previous similar models (Perumpanani and Byrne, 1999, Webb et al., 1999). The ECM is degraded at a rate d4, and proportional to the level of active MMPs.
Equation (5) models the active MMPs. Recent experimental evidence and imaging has shown that in tumours, the majority of active proteases are produced via the interaction of tumour cells and immune system cells such as fibroblasts and macrophages (Zigrino et al., 2005, Chang and Werb, 2001, Sameni et al., 2003, Coussens and Werb, 2002, Rha et al., 1997). By far the largest part of active MMPs in tumours are produced in the inactive (pro-MMP) form by the stromal elements (Chang and Werb, 2001, Pupa et al., 2002, Rha et al., 1997, Stamenkovic, 2000, Wernert, 1997). These pro-MMPs diffuse in the tissue, bind to tumour cells, are cleaved, and activated at the tumour cell surface (Zigrino et al., 2005, Rha et al., 1997). Therefore, in reality the majority of active MMPs can only be made when normal and tumour cells come into contact. Indeed, imaging of active MMPs clearly shows activity only at the contact points of stromal and tumour cells, as shown in Figure 1 (Sameni et al., 2003).
Therefore, in line with these experimental results, we model the production of active proteases at the contact sites between the tumour and the normal cells using a mass action term, r5N1N2. Hence, the active MMP is created at a rate r5, and is proportional to the interaction between the normal and tumour cells. The MMPs decay at a rate d5, and diffuse with a diffusion coefficient of D5.
Using the nondimensionalisation η1 = N1/K1, η2 = N2/K2, η3 = N3/K3, Λ = (d3/r3K2)L, , Γ = (d4/r1)A, and τ = r1t, this system becomes
| (6) |
| (7) |
| (8) |
| (9) |
| (10) |
where , and .
The system is solved on a 1-D domain 0 ≤ ξ ≤ 2 with initial conditions:
| (11) |
| (12) |
| (13) |
| (14) |
| (15) |
The initial conditions are chosen such that there is no acid or proteases, and the ECM is distributed across the domain at its baseline level. We assume there are no normal cells inside the tumour boundary, and outside the tumour the normal cells are at their carrying capacity. The boundary conditions will either be no flux conditions or selected from the appropriate equilibrium values of interest, and detailed in the numerical results section. There are four spatially uniform equilibrium points associated with the system:
(η̃1,1, η̃2,1, Λ̃1, η̃3,1, Γ̃1) = (0, 0, 0, η3(0), 0), which is the trivial state with ECM present but no tissue, excess acid, or proteases.
(η̃1,2, η̃2,2, Λ̃2, η̃3,2, Γ̃2) = (1, 0, 0, η3(0), 0), which is the healthy state of normal tissue at the carrying capacity with ECM present but no tumour, excess acid, or active MMP.
, which is the coexistence of the tumour tissue at its carrying capacity with normal tissue at a lower level and the presence of proteases but no unremodelled matrix. The presence of no unremodelled matrix could indicate either full matrix degradation, or simply the presence of matrix which has been remodelled by the tumour.
(η̃1,4, η̃2,4, Λ̃4, η̃3,4, Γ̃4) = (0, 1, 1, η3(0), 0), which is the tumour tissue at its carrying capacity and no normal tissue. This state has no active proteases, and the ECM is at a normal level.
5 Results
5.1 Numerical simulations
In this section we present numerical results for Equations (6)–(10). The system is solved on a 1-D domain 0 ≤ ξ ≤ 2 and the parameters as in Table 1 using the Method of Lines with finite difference grid spacing of 0.01. The boundary conditions imposed were Neumann (no-flux) at ξ = 0 (representing the centre of the tumour), and η1 = 1, η2 = 0, Λ = 0, η3 = 1, and Γ = 0 at ξ = 2 corresponding to the tumour-free state.
Table 1.
Parameters used in the simulations of Equations (6)–(10). The carrying capacities of normal and tumour cells (K1,2 respectively), growth rates (r1,2), tumour diffusion (D2), acid diffusion (D3, and vascular evacuation (d3) parameters were taken from a previous acid-invasion modelling and experimental study by Gatenby and Gawlinski (1996). The diffusion of protons occurs in association with mobile buffer species to ensure charge balance, and the effective diffusion coefficient value used was estimated in Gatenby and Gawlinski (1996). From these values, Gatenby and Gawlinski (1996) calculate the tumour acid production rate (r3), and a range of values for the normal cell death rate from acid (d1) from which we select. Due to the large size of the MMP molecule, we assume that the diffusion of the active MMPs (D5) is 1/10th that of acid. We assume the rate of loss of the MMPs (d5) is the same order of magnitude as the excess acid (due to vascular evacuation), but reduced by about 1/3 as the MMPs are not locally buffered as is the case with the protons.
| Parameter | Definition | Value | Reference | |
|---|---|---|---|---|
| γ1 |
|
1–100 | (Gatenby and Gawlinski, 1996) | |
| δ2 | r2/r1 | 1 | (Gatenby and Gawlinski, 1996) | |
| α2 | D2/D3 | 4 × 10⁻⁵ | (Gatenby and Gawlinski, 1996) | |
| δ3 | d3/r1 | 70 | (Gatenby and Gawlinski, 1996) | |
| δ5 |
|
100 | estimated | |
| γ5 | d5/r1 | 50 | estimated | |
| α5 | D5/D3 | 0.1 | estimated |
In the Gatenby and Gawlinski (1996) model, the tumour cells produce acid which subsequently diffuses into the normal tissue, resulting in normal cell death and enabling tumour invasion. Increasing the tumour acid aggression parameter (by increasing acid production or normal cell sensitivity to acid) resulted in a monotonic increase in tumour invasion wavespeed. Following the simulations in Gatenby and Gawlinski (1996), we vary the tumour acid aggression parameter, γ1, and identify the resulting change in model behaviour. In our model, γ1 is proportional to acid production, r3, and normal cell sensitivity to acid (d1) so that increases in these parameters correspond to enhanced tumour agression.
Figure 3 shows the results for a low value of the tumour acid aggression parameter, γ1 = 0.5. In this case, corresponding to a tumour which is relatively unaggressive, there is coexistence between the tumour and normal cells, which slows the advancing tumour front. However, coexistence also produces a large amount of active protease, which effectively degrades the ECM. In Figure 4, γ1 = 1.5, which increases the aggressivity of the tumour by killing more of the normal cells, but there is still enough contact to allow production of proteases and ECM remodelling and the travelling wave still invades.
Figure 3.

In colour online. Travelling wave profiles through time of Equations (6)–(10) with γ1 = 0.5 for tumour cells (upper left), normal cells (upper right), excess H+ ions (middle left), ECM (middle right), and active MMP (lower left). The waves are moving from left to right in time, with τ = 160 (green dash), τ = 180 (yellow dash-dot), and τ = 200 (blue line). The lower right figure shows the late time (τ = 200) profiles of the normal tissue (cyan), tumour tissue (red), and ECM (black). Note the large overlap of tumour and normal tissue, which creates a high amount of MMPs and causes significant degradation of the ECM at the tumour wavefront. The system is solved with parameters as in Table 1, initial conditions as in Equations (11)–(15), boundary conditions as detailed in the text, with the simulations run up to τ = 200.
Figure 4.

In colour online. Travelling wave profiles through time of Equations (6)–(10) with γ1 = 1.5 for tumour cells (upper left), normal cells (upper right), excess H+ ions (middle left), ECM (middle right), and active MMP (lower left). The waves are moving from left to right in time, with τ = 160 (green dash), τ = 180 (yellow dash-dot), and τ = 200 (blue line). The lower right figure shows the late time (τ = 200) profiles of the normal tissue (cyan), tumour tissue (red), and ECM (black). Note that at the tumour-tissue interface there are low amounts of both normal tissue and ECM, facilitating tumour invasion. The system is solved with parameters as in Table 1, initial conditions as in Equations (11)–(15), boundary conditions as detailed in the text, with the simulations run up to τ = 200.
By contrast, in Figure 5, with a high tumour acid aggression parameter, γ1 = 12.5, the high tumour aggressivity which produced the aforementioned ‘gap’ between the normal and tumour tissue now introduces a situation where no active proteases can be made. As the stromal cells are particularly sensitive to the tumour derived acidity, they die close to the tumour front and the lack of contact between tumour and normal cells inhibits protease production. With no proteases, the tumour cannot remodel the matrix and proceed with invasion. As a result, the tumour front is slowed (shown in Figure 5 until τ = 180) and eventually halted (by τ = 200) as no movement can occur due to a fully intact ECM. Interestingly, the late time cell profiles in Figure 5 indicate a noninvasive tumour separated from the normal cells by a gap filled with ECM. This picture is similar to what is seen in the phenomenon known as tumour encapsulation, where a tumour is surrounded by a ring of acellular matrix (Figure 2).
Figure 5.

In colour online. Tumour cell, normal cell, acid, ECM, and MMP profiles through time of Equations (6)–(10) with γ1 = 12.5 for tumour cells (upper left), normal cells (upper right), excess H+ ions (middle left), ECM (middle right), and active MMP (lower left). The profiles are shown with τ = 160 (green dash), τ = 180 (yellow dash-dot), and τ = 200 (blue line). As all the profiles overlap in this situation, only the red is visible. In these simulations, invasion is halted by the lack of MMP production due to the acellular gap between tumour and normal tissue. The lower right figure shows the late time (τ = 200) profiles of the normal tissue (cyan), tumour tissue (red), and ECM (black). Note the presence of an acellular gap filled with noncellular components (ECM), which could present clinically as an encapsulated tumour. The system is solved with parameters as in Table 1, initial conditions as in Equations (11)–(15), boundary conditions as detailed in the text, with the simulations run up to τ = 200.
Figure 2.
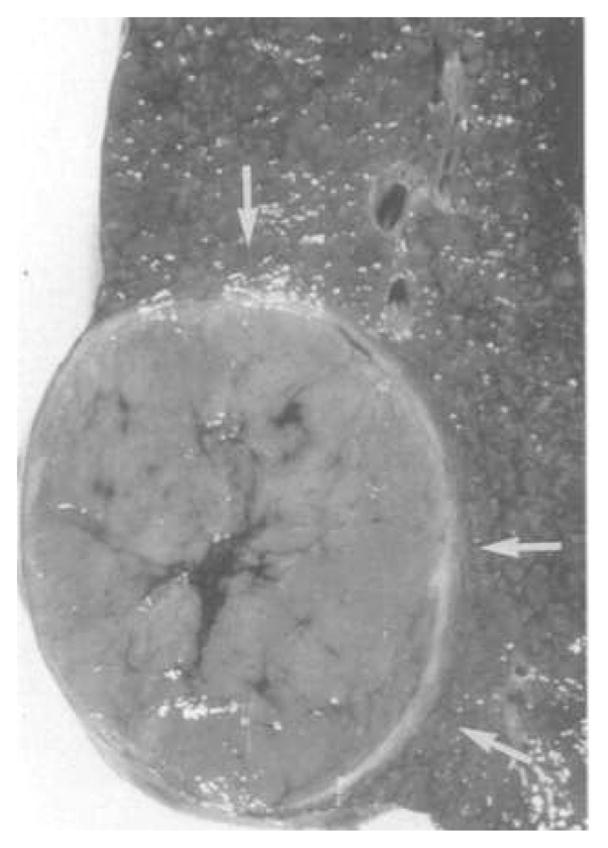
An encapsulated hepatocellular carcinoma. Arrows point to the encapsulated acellular tumour boundary. Figure reprinted with permission from Springer Science + Business Media (Ros et al., 1990).
Somewhat counterintuitively, however, this model predicts that tumours with very low tumour acid aggression parameter (translating to a very small γ1) and hence which have a large density of normal cells inside the tumour boundary, produce large amounts of active proteases throughout the tumour and at the boundary. Imaging of in vitro cocultures of tumour spheroids with large numbers of macrophages inside the tumour do show significant proteolysis throughout the interior of the tumour (Figure 6). However, although this might be the case for some types of tumours, it is unlikely to be true for all of them as the degree of stromal infiltrate varies widely between tumour types.
Figure 6.
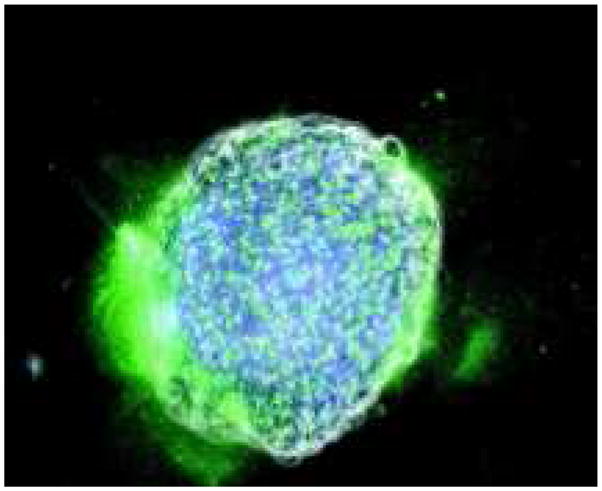
In colour online. Images of in vitro cocultures of a tumour spheroid (white) which contains fibroblasts (blue). Active proteolysis (green) is shown throughout the tumour, and at the lower left tumour boundary. Image reproduced from (Sameni et al., 2003).
5.2 Wavespeed of invasion
We would like to compare how the tumour invasion travelling wavespeed changes with the tumour acid aggression parameter, γ1 using Equations (6)–(10), as compared to the original model in Gatenby and Gawlinski (1996). In Gatenby and Gawlinski (1996), the wavespeed increases monotonically with increasing γ1, and is calculated analytically in (Fasano et al., 2009).
One important prediction from the Gatenby-Gawlinski model is that increased acid production by the tumour (leading to an increased tumour acid aggression parameter, γ1) would correlate with increased invasion (1996). In this model, the more acid a tumour produces, the bigger the gap is between the normal and tumour tissue, and the faster the invasion until it reaches a constant maximum invasion speed.
Figure 7 presents the differences in late-time tumour invasion travelling wavespeed between the Gatenby-Gawlinski (1996) model and our extended model (Equations (6)–(10)). Importantly, Figure 7 shows that increasing the tumour acid aggression parameter, γ1 in our model can actually slow invasion, instead of increasing it. The Gatenby-Gawlinski model exhibits monotonically increasing tumour invasion speed with increasing γ1. This implies that any increases in tumour acidity will never have a detrimental effect on tumour invasion speed. In contrast, our model shows a clear biphasic dependence on γ1. With low values of γ1, the tumour is not effective at killing the normal tissue and cannot invade quickly. With high values of γ1, however, the tumour kills the normal tissue so effectively that it creates an acellular gap separating the two cell populations. This separation inhibits the formation of MMPs, which in turn prevents the degradation of the ECM. The failure to degrade the ECM prevents the tumour from invading, despite its efficacy at killing the normal cells. With intermediate values of γ1, there is a balance between cell kill and matrix degradation to cause the fastest invasion.
Figure 7.

In colour online. Numerically calculated late time tumour invasion speed with the Gatenby-Gawlinski model (black circles) versus extended model (red squares, solutions to Equations (6)–(10)) with varying γ1. In the Gatenby-Gawlinski model, note the monotonically increasing wavespeed with increasing γ1. By contrast, in the extended model there is an optimal value of γ1 which facilitates invasion. High values of γ1 create a gap between the tumour and normal tissue, thus preventing MMP formation and ECM degradation, and stopping invasion. The system is solved with parameters as in Table 1, initial conditions are used as in Equations (11)–(15), boundary conditions are as detailed in the text, with the simulations run up to τ = 200. The late time invasion speed is calculated from the speed of the tumour front (designated at γ1 = 0.5, and located via interpolation) during the last Δτ = 5 interval.
5.3 Initial conditions
Extensive numerical simulations show that varying initial conditions of overlap between tumour and normal cells do not affect the final travelling wavespeed of the front as long as the tumour profile is semi-compact, but do alter the initiation and progression of the wave for a high tumour acid aggression parameter, γ1 ≫ 1. In the previous simulations the tumour cells had semi-compact initial conditions, and only a small overlap with the normal cells. The degree of initial overlap between normal and tumour cell densities alters the initial rate of invasion, due to the immediate production of active MMPs. When γ1 ≫ 1, the tumour cells will initiate a gap between tumour and normal stroma. This gap will inhibit the formation of MMPs, which in turn stops remodelling of the extracellular matrix. Therefore, in this scenario the invasion wave will cease. However, the degree of initial overlap between tumour and normal tissue will create a transient burst of MMP production which immediately degrades the matrix in the area of MMP production. Therefore, this initial degradation will allow the invasion wave to progress until it is eventually stopped by the lack of any further protease production.
5.4 Sensitivity analysis
In order to explore the sensitivity of the tumour invasion wavespeed to the other parameters in our system, we plot the wavespeed as a function of each individual parameter versus a range of values for the tumour aggression parameter, γ1. The results of this sensitivity analysis are shown in Figure 8. Notably, the presence of a unimodal wavespeed is robust to the wide range of parameter values sampled (spanning several orders of magnitude). All figures show an ‘optimal’ tumour aggression parameter value approximately 1 ≤ γ1 ≥ 2 where the wavespeed is maximised for a given choice of parameter. For low or high values of γ1 the wavespeed is reduced.
Figure 8.

Sensitivity analysis of the tumour wavsepeed for a given parameter against tumour aggression, γ1. Note the logarithmic scale of the horizontal axis (specified parameter) and also the wavespeed (shown in the colorbar).
As expected, increases in tumour and MMP diffusion constants (α2 and α5, respectively), as well as MMP production (δ5) and tumour proliferation (δ2) increase wavespeed. Increases in MMP or acid decay/evacuation (parameters γ5 and δ3, respectively) reduce the tumour wavespeed. Our analysis indicates that the wavespeed is most sensitive to changes in tumour proliferation δ2.
5.5 Model extensions
Growth competition: The model formulation in Gatenby and Gawlinski (1996) included growth competition terms between tumour and normal cells, representing competition for space or nutrients. However, the authors subsequently set the competition parameters to zero and drop these terms from the model analysis and results. To examine if the inclusion of competition and space limitation alters the previous results, we include competition in our extended model, making each growth term dependent on the other population size as originally presented in the Gatenby and Gawlinski (1996) paper. The full nondimensionalised set of equations are:
| (16) |
| (17) |
| (18) |
| (19) |
| (20) |
where and .
In these equations, the competition terms are represented by β1 and β2. The inclusion of competition limits total cell density when the tumour aggression parameter (γ1) is small (Figure 1, supplementary information). For large γ1 the results are unchanged from the previous model, as the high tumour aggression leads to total normal cell destruction within the tumour boundary. Supplementary Figure 2 shows the competition effect on wavespeed, with the addition of competition slowing the wavespeed for small γ1 as lower total cell densities result in less production of MMP, preventing the matrix degradation. However, the qualitative results found with varying γ1 remain unchanged. Hence, there still exists an optimal level of tumour aggression (at a lower level than without competition) whereby above this level invasion slows due to low of production of MMPs through lack of contact between normal and tumour cells.
ECM turnover
The basic model neglects ECM turnover (production and degradation by specific cell types such as myofibroblasts), instead representing net degradation/remodelling of the matrix by tumour and stromal derived proteases. The complex dynamics of matrix turnover in tumour development are not well understood, preventing a full characterisation of this process. Nevertheless, we explore the impact of including a general saturating ECM production term which is dependent on the presence of normal cells. The full model and simulations are presented in the supplementary information (Figure 3, supplementary information). Our analysis indicates that including high rates of ECM turnover can slow tumour invasion as ECM replacement negates degradation by MMPs. However, it cannot completely halt invasion within the wide range of parameter values sampled (varying by several orders of magnitude). Therefore, the inclusion of ECM turnover does not qualitatively alter the results presented by the basic model.
6 Discussion and conclusions
6.1 Discussion: Invasion speed
In contrast to the Gatenby-Gawlinski model, the model presented in this paper predicts that the speed of invasion does not increase monotonically with an increasing tumour acid aggression parameter, γ1 (a parameter which incorporates acid production, or sensitivity of normal cells to acid death). Similar to the Gatenby-Gawlinski model, there is an initial increase in invasion speed with increasing γ1 < 1. However, as γ1 increases to such a size where there is a distinct gap between tumour and normal tissue (γ1 ≫ 1), there is no active MMP production and ECM degradation. This causes a slowing, and eventual stopping of tumour invasion.
The clinical implications of the importance of initial conditions are intriguing, particularly when considering the phenotypic evolution of the tumour cells. As the tumour phenotype evolves through the progression of invasion, acid production may increase or decrease. Tumours which begin with very low excess H+ ion production may infiltrate widely into the surrounding normal tissue without completely destroying it. Through tumour evolution, there may be an increase in acid production which could push the tumour into the parameter regime where a gap forms, proteases can not be created, and invasion stops. However, if the tumour has disseminated widely throughout the surrounding tissue, the wave propagation may not terminate in the clinical setting, as enough of the tissue has been previously remodelled to facilitate the invasion wave.
In contrast, a tumour which remains homogeneous and compact, with little contact with the normal tissue, would have less initial matrix remodelling. Therefore, if that tumour type had a large increase in acid production, the halting of the wave would be seen essentially immediately.
During tumour development, it is likely that tumour aggression (γ1) will vary through time. For example, this change could be mediated through increases or decreases in tumour acid production levels. Additionally, it is likely that changes in vascularisation (and hence, acid evacuation) will occur as the tumour increases in size. In the initial stages of tumour formation, vascularisation may be low (and hence γ1 may be small). Cellular mutations and phenotypic evolution during tumour progression may serve to increase acid venting through the production of pro-angiogenic factors which induce blood vessel formation, thereby increasing the tumour aggression parameter, γ1. Therefore, although it is unlikely that tumour aggressiveness will be fixed, this manuscript explores the possible changes in vascularity or acid production by simulating scenarios with various values of γ1.
6.2 Discussion: Tumour encapsulation
The ECM model presented also exhibited a phenomenon not shown by the Gatenby and Gawlinski (1996) model: tumour encapsulation. Encapsulated tumours have low, or zero, invasion rates, and are characterised by an acellular gap between the tumour and the normal cells, filled with extracellular matrix which acts to contain the tumour (Figure 2). Importantly, there are several types of carcinomas (such as hepatocellular and Hurthle cell) which exhibit encapsulation (Ghossein et al., 2006, Ros et al., 1990). Although encapsulation does tend to correlate with a better prognosis, there is evidence of metastatic, reoccurring encapsulated carcinomas (Ghossein et al., 2006). Our MMP model is able to exhibit the phenomenon of a malignant, but encapsulated tumour. With a large tumour acid aggression parameter, γ1, the tumour is so aggressive that it kills the normal tissue and cannot produce MMPs to remodel the matrix for invasion, creating a ‘gap’ between the tumour and the normal tissue that is completely filled with ECM, which subsequently blocks tumour invasion.
Several mathematical models have been developed to study the phenomenon of tumour encapsulation (Perumpanani and Byrne, 1999, Sherratt, 1999, Jackson and Byrne, 2002). Most of these papers have either utilised the ‘foreign body hypothesis’ or the ‘expansive growth hypothesis’ (Barr et al., 1988, Barr, 1989). Neither hypothesis has fully explained all the clinical observations, which are detailed and compared in Table 2. The foreign body hypothesis proposes that the formation of the capsule is an active process undertaken by overactive fibroblasts, which deposit the ECM to form the capsule. The expansive growth hypothesis proposes that the capsule is a result of growth of the tumour and subsequent compression of the surrounding ECM.
Table 2.
The correct prediction (denoted by +) and incorrect prediction (denoted by −) of various clinical characteristics of encapsulated tumours with varying hypotheses (the expansive growth hypothesis, foreign body hypothesis, and acid-invasion hypothesis). If a hypothesis does not generate any prediction it is denoted by a question mark. Clinical predictions taken from (Ng et al., 1992, Ros et al., 1990, Lockwood et al., 2003, Gulubova, 1997).
| Expansive Growth | Hypothesis Foreign Body | Acid Invasion | |
|---|---|---|---|
| Characteristic | |||
| Low invasion | + | + | + |
| Presence not correlated with tumour size | − | + | + |
| Capsule thickness not correlated with tumour size | − | + | + |
| Increased numbers of myofibroblasts in stroma | − | + | − |
| Inflammatory infiltrate mild | + | ? | + |
| Some very small tumours have very thick capsules | − | + | + |
| Capsule not associated with increase in peritumoural fibrosis | + | − | + |
| Dense matrix in capsule (observation of Gulubova (1997)) | + | + | − |
| Absence of dense matrix in capsule (observation of Lockwood et al. (2003)) | − | − | + |
The expansive growth hypotheses predicts that the presence and thickness of the capsule would correlate with tumour size (as the tumour grows bigger it exerts more force on the ECM). However, clinical evidence shows there is no association between tumour size and encapsulation (either thickness or presence) (Ros et al., 1990, Ng et al., 1992). Our model supports that finding, as encapsulation would not correlate with size, but instead with the magnitude of tumour acid aggression, γ1. Biological aspects which would change this parameter are: acid production, acid loss (such as degree of vascularisation), and tumour carrying capacity (which could also be linked to vascularisation).
The foreign body hypothesis would predict that the highest concentration of ECM would be near the normal tissue boundary, as it is being produced there by the fibroblasts. Also, as fibroblasts are present inside tumours, this hypothesis would predict that there would be extra ECM deposition within encapsulated tumours. However, encapsulated tumours have little amounts of ECM, even less than in normal tissue (Lockwood et al., 2003).
The mathematical models of the expansive growth and foreign body hypotheses show a distinct peak of dense ECM forming the capsule (Perumpanani and Byrne, 1999, Sherratt, 1999, Jackson and Byrne, 2002). Our model, however, predicts that the ECM concentration is actually normal around the tumour, and that it is simply an acellular gap comprised of ECM. Although dense matrix does sometimes occur, Lockwood et al. (2003) carried out collagen I staining in non-encapsulated and encapsulated tumours and found little staining inside the tumour, and fairly uniform staining in the capsule and normal tissue, supporting our model predictions.
6.3 Conclusions
We have proposed an extension to the Gatenby and Gawlinski (1996) acid-mediated invasion model by incorporating the production of proteases and the degradation of the extracellular matrix, and their subsequent importance in tumour invasion. With addition of the degradation of ECM by MMPs produced at the tumour/normal tissue interface, we have explored the complex relationship of competition and dependence the tumour exhibits with the normal tissue.
By explicitly modelling the production of active MMPs at the tumour/normal tissue interface, we obtain a strikingly different wavespeed profile than the one found in Gatenby and Gawlinski (1996). Instead of a monotonically increasing wavespeed with increasing tumour acid aggression, γ1, we find a unimodal invasion speed, which is slow for very small and very large values of γ1, peaking around γ1 = 1.5. This result is important, because it suggests a counter-intuitive conclusion: that decreasing the tumour ‘aggressiveness’, may in fact increase the rate of tumour invasion. For example, if the tumour was so acidic that it killed off all the surrounding normal tissue and could not create MMPs to invade, then decreasing the tumour acidity might push it back into a region where it could destroy enough of the tissue and matrix for faster invasion. More generally, the model predicts that although the tumour may kill the stromal cells via acid-mediated tumour invasion, the tumour may also rely on the normal cells for continued invasion.
These results suggest an interesting nonintuitive and potential treatment: that increasing the acidity of a tumour could encapsulate some types of tumours and prevent invasion. Alternatively, it also predicts that decreased intratumoural vascularisation, which would lead to acid accumulation could also have the same effect. Interestingly, decreased vascularisation would also cause tumour hypoxia, which tends to cause an upregulation of anaerobic glycolysis and increased acid production. Therefore, loss of vasculature can act in a double manner, preventing acid evacuation and potentially increasing tumour aggressivity, which could cause result in encapsulation.
This model can be validated by measuring the invasion rates and presence of ECM with tumours with varying acid production rates, if characteristics such as vascularity could be kept constant. If a unimodal invasion speed is found, it would be an important verification of the model. Furthermore, pHe measurements of encapsulated tumours would indicate if the phenomenon is acidity dependent.
This is a basic model which can be built upon with several extensions. As noted, we have neglected to include the turnover dynamics of the ECM, which could be included. Importantly, if specific cell types regulating ECM turnover in tumours are separate to those which create proteases to facilitate tumour invasion, interesting dynamics could occur. Furthermore, we have simplified the MMP production term dynamics. Although a more detailed model of inactive pro-MMP production and activation produced qualitatively similar results (not shown), such studies could suggest alternate interventions to prevent the production of active proteases. Most importantly, however, the model only addresses MMPs, and not the other classes of proteases which can be present in tumours. Although the majority of proteases are MMPs, other proteases such as cathepsins and urokinase-type Plasminogen Activator can play a role in matrix degradation (Bissell and Radisky, 2001).
Hence, although this model raises intriguing questions about acidity, its main focus is the conceptual inclusion of the tumour cell competition and dependence on the stromal cells. Under different conditions stromal cells can either prevent or aid tumour invasion, perhaps alternating between these roles in time and space. Our model is a first attempt at capturing this complexity, and future mathematical models of tumour invasion will undoubtedly need to address these types of interactions to capture the full picture of malignancy in an effort to best prevent it.
It is important to note that the mechanism behind MMP activation and regulation is much more complex than in our simplified model, and is still being elucidated experimentally. However, we believe that the strength of the ECM model is that it captures an aspect of stromal dependence that is a fundamental aspect of tumour growth and invasion. Tumour cells rely on many different types of cells which they ultimately compete against. Not only do stromal cells produce growth factors, but they can also aid in cell migration, matrix remodelling, and nutrient delivery. Mathematical models which only include the competition side of tumour/stromal interactions fail to include the full complexity of the relationship. This model illustrates the potential importance of examining these interactions, particularly when considering possible therapies which target the tumour microenvironment.
Supplementary Material
Acknowledgments
7.1 Grant Support
NKM: This publication was funded by the National Cancer Institute, NIH grant U56CA113004. EAG: This publication is based on work supported in part by Award No. KUK-C1-013-04, made by King Abdullah University of Science and Technology (KAUST). PKM: This work was partially supported by a Royal Society-Wolfson Research Merit Award. RAG and PKM: This work was partially supported by NIH grant 1U54CA143970-01.
Footnotes
Publisher's Disclaimer: This is a PDF file of an unedited manuscript that has been accepted for publication. As a service to our customers we are providing this early version of the manuscript. The manuscript will undergo copyediting, typesetting, and review of the resulting proof before it is published in its final citable form. Please note that during the production process errors may be discovered which could affect the content, and all legal disclaimers that apply to the journal pertain.
References
- Barr L. The encapsulation of tumours. Clinical and Experimental Metastasis. 1989;7(3):277–282. doi: 10.1007/BF01753680. [DOI] [PubMed] [Google Scholar]
- Barr L, Carter R, Davies A. Encapsulation of tumours as a modified wound healing response. The Lancet. 1988;2(8603):135–7. doi: 10.1016/s0140-6736(88)90686-1. [DOI] [PubMed] [Google Scholar]
- Bissell M, Radisky D. Putting tumours in context. Nature Reviews Cancer. 2001;1(1):46–54. doi: 10.1038/35094059. [DOI] [PMC free article] [PubMed] [Google Scholar]
- Chang C, Werb Z. The many faces of metalloproteases: cell growth, invasion, angiogenesis and metastasis. Trends in Cell Biology. 2001;11(11):S37–43. doi: 10.1016/s0962-8924(01)02122-5. [DOI] [PMC free article] [PubMed] [Google Scholar]
- Coussens L, Werb Z. Inflammation and cancer. Nature. 2002;420(6917):860–7. doi: 10.1038/nature01322. [DOI] [PMC free article] [PubMed] [Google Scholar]
- DeWever O, Mareel M. Role of tissue stroma in cancer cell invasion. J Pathol. 2003;200(4):429–47. doi: 10.1002/path.1398. [DOI] [PubMed] [Google Scholar]
- Fasano A, Herrero M, Rodrigo M. Slow and fast invasion waves in a model of acid-mediated tumour growth. Mathematical Biosciences. 2009 Jul;220(1):45–56. doi: 10.1016/j.mbs.2009.04.001. [DOI] [PubMed] [Google Scholar]
- Gatenby R, Gawlinski E. A reaction-diffusion model of cancer invasion. Cancer Research. 1996;56(24):5745–53. [PubMed] [Google Scholar]
- Gatenby R, Gawlinski E. The glycolytic phenotype in carcinogenesis and tumor invasion: insights through mathematical models. Cancer Research. 2003;63(14):3847–54. [PubMed] [Google Scholar]
- Gatenby R, Gawlinski E, Gmitro A, Kaylor B, Gillies R. Acid-mediated tumor invasion: a multidisciplinary study. Cancer Research. 2006;66(10):5216–5223. doi: 10.1158/0008-5472.CAN-05-4193. [DOI] [PubMed] [Google Scholar]
- Gatenby R, Gillies R. Why do cancers have high aerobic glycolysis? Nature Reviews Cancer. 2004;4(11):891–899. doi: 10.1038/nrc1478. [DOI] [PubMed] [Google Scholar]
- Gatenby R, Gillies R. Glycolysis in cancer: A potential target for therapy. The International Journal of Biochemistry and Cell Biology. 2007;39(7–8):1358–1366. doi: 10.1016/j.biocel.2007.03.021. [DOI] [PubMed] [Google Scholar]
- Ghossein R, Hiltzik D, Carlson D, Patel S, Shaha A, Shah J, Tuttle R, Singh B. Prognostic factors of recurrence in encapsulated Hurthle cell carcinoma of the thyroid gland. Cancer. 2006;106(8):1669–1676. doi: 10.1002/cncr.21825. [DOI] [PubMed] [Google Scholar]
- Giannelli G, Falk-Marzillier J, Schiraldi O, Stetler-Stevenson W, Quaranta V. Induction of cell migration by matrix metalloprotease-2 cleavage of laminin-5. Science. 1997;277(5323):225. doi: 10.1126/science.277.5323.225. [DOI] [PubMed] [Google Scholar]
- Gillies R, Robey I, Gatenby R. Causes and consequences of increased glucose metabolism of cancers. Journal of Nuclear Medicine. 2008;49(Suppl 2):24S–42S. doi: 10.2967/jnumed.107.047258. [DOI] [PubMed] [Google Scholar]
- Gulubova M. Collagen type III and type IV detection in and around human hepatocellular carcinoma. General Diagnostic Pathology. 1997;142:275–84. [PubMed] [Google Scholar]
- Helmlinger G, Yuan F, Dellian M, Jain R. Interstitial pH and pO2 gradients in solid tumors in vivo: high-resolution measurements reveal a lack of correlation. Nat Med. 1997;3(2):177–82. doi: 10.1038/nm0297-177. [DOI] [PubMed] [Google Scholar]
- Jackson T, Byrne H. A mechanical model of tumor encapsulation and transcapsular spread. Mathematical Biosciences. 2002;180(1–2):307–328. doi: 10.1016/s0025-5564(02)00118-9. [DOI] [PubMed] [Google Scholar]
- Kenny P, Bissell M. Tumor reversion: correction of malignant behavior by microenvironmental cues. International Jounal of Cancer. 2003;107(5):688–95. doi: 10.1002/ijc.11491. [DOI] [PMC free article] [PubMed] [Google Scholar]
- Liotta L, Kohn E. The microenvironment of the tumour-host interface. Nature. 2001;411(6835):375–9. doi: 10.1038/35077241. [DOI] [PubMed] [Google Scholar]
- Lockwood D, Yeadon T, Clouston A, Crawford D, Fawcett J, Callaghan S, Gotley D. Tumor progression in hepatocellular carcinoma: Relationship with tumor stroma and parenchymal disease. Journal of Gastroenterology and Hepatology. 2003;18(6):666. doi: 10.1046/j.1440-1746.2003.03018.x. [DOI] [PubMed] [Google Scholar]
- Mueller M, Fusenig N. Friends or foes – bipolar effects of the tumour stroma in cancer. Nature Reviews Cancer. 2004;4(11):839–849. doi: 10.1038/nrc1477. [DOI] [PubMed] [Google Scholar]
- Ng I, Lai E, Ng M, Fan S. Tumor encapsulation in hepatocellular carcinoma. a pathologic study of 189 cases. Cancer. 1992 doi: 10.1002/1097-0142(19920701)70:1<45::aid-cncr2820700108>3.0.co;2-7. [DOI] [PubMed] [Google Scholar]
- Perumpanani A, Byrne H. Extracellular matrix concentration exerts selection pressure on invasive cells. European Journal of Cancer. 1999;35(8):1274–80. doi: 10.1016/s0959-8049(99)00125-2. [DOI] [PubMed] [Google Scholar]
- Pupa S, Menard S, Forti S, Tagliabue E. New insights into the role of extracellular matrix during tumor onset and progression. Journal of Cellular Physiology. 2002;192(3):259–267. doi: 10.1002/jcp.10142. [DOI] [PubMed] [Google Scholar]
- Rha S, Kim J, Roh J, Lee K, Min J, Kim B, Chung H. Sequential production and activation of matrix-metalloproteinase-9 (MMP-9) with breast cancer progression. Breast Cancer Res Treat. 1997;43(2):175–81. doi: 10.1023/a:1005701231871. [DOI] [PubMed] [Google Scholar]
- Ros P, Murphy B, Buck J, Olmedilla G, Goodman Z. Encapsulated hepatocellular carcinoma: Radiologic findings and pathologic correlation. Abdominal Imaging. 1990;15(1):233–237. doi: 10.1007/BF01888783. [DOI] [PubMed] [Google Scholar]
- Sameni M, Dosescu J, Moin K, Sloane B. Functional imaging of proteolysis: stromal and inflammatory cells increase tumor proteolysis. Molecular Imaging. 2003;2(3):159–75. doi: 10.1162/15353500200303136. [DOI] [PubMed] [Google Scholar]
- Schornack P, Gillies R. Contributions of cell metabolism and H+ diffusion to the acidic pH of tumors. Neoplasia. 2003;5(2):135–45. doi: 10.1016/s1476-5586(03)80005-2. [DOI] [PMC free article] [PubMed] [Google Scholar]
- Shekhar M, Pauley R, Heppner G. Host microenvironment in breast cancer development: extracellular matrix-stromal cell contribution to neoplastic phenotype of epithelial cells in the breast. Breast Cancer Research. 2003;5(3):130–5. doi: 10.1186/bcr580. [DOI] [PMC free article] [PubMed] [Google Scholar]
- Sherratt J. Traveling wave solutions of a mathematical model for tumor encapsulation. SIAM Journal of Applied Mathematics. 1999;60:392–407. [Google Scholar]
- Stamenkovic I. Matrix metalloproteinases in tumor invasion and metastasis. Seminars in Cancer Biology. 2000;10(6):415–33. doi: 10.1006/scbi.2000.0379. [DOI] [PubMed] [Google Scholar]
- Stetler-Stevenson W, Aznavoorian S, Liotta L. Tumor cell interactions with the extracellular matrix during invasion and metastasis. Annual Review of Cell Biology. 1993;9(1):541–573. doi: 10.1146/annurev.cb.09.110193.002545. [DOI] [PubMed] [Google Scholar]
- Tannock I, Rotin D. Acid pH in tumors and its potential for therapeutic exploitation. Cancer Research. 1989;49(16):4373–84. [PubMed] [Google Scholar]
- Webb S, Sherratt J, Fish R. Alterations in proteolytic activity at low pH and its association with invasion: A theoretical model. Clinical and Experimental Metastasis. 1999;17(5):397–407. doi: 10.1023/a:1006667303583. [DOI] [PubMed] [Google Scholar]
- Werb Z. ECM and cell surface proteolysis: regulating cellular ecology. Cell. 1997;91(4):439–42. doi: 10.1016/s0092-8674(00)80429-8. [DOI] [PubMed] [Google Scholar]
- Wernert N. The multiple roles of tumour stroma. Virchows Archives. 1997;430(6):433–443. doi: 10.1007/s004280050053. [DOI] [PubMed] [Google Scholar]
- Zigrino P, Loffek S, Mauch C. Tumor-stroma interactions: their role in the control of tumor cell invasion. Biochimie. 2005;87(3–4):321–8. doi: 10.1016/j.biochi.2004.10.025. [DOI] [PubMed] [Google Scholar]
Associated Data
This section collects any data citations, data availability statements, or supplementary materials included in this article.