

Abstract
Visual area V4 in the macaque monkey is a cortical area strongly involved in shape and color perception. However, fundamental questions about V4 are still debated. V4 was initially characterized as a color processing area but subsequent studies revealed that it contains a diverse complement of cells, including those with preference for color, orientation, disparity, as well as higher order feature preferences. This has led to disputes and uncertainty about the role of V4 in vision. In this study, using intrinsic signal optical imaging methods in awake, behaving monkeys, we demonstrate functional organization for different feature preferences within V4. Optical images reveal that regions with preferential response to color or luminance are largely separate from orientation selective regions. These results help resolve long-standing controversies regarding functional diversity and retinotopy within V4 and indicate the presence of spatially biased distribution of featural representation in V4 in the ventral visual pathway.
Neurophysiological and neuroanatomical evidence from the macaque monkey suggest that the cortical representation of different visual attributes, such as color (hue and luminance) and shape (contour orientation) features of visual objects, are preferentially localized in different compartments within early visual cortical areas (such as blobs and interblobs in the primary visual area (V1) and thick, thin stripes and interstripes in the secondary visual area V2)1,2. While this has led to a concept of functionally segregated streams in these early visual areas, there is also substantial evidence for merging and interaction between these streams3–5. Whether representation of these visual features remains localized in higher cortical areas is unknown.
Visual area V4 in the macaque monkey is a mid-tier cortical area in the ventral object-processing pathway, strongly involved in color and shape perception. Given the prevalence of neurons selective for color, it was initially characterized it as a color processing area6. However, subsequent studies revealed that V4 contains not only color-selective cells, but also many cells selective for other features, including orientation7–9. However, no studies to date have addressed the organization of both orientation and color preference in V410. To study the functional organization in V4 and address whether color and orientation representations are still localized to some degree in higher order areas, we examined the mapping of color/luminance and orientation preference in V4 of awake monkeys with optical imaging techniques. Existence of featural segregation in V4 would have significant implications for studies on the role of V4 in visual perception and feature-based attention11.
RESULTS
We used intrinsic signal optical imaging to reveal feature preference maps for orientation and color in dorsal V4 of macaque monkeys performing a fixation task. Imaging fields of view included a portion of V4 representing the central visual field (< 7° eccentricity) and, in some cases, a portion of V2 along the lunate sulcus. Reflectance images under 632 nm illumination were acquired during presentation of grating patches: isoluminant red/green (RG) or achromatic luminance contrast (Lum), tilted 45° or 135° from the horizontal. The stimulus-evoked reflectance change from the pre-stimulus period was calculated pixel-by-pixel. The maps of reflectance change were spatially high-pass filtered to remove low-spatial-frequency gradients, averaged across presentations in each stimulus condition, and subtracted by the map obtained in the ‘blank (no stimulus)’ condition to form single condition maps (blank subtraction, see Methods). Typically, signal amplitudes in single condition maps increased over the 3 second time course after the stimulus onset with peak magnitudes around −0.05 ~ −0.1% (Fig. 1, note that a negative reflectance change indicates signal), consistent with previous optical imaging studies12,13. Most sites exhibited some response to each stimulus. However, the signal intensity differed from site to site depending on stimulus condition (Fig. 1a). Some sites exhibited a larger change to either RG (Fig. 1b) or Lum (Fig. 1c) stimuli and no orientation preference, while other sites were orientation selective (Fig. 1d,e) regardless of grating color type (RG or Lum). Sites with selectivity for a particular combination of orientations and color types were also observed (Fig. 1f).
Figure 1. Examples of time course of stimulus-evoked reflectance change in V4.

(a) Sampled sites indicated by black crosses on an image of exposed V4 cortical surface taken under 570 nm illumination. Scale bar, 1 mm. (b-f) Time courses of average reflectance change (ΔR/R) under 632 nm illumination at the sampled sites (160 μm in diameter) in response to a stimulus patch containing one of four gratings (red: 45° RG, orange: 135° RG, blue: 45° Lum, blue: 135° Lum; see Methods for details). The response values were taken from the single condition map, in which high-pass filtering and blank subtraction were applied. Error bars represent SEM.
To reveal the spatial distribution of sensitivity to differences in stimulus features in foveal V4, we calculated difference maps between the single condition maps in two imaging cases (Fig. 2a: case 1, ~0.75° eccentricity, Fig. 2b: case 3, ~1.5° eccentricity). In one case, the difference map of RG minus Lum stimulus conditions showed several dark spots alternating with light spots along and anterior to the lunate sulcus (Fig. 2c, magenta arrowheads), indicating clusters of pixels with greater response to either RG (dark pixels) or Lum (light pixels). Using the same data set, the difference map of 45° minus 135° stimulus conditions revealed a different set of dark and light spots, most of which were observed away from and anterior to the lunate sulcus (Fig. 2d, green arrowheads), indicating clusters of pixels with preference to either 45° or 135°, respectively. In another case, the difference maps also revealed clusters of pixels sensitive to RG/Lum near the lunate sulcus (Fig. 2e, magenta arrowheads) and clusters of pixels sensitive to orientation away from the lunate sulcus (Fig. 2f, green arrowheads). [Note also in case 1, preference regions located in V2 (posterior to the lunate; cyan arrows in Fig. 2c,d). These RG/Lum-preferring regions and orientation preferring regions likely correspond to thin stripe and thick/pale stripe locations, respectively12,14]
Figure 2. Functional maps of color/luminance and orientation sensitivity in foveal V4.

(a,b) Views of the cortical surface including dorsal V4 through the imaging chamber. The white rectangles indicate the imaged regions (a, case 1; b, case 3). (c–f) Difference maps in response to isoluminant red/green gratings versus luminance-contrast achromatic gratings (c,e, RG – Lum) and gratings tilted counterclockwise 45° versus 135° from the horizontal (d,f, 45° – 135°). In these maps, dark versus light pixels represent greater response to RG versus Lum (c,e) and 45° versus 135° (d,f). Gratings above the maps indicate the subtraction pair for each difference map. (g–j) Statistical maps show significant differences in response to RG versus Lum (g,i) and 45° versus 135° (h,j) (two-tailed t-test, n = 414 trials for case 1 and 236 trials for case 3). Colored areas indicate significantly larger response to one of paired conditions, according to the key shown at the right. (k–n) Statistical maps revealed byusing two-way ANOVAs show regions with a significant main effect of stimulus color type (RG/Lum) (k,m, magenta), with a significant main effect of stimulus orientation (k,m, green), and with a significant interaction (l,n, white). In g–n, the brightness of color indicates the significance level, P < 0.05 (dark) and P < 0.0001 (bright), uncorrected, and dark gray regions indicate pixels with large cross-trial variability (see Methods). The sampled sites in Figure 1 are shown by black crosses in k. lu, lunate sulcus; st, superior temporal sulcus; io, inferior occipital sulcus; A, anterior; D, dorsal. Scale bar, 1 mm in c–n.
To evaluate the significance of these stimulus preferences, we performed a two-tailed t-test on a pixel-by-pixel basis. Because pixels on or near large vessels have a substantial trial-by-trial fluctuation in optical signals even in the blank condition, we excluded these pixels from the statistical analysis (dark gray pixels in Fig. 2g–n, see Methods). The statistical maps in response to RG versus Lum clearly revealed RG-preferring regions (Fig. 2g,i, orange) and Lum-preferring regions (Fig. 2g,i, cyan), which appeared to alternate or interdigitate. Similarly, the statistical maps in response to 45° versus 135° (Fig. 2h,j) revealed 45°-preferring regions (Fig. 2h,j, red) and 135°-preferring regions (Fig. 2h,j, yellow), which were also arranged in an interdigitating manner. The distribution of these stimulus preferences was largely conserved in statistical maps of individual pairwise comparison: orientation-matched RG versus Lum, and color-matched 45° versus 135° (Supplementary Fig. 1).
To examine the relative locations of the RG/Lum-sensitive regions and orientation-sensitive regions, we computed a two-way ANOVA at each pixel. One factor in the ANOVA was the stimulus color type (RG versus Lum), and the other factor was the stimulus orientation (45° versus 135°). Based on the ANOVA, we visualized the RG/Lum-sensitive regions (Fig. 2k,m, magenta) and orientation-sensitive regions (Fig. 2k,m, green), in which significant modulation was observed in either factor. This revealed that these RG/Lum-sensitive and orientation-sensitive regions were largely segregated, with some overlapping regions (white pixels indicate regions of overlap). The percentage of pixels falling within overlapping regions was only 5.90 ± 5.81 % of the total area of regions with any significant modulation in each case (mean ± SD, n = 4 imaging cases). The regions with a significant interaction between the two factors (color type and orientation; Fig. 2l,n) ware rarely observed (2.68 ± 3.44%), indicating that distribution of these color/luminance- or orientation-sensitive regions was mostly independent.
The relative organization of these RG/Lum-sensitive and orientation-sensitive regions differed between the two cases. In case 1, the RG/Lum-sensitive regions were located posteriorly close to the lunate sulcus (Fig. 2k, magenta), while most of the orientation preference regions were located about 2 mm away from the lunate sulcus (Fig. 2k, green). In case 3, the RG/Lum-sensitive region (Fig. 2m, magenta) fell between the two band-like orientation-sensitive regions (Fig. 2m, green). The difference in pattern of segregation between these two cases could be due to differences in cortical eccentricity or due to variability between animals. Despite these differences, these data indicate a clear segregation of domains concerned with color/luminance and with orientation within foveal V4.
Such segregation continued in the parafoveal portion of V4 (Fig. 3). We moved the field of view to a more dorsal location in the imaging chamber, a region representing ~5° eccentricity (Fig. 3a, Case 2). Difference maps showed dark or light spots in this portion, revealing clusters of pixels with a modulation by either RG/Lum (Fig. 3b) or orientation (Fig. 3c) change in the stimulus. Statistical maps for RG versus Lum (Fig. 3d) and for 45° versus 135° (Fig. 3e), respectively, revealed RG/Lum-preferring and orientation-preferring regions. Consistent with foveal imaging of case 1, there was an anterior-posterior segregation of RG/Lum-sensitive and orientation-sensitive regions (Fig 3f). In this case, there was no region with an interaction effect between stimulus color type and orientation in two-way ANOVAs (Fig. 3g). The continuity of this segregation is illustrated (Fig. 3h), by overlaying the maps from the foveal (Fig. 2k) and parafoveal V4 (Fig 3f). These two types of feature-sensitive regions appear to fall in large band-like regions (also seen in case 3, Fig. 2m). We therefore refer to these color- and orientation-sensitive regions as color and orientation bands, respectively.
Figure 3. Functional maps of color/luminance and orientation sensitivity in parafoveal V4.

(a–g) Data from a parafoveal V4 (~ 5° eccentricity) of the same animal as case 1 (case 2; n = 400 trials). Conventions are as for Figure 2. (h) Overlay of the maps of RG/Lum-sensitive (magenta) and orientation-sensitive (green) regions in the foveal (Fig. 2k) and parafoveal V4 (f), aligned using the surface blood vessel pattern. Note also, magenta and green regions in V2, consistent with thin and thick/pale stripe organization, respectively12,14. Scale bar, 1 mm.
To further confirm the validity of these maps, we imaged V4 using a different set of color and orientation stimuli. In case 1, color and orientation bands were revealed by using gratings of four different colors and two different orientations with the same luminance profile (Supplementary Fig. 2). The color and orientation bands were distributed in a similar manner to the maps revealed by RG and Lum imaging (Fig. 2k). Supplementary Table 1 shows areal measurements of color and orientation bands in all cases revealed by two-way ANOVAs using different sets of stimuli. Although increasing stimulus variation revealed more overlap between color and orientation bands, the total area of these overlapping regions were smaller in all cases than that expected by chance (estimated by multiplying the percentage of color-sensitive pixels by that of the orientation-sensitive pixels). These results indicate that the observed cortical segregation of color versus orientation bands was robust regardless of which stimulus set used. Furthermore, the locations of these bands were invariant across different stimulus sizes (see Supplemental Fig. 3).
The presence of apparently segregated functional regions within V4 raises the issue of relationship to retinotopy. Is there a single retinotopic map or multiple maps within this region? To explore this, we used a relatively small grating patch (1° in diameter) and presented it at different locations in the visual field (Fig. 4). As the stimulus location shifted away from the vertical meridian along a line of isoeccentricity, within the color band, the activation shifted from posterior to anterior (Fig. 4a–c). Within the orientation bands, the map shifted from the posterior band (Fig. 4d), to spanning both the anterior and posterior bands (Fig. 4e), to primarily the anterior band (Fig. 4f). As the location of the patch moved from central to peripheral along an isopolar line, the overall modulation shifted from ventral to dorsal, both within the color band (Fig 4g–i) and within the orientation bands (Fig 4j–l). The general topography was consistent with and extended the general V4 retinotopic map15. Importantly, for a single stimulus location, multiple zones of modulation were observed: one in a color band (e.g. Fig. 4b) and two others in adjacent orientation bands (e.g. Fig. 4e). This data was consistent with a continuous shifting of separate zones of activation within each of the color and orientation bands. Moreover, the observed ‘jumping’ from one orientation band to another as the stimulus shifted in the visual field parallels closely what is observed across functional stripes in V216. Although our observation was limited only to this portion of V4, our finding suggests that V4 contains multiple, interleaved retinotopic maps, perhaps similar to that found across V2 stripes16.
Figure 4. Overall spatial pattern of modulation by the stimulus at different locations in the visual field.

(a–f) Response to shifting the polar angle. Regions with a significant difference in response to RG versus Lum (a–c, case 3) and to 45° versus 135° (d–f), presented at a different polar angle with the same eccentricity as illustrated above (two-tailed t-test, n = 161 for a,d, 159 for b,e, and 151 trials for c,f). The center of stimuli was located at polar angles of 22.5° for a,d, 45° for b,e, and 67.5° for c,f from the vertical meridian and an eccentricity of 1.5°. As the stimulus location moved away from the vertical meridian along a line of isoeccentricity, the overall activation shifted from posterior to anterior (use vertical red lines as guide). (g–l) Response to shifting the eccentricity. Regions with a significant difference in response to RG versus Lum (g–i) and to 45° versus 135° (j–l), presented at a different eccentricity along an isopolar axis as illustrated above (two-tailed t-test, n = 164 for g,j, 159 for h,k, and 159 trials for i,l). The center of stimuli was located at a polar angle of 45° from the vertical meridian and at eccentricities of 0.5° for g,j, 1.5° for h,k, and 2.5° for i,l. As the stimulus location moved towards larger eccentricities, the overall activation shifted from ventral to dorsal (use horizontal red lines as guide). The size of grating patches was 1° in diameter. Scale bar, 1 mm.
One previously noted aspect of orientation maps in areas V1 and the thick/pale stripes in V2 is the regular progression of orientation selectivity across cortical columns. Previous studies have identified both linear progressions17 and those that occur in pinwheels18. We examined whether such structures are also characteristic of orientation maps in V4. Difference maps from two imaging cases revealed orientation-selective regions as either dark or light spots (Fig. 5a,b,d,e; orientation domains). The size of orientation domains was 570 ± 120 μm in diameter (mean ± SD, n = 16; see Methods for demarcation of the regions), larger than that in V2 (400 ± 100 μm, n = 4; two-tailed t-test, P = 0.025). Corresponding color-coded polar maps of orientation preference with statistical significance (one-way ANOVA) were calculated (Fig. 5c,f). Examination of local regions in the maps revealed the presence of several pinwheel-like structures (angle maps shown in Fig. 5g,h). We also found linear progressions of orientation preference in some cortical regions (Fig. 5i). Thus, not unlike V1 and V2, orientation-bands in V4 can contain both linear and pinwheel-like organizations for orientation.
Figure 5. Functional maps of orientation preference in V4.

(a,b) Difference maps to orthogonally oriented gratings (a, 0° −90°; b, 45° −135°; case 1). Dark versus light pixels represent greater response to 0° versus 90° (a) and 45° versus 135° (b). (c) Color-coded polar map of orientation preference (orientation preference indicated by hue and magnitude of orientation selectivity by brightness. Pure black regions represent pixels without significant selectivity for orientation (ANOVA, 4 orientations, P > 0.05, uncorrected, n = 690 trials). (d–f) Data from another animal (case 3; n = 468 trials). Conventions are as for a–c. (g–i) Angle maps of regions in white frames in c and f (frame 1, g; frame 2, h; frame 3, i). In these maps, all hues are saturated in brightness to indicate only orientation preference. Scale bar, 1 mm in a–f and 0.5 mm in g–i.
Previous studies have demonstrated the presence of color maps within V1 blobs19 and V2 thin stripes12. The presence of color maps within V4 has been postulated6 but never demonstrated. A recent electrophysiological study revealed that neurons with similar color preferences are moderately clustered in V420. To examine the presence of color maps in V4, we presented square-wave gratings with 100% luminance contrast either of 6 different hues or white (stimuli illustrated in Fig. 6a; see Methods for details). All colors including white had the same luminance. Some locations in V4 exhibited differential reflectance change in response to each hue (Fig. 6b). Color-coded polar maps of hue preference with statistical significance (one-way ANOVA) from the two cases are illustrated (Fig. 6c,d). Not unlike orientation progressions, some hue progressions appeared more linear (boxed region in Fig. 6c), while others appeared more circular (boxed region in Fig. 6d), suggestive of hue-preference pinwheels. As illustrated by overlaying contours for RG-preferring and Lum-preferring regions on these polar maps (Supplementary Fig. 4), RG-preferring regions were located primarily in the hue-selective regions, particularly in the red-yellow-green preferring domains. In contrast, Lum-preferring regions tended to include regions with low color preference and blue preference, similar to some previous reports of color preference in V216,21. It is possible that blue-preferring domains would not have been activated by RG gratings effectively, and would have lain within Lum-preferring regions. Difference maps of hue-specific gratings (shown in the inset) minus achromatic gratings with the same contrast (Fig. 6e,f) showed dark spot(s) in response to the hue (hue domains). These dark spots shifted in location with changing hue. The size of hue domains was 600 ± 170 μm in diameter (mean ± SD, n = 17), larger than that in V2 (370 ± 50 μm, n = 4; two-tailed t-test, P = 0.020) and similar to the size of orientation domains.
Figure 6. Functional map of hue preference in V4.

(a) Left: stimulus colors plotted on the CIE 1931-xy chromaticity diagram (dots). M, magenta; R, red; Y, yellow; G, green; C, cyan; B, blue; W, white. Right: the key for the hue-preference map. (b) Time courses of reflectance change at a sampled site (white dot in c) in response to each of six types of colored gratings and one type of achromatic gratings. Error bars represent SEM. Other conventions are as in Fig. 1b. (c,d) Large field views of color-coded polar maps of hue preference (c, case 2; d, case 3). Pixels with no significant selectivity for hue (one-way ANOVA, 6 hues, P > 0.05, uncorrected, n = 707 trials for c, n = 495 trials for d) and pixels with large cross-trial variability are shaded in black and dark gray, respectively. (e,f) Difference maps taken from the boxed region in c and d, respectively. These maps were calculated by subtracting the response to achromatic gratings from the response to each of 6 colored gratings (top to the second from the bottom). The regions with a significantly larger response to one of colored gratings than to achromatic gratings are outlined by that color in the bottom panels (two-tailed t-test, P < 0.05 and peak P < 0.0001, uncorrected, n = 231, 230, 227, 229, 231, and 225 trials in e, n = 165, 170, 167, 162, 165, and 164 trials in f, from magenta to blue, respectively). Scale bar, 1.0 mm in c,d and 0.5 mm in e,f.
To examine luminance invariance of the response of hue domains, we imaged hue domains in response to hue-specific gratings with different luminance levels (Fig. 7: case 4). In this imaging, we changed the luminance of colored strips in the gratings but left the other components unchanged (as shown in the inset). The result showed that, in response to a specific hue, the same domains were activated across different luminance levels. This suggests that within V4, there are hue domains whose response is luminance invariant. This also indicates that the mapping of these hue domains was not due to possible differences in isoluminance sensitivity between macaques and humans22.
Figure 7. Luminance invariance in responses of hue-preferring region.
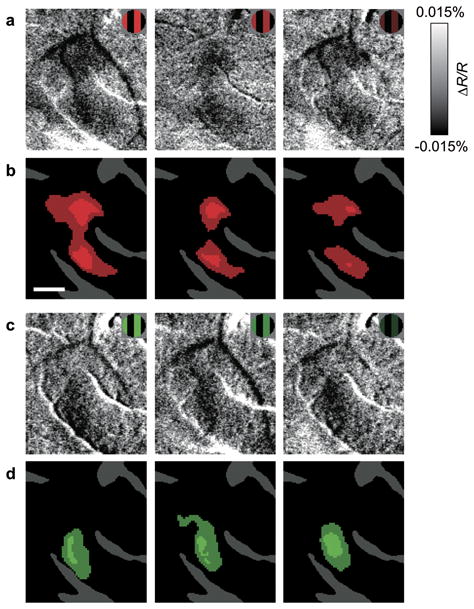
(a–c) Difference maps of red/black gratings minus achromatic gratings (Lum) obtained from a color-responsive region of parafoveal V4 (case 4) with different luminance. The luminance of red strips in gratings used was 23.1 cd/m2 in a, 15.4 cd/m2 (33.3% darker) in b, 7.69 cd/m2 (66.7% darker) in c. The luminance of white strips in Lum and background was 23.1 cd/m2 and 11.6 cd/m2, respectively. (d–f) Statistical maps show regions with a significantly larger response to red/black gratings than to Lum in a–c (colored areas, two-tailed t-test, n = 137, 137, and 138 trials for d–f, respectively). (g–i) Difference maps of green/black gratings minus Lum obtained from the same region as in a–c. The luminance profiles of gratings were the same as in a–c, respectively. (j–l) Statistical maps show regions with a significantly larger response to green/black gratings than to Lum in g–i (two-tailed t-test, n = 105, 103, and 104 trials for j–l, respectively). Scale bar, 0.5 mm.
DISCUSSION
Using optical imaging techniques, we have revealed for the first time the presence of spatially distinct distributions of orientation and color sensitivity within dorsal V4 of the macaque monkey. We showed that while most locations exhibit some activation to different stimuli, many locations exhibit preference for one stimulus over another. Not unlike ocular dominance segregation in V1 (where most cells are binocular), this provides evidence for at least some degree of cortical segregation of color and orientation representation in V4 (color and orientation bands). Our results in this study are based on hemodynamic signals that reflect neuronal activity across a local population. This method is well suited for revealing local biases in representation at the columnar level, a level that is not easily detected by functional magnetic resonance imaging (fMRI) methods and, furthermore, may be missed by electrophysiological methods. It is important to emphasize that we do not suggest complete segregation of color and orientation representation at a cellular level in V4. The idea of cortical segregation of visual feature representation at early visual stages was originally proposed based on findings from anatomy and physiology23. However, many studies have shown that feature information is mixed at a cellular level and anatomical pathways are more intermingled than originally proposed5. It is likely that each of the color and orientation bands we found in V4 includes some population of neurons responding to both types of visual feature or a mixture of neurons responding to either feature. However, on average, the local population response is biased towards features of color or of orientation selectivity.
We also suggest that these feature domains do not simply represent ‘color’ and ‘orientation’. Given the known complex visual response properties in V4, such as selectivity for non-Cartesian (polar and hyperbolic) gratings24, curved and angled contours25, and combinations of color and shape26, it is likely that these domains are regions of higher order color and higher order orientation processes. We speculate that the compartmentalization shown here may reflect a grouping of neurons processing complex visual features that share simple features as parts (e.g. curved contours of opposite sign or different shapes with the same color).
Our findings help clarify some of the controversies and confusion regarding V4. Early on, V4 was characterized as a color area, but then later this view was modified as numerous studies failed to find a predominance of color cells. However, at least in the exposed foveal portion of V4, our data serve to revive an early electrophysiological report27 that revealed a predominance of color selective responses in the anterior bank of lunate sulcus (V4 proper), as compared with the prelunate gyrus (V4A). Recently, an fMRI study28 showed that there are several color-biased loci (globs) in the macaque cortex, one of which is located in the anterior bank of lunate sulcus. In addition, single-unit recording revealed that almost all cells recorded in these globs showed strong color tuning and orientation-sensitive cells were found more in the interglob28. This supports the presence of color and orientation bands in V4. As well, our findings also agree with neuroanatomical studies showing differential connectivity between anterior and posterior portions of V429,30. However, the organization of color versus orientation representation in V4 might be more complex than simple subdivision along the anteroposterior axis. Some of our results (Fig. 2m and Fig. 4) suggest that V4 consists of multiple, alternating, band-like structures for color and orientation. Such band-like organization was also found in the pattern of afferent connections from V2 thin stripes and pale stripes31. In V3, it was demonstrated that there are two types of functional compartments: zones with high cytochrome-oxidase (CO) reactivity and high orientation selectivity and others with low CO reactivity and low orientation selectivity32. Many of the disagreements regarding the areal boundaries, topography, and functional focus of V430 needs to be reviewed given this new understanding regarding functional organization in V4.
Our data also support the presence of multiple retinotopic maps within V4. Stimuli located at single visual locations activate multiple foci within V4, which fall within both color and orientation bands, in line with some previous suggestions regarding the presence of several retinotopic subdivisions within V433,34. Thus, at a macroscopic scale, the visual field is represented smoothly within V4, as shown in electrophysiological mapping and fMRI studies15,35. However, at a finer scale, we propose the presence of multiple, interleaved retinotopic maps and the presence of discontinuities in retinotopic progression between different functional compartments, similar to that previously described in V1 across ocular dominance columns36 and in V2 across the thin, pale, and thick stripes16.
Why have past studies failed to observe these patterns of color- and orientation-sensitive regions in V4? Although difficult to visualize with the 2-deoxyglucose (2-DG) technique37, some orientation selective domains in V4 have been visualized in the foveal portion (<3°) of V4 by optical imaging in anesthetized monkeys10. With both 2-DG technique38 and with fMRI28 methods, color-preferring cortical regions were observed across many visual areas. However, V4 activation in these studies was relatively weak. The difficulty in observing robust functional domain responses in V4 is perhaps due to factors related to limitations of spatial resolution, anesthesia and/or the large size of full field stimuli, something which is likely to result in significant surround suppression in V439. Indeed, our own data reveal significant size-related attenuation of optical signal, particularly in color response (Supplementary Fig. 3). Consistent with this, a more recent fMRI study40, in which relatively small stimuli (6–10 deg) were used, revealed abundant color-selective activation in macaque V4.
We predict that this study will impact studies of visual attention in V4 in two important ways. First, these images are obtained from the foveal region of V4. This region of V4 is an area that is virtually unstudied, despite the fact that in natural vision, attention is almost always directed to the fovea. This approach thus opens the doors to new sets of questions regarding the neural basis of foveal visual attention. Second, this study will strongly impact our thinking regarding the functional organizational basis of spatial and featural attention and, furthermore, the specificity of prefrontal influences on these organizations41. The ability to image functional organizations in higher visual areas of awake, behaving monkeys opens doors to understanding how functional domain activations are modulated by behavioral context42–44.
METHODS
Methods and any associated references are available in the online version of the paper at http://www.nature.com/natureneuroscience/.
Supplementary Material
Acknowledgments
We thank J. H. Kaas and G. Chen for comments on the manuscript; Y. Chu for technical assistance. This work was supported by grants from the National Institutes of Health, Vanderbilt Vision Research Center, and Vanderbilt University Center for Integrative & Cognitive Neuroscience to A.W.R.
Footnotes
Note: Supplementary information is available on the Nature Neuroscience website.
Author Contributions
H.T. and A.W.R. designed the experiments. H.T. performed the experiments, and analyzed the data. H.L assisted H.T. with experimental procedures. H.T and A.W.R. discussed the results and wrote the paper.
References
- 1.Livingstone MS, Hubel DH. Anatomy and physiology of a color system in the primate visual cortex. J Neurosci. 1984;4:309–356. doi: 10.1523/JNEUROSCI.04-01-00309.1984. [DOI] [PMC free article] [PubMed] [Google Scholar]
- 2.Hubel DH, Livingstone MS. Segregation of form, color, and stereopsis in primate area 18. J Neurosci. 1987;7:3378–3415. doi: 10.1523/JNEUROSCI.07-11-03378.1987. [DOI] [PMC free article] [PubMed] [Google Scholar]
- 3.Leventhal AG, Thompson KG, Liu D, Zhou Y, Ault SJ. Concomitant sensitivity to orientation, direction, and color of cells in layers 2, 3, and 4 of monkey striate cortex. J Neurosci. 1995;15:1808–1818. doi: 10.1523/JNEUROSCI.15-03-01808.1995. [DOI] [PMC free article] [PubMed] [Google Scholar]
- 4.Levitt JB, Kiper DC, Movshon JA. Receptive field and functional architecture of macaque V2. J Neurophysiol. 1994;71:2517–2542. doi: 10.1152/jn.1994.71.6.2517. [DOI] [PubMed] [Google Scholar]
- 5.Sincich LC, Horton JC. The circuitry of V1 and V2: integration of color, form, and motion. Annu Rev Neurosci. 2005;28:303–326. doi: 10.1146/annurev.neuro.28.061604.135731. [DOI] [PubMed] [Google Scholar]
- 6.Zeki SM. Colour coding in rhesus monkey prestriate cortex. Brain Res. 1973;53:422–427. doi: 10.1016/0006-8993(73)90227-8. [DOI] [PubMed] [Google Scholar]
- 7.Kruger J, Gouras P. Spectral selectivity of cells and its dependence on slit length in monkey visual cortex. J Neurophysiol. 1980;43:1055–1069. doi: 10.1152/jn.1980.43.4.1055. [DOI] [PubMed] [Google Scholar]
- 8.Schein SJ, Marrocco RT, de Monasterio FM. Is there a high concentration of color-selective cells in area V4 of monkey visual cortex? J Neurophysiol. 1982;47:193–213. doi: 10.1152/jn.1982.47.2.193. [DOI] [PubMed] [Google Scholar]
- 9.Tanaka M, Weber H, Creutzfeldt OD. Visual properties and spatial distribution of neurones in the visual association area on the prelunate gyrus of the awake monkey. Exp Brain Res. 1986;65:11–37. doi: 10.1007/BF00243827. [DOI] [PubMed] [Google Scholar]
- 10.Ghose GM, Ts’o DY. Form processing modules in primate area V4. J Neurophysiol. 1997;77:2191–2196. doi: 10.1152/jn.1997.77.4.2191. [DOI] [PubMed] [Google Scholar]
- 11.Maunsell JH, Treue S. Feature-based attention in visual cortex. Trends Neurosci. 2006;29:317–322. doi: 10.1016/j.tins.2006.04.001. [DOI] [PubMed] [Google Scholar]
- 12.Xiao Y, Wang Y, Felleman DJ. A spatially organized representation of colour in macaque cortical area V2. Nature. 2003;421:535–539. doi: 10.1038/nature01372. [DOI] [PubMed] [Google Scholar]
- 13.Vanzetta I, Slovin H, Omer DB, Grinvald A. Columnar resolution of blood volume and oximetry functional maps in the behaving monkey; implications for fMRI. Neuron. 2004;42:843–854. doi: 10.1016/j.neuron.2004.04.004. [DOI] [PubMed] [Google Scholar]
- 14.Lu HD, Roe AW. Functional organization of color domains in V1 and V2 of macaque monkey revealed by optical imaging. Cereb Cortex. 2008;18:516–533. doi: 10.1093/cercor/bhm081. [DOI] [PMC free article] [PubMed] [Google Scholar]
- 15.Gattass R, Sousa AP, Gross CG. Visuotopic organization and extent of V3 and V4 of the macaque. J Neurosci. 1988;8:1831–1845. doi: 10.1523/JNEUROSCI.08-06-01831.1988. [DOI] [PMC free article] [PubMed] [Google Scholar]
- 16.Roe AW, Ts’o DY. Visual topography in primate V2: multiple representation across functional stripes. J Neurosci. 1995;15:3689–3715. doi: 10.1523/JNEUROSCI.15-05-03689.1995. [DOI] [PMC free article] [PubMed] [Google Scholar]
- 17.Hubel DH, Wiesel TN. Sequence regularity and geometry of orientation columns in the monkey striate cortex. J Comp Neurol. 1974;158:267–293. doi: 10.1002/cne.901580304. [DOI] [PubMed] [Google Scholar]
- 18.Bonhoeffer T, Grinvald A. Iso-orientation domains in cat visual cortex are arranged in pinwheel-like patterns. Nature. 1991;353:429–431. doi: 10.1038/353429a0. [DOI] [PubMed] [Google Scholar]
- 19.Xiao Y, Casti A, Xiao J, Kaplan E. Hue maps in primate striate cortex. Neuroimage. 2007;35:771–786. doi: 10.1016/j.neuroimage.2006.11.059. [DOI] [PMC free article] [PubMed] [Google Scholar]
- 20.Kotake Y, Morimoto H, Okazaki Y, Fujita I, Tamura H. Organization of color-selective neurons in macaque visual area V4. J Neurophysiol. 2009;102:15–27. doi: 10.1152/jn.90624.2008. [DOI] [PubMed] [Google Scholar]
- 21.Wang Y, Xiao Y, Felleman DJ. V2 thin stripes contain spatially organized representations of achromatic luminance change. Cereb Cortex. 2007;17:116–129. doi: 10.1093/cercor/bhj131. [DOI] [PubMed] [Google Scholar]
- 22.Dobkins KR, Thiele A, Albright TD. Comparison of red-green equiluminance points in humans and macaques: evidence for different L:M cone ratios between species. J Opt Soc Am A Opt Image Sci Vis. 2000;17:545–556. doi: 10.1364/josaa.17.000545. [DOI] [PubMed] [Google Scholar]
- 23.Livingstone M, Hubel D. Segregation of form, color, movement, and depth: anatomy, physiology, and perception. Science. 1988;240:740–749. doi: 10.1126/science.3283936. [DOI] [PubMed] [Google Scholar]
- 24.Gallant JL, Braun J, Van Essen DC. Selectivity for polar, hyperbolic, and Cartesian gratings in macaque visual cortex. Science. 1993;259:100–103. doi: 10.1126/science.8418487. [DOI] [PubMed] [Google Scholar]
- 25.Pasupathy A, Connor CE. Responses to contour features in macaque area V4. J Neurophysiol. 1999;82:2490–2502. doi: 10.1152/jn.1999.82.5.2490. [DOI] [PubMed] [Google Scholar]
- 26.Kobatake E, Tanaka K. Neuronal selectivities to complex object features in the ventral visual pathway of the macaque cerebral cortex. J Neurophysiol. 1994;71:856–867. doi: 10.1152/jn.1994.71.3.856. [DOI] [PubMed] [Google Scholar]
- 27.Zeki S. The distribution of wavelength and orientation selective cells in different areas of monkey visual cortex. Proc R Soc Lond B Biol Sci. 1983;217:449–470. doi: 10.1098/rspb.1983.0020. [DOI] [PubMed] [Google Scholar]
- 28.Conway BR, Moeller S, Tsao DY. Specialized color modules in macaque extrastriate cortex. Neuron. 2007;56:560–573. doi: 10.1016/j.neuron.2007.10.008. [DOI] [PMC free article] [PubMed] [Google Scholar]
- 29.Zeki SM. Cortical projections from two prestriate areas in the monkey. Brain Res. 1971;34:19–35. doi: 10.1016/0006-8993(71)90348-9. [DOI] [PubMed] [Google Scholar]
- 30.Stepniewska I, Collins CE, Kaas JH. Reappraisal of DL/V4 boundaries based on connectivity patterns of dorsolateral visual cortex in macaques. Cereb Cortex. 2005;15:809–822. doi: 10.1093/cercor/bhh182. [DOI] [PubMed] [Google Scholar]
- 31.Xiao Y, Zych A, Felleman DJ. Segregation and convergence of functionally defined V2 thin stripe and interstripe compartment projections to area V4 of macaques. Cereb Cortex. 1999;9:792–804. doi: 10.1093/cercor/9.8.792. [DOI] [PubMed] [Google Scholar]
- 32.Xu X, et al. Functional organization of visual cortex in the owl monkey. J Neurosci. 2004;24:6237–6247. doi: 10.1523/JNEUROSCI.1144-04.2004. [DOI] [PMC free article] [PubMed] [Google Scholar]
- 33.Van Essen DC, Zeki SM. The topographic organization of rhesus monkey prestriate cortex. J Physiol. 1978;277:193–226. doi: 10.1113/jphysiol.1978.sp012269. [DOI] [PMC free article] [PubMed] [Google Scholar]
- 34.Maguire WM, Baizer JS. Visuotopic organization of the prelunate gyrus in rhesus monkey. J Neurosci. 1984;4:1690–1704. doi: 10.1523/JNEUROSCI.04-07-01690.1984. [DOI] [PMC free article] [PubMed] [Google Scholar]
- 35.Fize D, et al. The retinotopic organization of primate dorsal V4 and surrounding areas: A functional magnetic resonance imaging study in awake monkeys. J Neurosci. 2003;23:7395–7406. doi: 10.1523/JNEUROSCI.23-19-07395.2003. [DOI] [PMC free article] [PubMed] [Google Scholar]
- 36.Hubel DH, Wiesel TN. Functional architecture of macaque monkey visual cortex. Proc R Soc Lond B Biol Sci. 1977;198:1–59. doi: 10.1098/rspb.1977.0085. [DOI] [PubMed] [Google Scholar]
- 37.Vanduffel W, Tootell RB, Schoups AA, Orban GA. The organization of orientation selectivity throughout macaque visual cortex. Cereb Cortex. 2002;12:647–662. doi: 10.1093/cercor/12.6.647. [DOI] [PubMed] [Google Scholar]
- 38.Tootell RB, Nelissen K, Vanduffel W, Orban GA. Search for color ‘center(s)’ in macaque visual cortex. Cereb Cortex. 2004;14:353–363. doi: 10.1093/cercor/bhh001. [DOI] [PubMed] [Google Scholar]
- 39.Desimone R, Schein SJ. Visual properties of neurons in area V4 of the macaque: sensitivity to stimulus form. J Neurophysiol. 1987;57:835–868. doi: 10.1152/jn.1987.57.3.835. [DOI] [PubMed] [Google Scholar]
- 40.Harada T, et al. Distribution of colour-selective activity in the monkey inferior temporal cortex revealed by functional magnetic resonance imaging. Eur J Neurosci. 2009;30:1960–1970. doi: 10.1111/j.1460-9568.2009.06995.x. [DOI] [PubMed] [Google Scholar]
- 41.Moore T, Armstrong KM. Selective gating of visual signals by microstimulation of frontal cortex. Nature. 2003;421:370–373. doi: 10.1038/nature01341. [DOI] [PubMed] [Google Scholar]
- 42.Hayden BY, Gallant JL. Time course of attention reveals different mechanisms for spatial and feature-based attention in area V4. Neuron. 2005;47:637–643. doi: 10.1016/j.neuron.2005.07.020. [DOI] [PubMed] [Google Scholar]
- 43.Koida K, Komatsu H. Effects of task demands on the responses of color-selective neurons in the inferior temporal cortex. Nat Neurosci. 2007;10:108–116. doi: 10.1038/nn1823. [DOI] [PubMed] [Google Scholar]
- 44.Tanigawa H, Roe AW. Attentional modulation in macaque area V4 revealed by optical imaging. Soc Neurosci Abstr. 2008;34:317.314. [Google Scholar]
Associated Data
This section collects any data citations, data availability statements, or supplementary materials included in this article.