

Abstract
Operant conditioning of the spinal stretch reflex or its electrical analog, the H-reflex, produces spinal cord plasticity and can thereby affect motoneuron responses to primary afferent input. To explore whether this conditioning can affect the functional outcome after peripheral nerve injury, we assessed the effect of up-conditioning soleus (SOL) H-reflex on SOL and tibialis anterior (TA) function after sciatic nerve transection and repair. Sprague Dawley rats were implanted with EMG electrodes in SOL and TA and stimulating cuffs on the posterior tibial nerve. After control data collection, the sciatic nerve was transected and repaired and the rat was exposed for 120 d to continued control data collection (TC rats) or SOL H-reflex up-conditioning (TU rats). At the end of data collection, motoneurons that had reinnervated SOL and TA were labeled retrogradely. Putative primary afferent terminals [i.e., terminals containing vesicular glutamate transporter-1 (VGLUT1)] on SOL motoneurons were studied immunohistochemically. SOL (and probably TA) background EMG activity recovered faster in TU rats than in TC rats, and the final recovered SOL H-reflex was significantly larger in TU than in TC rats. TU and TC rats had significantly fewer labeled motoneurons and higher proportions of double-labeled motoneurons than untransected rats. VGLUT1 terminals were significantly more numerous on SOL motoneurons of TU than TC rats. Combined with the larger H-reflexes in TU rats, this anatomical finding supports the hypothesis that SOL H-reflex up-conditioning strengthened primary afferent reinnervation of SOL motoneurons. These results suggest that H-reflex up-conditioning may improve functional recovery after nerve injury and repair.
Introduction
Peripheral nerve injuries are relatively common, and poor functional recovery remains an important clinical problem. Regenerating axons often fail to reinnervate their appropriate targets, and many of them reach functionally inappropriate targets (Brushart and Mesulam, 1980; Koerber et al., 1989; Brushart, 1991; English, 2005). Therefore, new methods for enhancing axon regeneration to appropriate targets and reducing inappropriate reinnervation may improve functional outcomes after peripheral nerve injury.
Targeted activity in peripheral nerves or the spinal cord, such as that produced by direct peripheral stimulation or treadmill exercise, can enhance axonal regeneration (Al-Majed et al., 2000; Sabatier et al., 2008). The present study asks whether activity induced in descending spinal cord pathways by a simple operant conditioning paradigm can also promote regeneration so as to improve functional recovery. Its general rationale derives from the extensive clinical and experimental evidence that descending activity shapes spinal cord function during development and later life (for review, see Wolpaw and Tennissen, 2001; Wolpaw, 2006a).
More specifically, this study is motivated by the fact that operant conditioning of the spinal stretch reflex or its electrical analog, the H-reflex, can produce plasticity at multiple spinal cord sites and can thereby affect motoneuron responses to primary afferent input. This plasticity results from corticospinal tract activity induced by the conditioning paradigm (see Wolpaw, 2006b; Wolpaw and Chen, 2009, for review of spinal reflex conditioning). Furthermore, recent studies indicate that up-conditioning of the H-reflex can strengthen motoneuron responses to primary afferent input during locomotion and improve locomotion in rats after a spinal cord injury (Chen et al., 2005; Y. Chen et al., 2006). The aim of the present study was to test the hypothesis that H-reflex conditioning can enhance the strength and/or specificity of reinnervated neuromuscular connections so as to improve the functional outcome after peripheral nerve injury and repair.
To test this hypothesis, the present study assessed physiologically and anatomically the effects of soleus (SOL) H-reflex up-conditioning on the recovery of SOL and tibialis anterior (TA) EMG activity and reflexes after sciatic nerve transection and repair. EMG activity and reflexes were followed for 120 d after transection, during which rats were or were not exposed to a standard H-reflex up-conditioning protocol. In addition, we measured the impact of up-conditioning on the loss of primary afferent terminals onto motoneurons that is produced by peripheral nerve transection (Alvarez et al., 2010). Based on both the physiological and the anatomical findings, we suggest that H-reflex up-conditioning may provide a useful new approach to promoting functional recovery after peripheral nerve injury.
Materials and Methods
Subjects were 13 young male Sprague Dawley rats weighing 347 g (±39 g SD) at the beginning of the study. All procedures satisfied the “Guide for the Care and Use of Laboratory Animals” of the Institute of Laboratory Animal Resources, Commission on Life Sciences, National Research Council (National Academy Press, Washington, D.C., 1996), and had been reviewed and approved by the Institutional Animal Care and Use Committees of the Wadsworth Center. The protocols for implantation of the nerve stimulating cuff and EMG recording electrodes, for M response and H-reflex elicitation, for chronic monitoring and conditioning of the SOL H-reflex in freely moving rats, for sciatic nerve transection and repair, and for motoneuron labeling, animal perfusion, and tissue preparation have been described in detail previously (Wolpaw et al., 1993; Chen and Wolpaw, 1995, 1997, 2002, 2005; Chen et al., 2003, 2005; English, 2005; X. Y. Chen et al., 2006; Y. Chen et al., 2006; Wang et al., 2006, 2009; Wolpaw and Chen, 2006; English et al., 2007; Pillai et al., 2008) and are summarized here. Additional procedures for labeling and analyzing vesicular glutamate transporter 1-positive (VGLUT1) terminals (i.e., putative primary afferent terminals) (Todd et al., 2003; Alvarez et al., 2004; Wu et al., 2004) are described in detail.
Electrode implantation and sciatic nerve transection and repair.
Under general anesthesia (sodium pentobarbital, 60 mg/kg, i.p., supplemented as needed) and aseptic conditions, each rat was implanted with chronic stimulating and recording electrodes in the right leg. To elicit the SOL H-reflex, a silicone rubber nerve cuff containing a pair of stainless steel multistranded fine wire electrodes was placed on the right posterior tibial (PT) nerve (just above the triceps surae branches). To record right SOL and TA EMG activity, a pair of multistranded stainless steel fine wires (with final 0.5 cm exposed) was implanted in each muscle. The Teflon-coated wires from the muscles and the nerve cuff passed subcutaneously to a connector secured to the skull with stainless steel screws and dental cement. After 7–20 d of control data collection (which started at least 20 d after the implantation surgery) (Fig. 1), each rat underwent a second surgery in which the right sciatic nerve was transected and repaired as described by English et al. (2007). Briefly, under general anesthesia and aseptic conditions, the sciatic nerve was exposed proximal to the branching of the sural nerve and cut completely with sharp scissors. The distal stump was immediately aligned with the proximal stump using surface landmarks such as blood vessels and connective tissues as a guide, and the two stumps were then glued together with fibrin glue (English, 2005; English et al., 2007).
Figure 1.

Experimental design. Each rat was implanted with pairs of fine-wire EMG electrodes in the right SOL and right TA muscles and a stimulating cuff on the PT nerve. After control data collection, the right sciatic nerve was transected and repaired, and the rat was exposed for an additional 120 d to either continued control data collection or to SOL H-reflex up-conditioning.
After each surgery, the rat was placed under a heating lamp and given an analgesic (Demerol, 0.2 mg, i.m.). Once awake, it received a second dose of analgesic and was returned to its cage. A high calorie dietary supplement was given until body weight regained its presurgery level. Each rat also received a piece of apple (∼10 g) every day throughout study.
Data collection and H-reflex conditioning.
The experimental design for the study is shown in Figure 1. Electrophysiological data collection began at least 20 d after the implantation surgery and continued 24 h/d, 7 d/week for ∼140 d. During this period, each rat lived in a standard rat cage with a 40 cm flexible cable attached to the skull plug. The cable, which allowed the animal to move freely in the cage, conveyed the wires from the electrodes to a commutator above the cage, and from there to EMG amplifiers (gain 1000, bandwidth 100–1000 Hz) and a stimulus isolation unit. The rat had free access to water and food, except that during H-reflex conditioning they received food mainly by performing the task described below. Animal well being was carefully checked several times each day, and body weight was measured weekly. Laboratory lights were dimmed from 9:00 P.M. to 6:00 A.M. each day.
Stimulus delivery and data collection were under the control of a computer system, which monitored ongoing EMG activity (filtered at 100–1000 Hz, sampled at 5000 Hz) from the SOL and TA muscles continuously 24 h/d, 7 d/week, for the entire period of data collection. Whenever the absolute value (equivalent to the full wave rectified value) of SOL background (i.e., ongoing) EMG activity remained within defined ranges for a randomly varying 2.3–2.7 s period, the computer initiated a trial. In each trial, the computer stored the most recent 50 ms of EMG activity from both muscles (i.e., the background EMG interval), delivered a monophasic stimulus pulse to the nerve cuff, and stored the EMG activity for another 100 ms. Stimulus pulse amplitude and duration were initially set to produce a maximum H-reflex (as well as an M response that was typically just above threshold). Pulse duration remained fixed (usually 0.5 ms). Pulse amplitude was adjusted by the computer after each trial to maintain the SOL M response [i.e., average amplitude of EMG activity in the M-response interval (typically 2.0–4.5 ms after PT nerve stimulation)] unchanged at a target size. [This ensured that the effective strength of the nerve stimulus was stable throughout the experiment despite any changes that occurred in nerve cuff electrode impedances or in other factors (Wolpaw, 1987; Chen and Wolpaw, 1995).] During the period after the nerve transection and before the M response had fully recovered, the stimulus was permitted to rise to 2.5 times the average pretransection pulse amplitude (i.e., average pulse amplitude in the final 7 d before the nerve transection), or to the level that gave the target M-response size, whichever was lower. H-reflex size was defined as average amplitude of EMG activity in the H-reflex interval (typically 6–10 ms after PT nerve stimulation) minus average background EMG amplitude.
Under the control mode, the computer simply digitized and stored the absolute value of SOL EMG activity for 100 ms following the stimulus. Under the up-conditioning mode, it gave a reward (i.e., a food pellet) 200 ms after PT nerve stimulation if SOL EMG activity in the H-reflex interval was above a criterion value. The criterion value was set and adjusted as needed each day, so that the rat received an adequate amount of food (e.g., ∼1000 reward pellets per day for a 500 g rat). Each rat was first studied under the control mode for 7–20 d. The data for the final 7 d of this period were averaged to provide the initial values for trials/d, for SOL and TA background EMG activity, and for responses to PT nerve stimulation. The rat then underwent sciatic nerve transection and repair. Following this surgery, data collection continued for 120 more days. During this 120 d period, the 5 transected/control (TC) rats simply continued under the control mode. In contrast, the 8 transected/up-conditioned (TU) rats continued under the control mode for a relatively brief period [19 d (4 rats), 18 d (2 rats), or 2 d (2 rats)] and were then exposed to the up-conditioning mode for the remaining 101–118 d.
Anatomical studies.
At the end of data collection, the rat was anesthetized and injected in the right SOL muscle with cholera toxin subunit B-conjugated Alexa Fluor 488 (CTB-Fluor 488; Invitrogen) and in the right TA muscle with cholera toxin subunit B-conjugated Alexa Fluor 594 (CTB-Fluor 594; Invitrogen) for retrograde labeling of SOL and TA motoneurons, respectively. Each injection was done with a 100 μl Hamilton syringe with a 33-gauge needle. Briefly, the SOL and TA muscles were exposed. Under a dissection microscope, the needle was inserted near the distal tendon of each muscle and advanced carefully to the middle of the muscle. The dye (50 μg in 50 μl of distilled water) was injected at three points near the middle of each muscle. Injection was very slow (over 3 min) to prevent leakage along the needle track. After each injection, the needle was left in situ for 2–3 min and then slowly withdrawn. Each injection area was rinsed thoroughly with saline for 5 min to remove any leakage before the wound was sutured. Four untransected naive control rats (NT rats) of comparable weight were also anesthetized and injected with tracers as described above.
Three days later, each rat received an overdose of sodium pentobarbital (intraperitoneally) and was perfused through the heart with saline followed by 4% paraformaldehyde in 0.1 m phosphate buffer, pH 7.3. The EMG electrodes, nerve cuff, and PT nerve were examined and the SOL muscles of both sides were removed and weighed.
The lumbosacral spinal cord was removed and postfixed in the same fixative for 2 h, washed with 0.05 m phosphate buffer containing 137 mm NaCl (PBS, pH 7.4), and infiltrated with 30% sucrose for 24 h. The portion of the spinal cord containing SOL and TA motoneuron pools was blocked, embedded in OCT compound (Tissue-Tek), and frozen on dry ice. Transverse 16 μm frozen sections were cut with a cryostat, mounted onto precoated glass slides (Superfrost; Thermo Fisher), and examined under fluorescence microscopy. All labeled motoneurons were photographed with 590 nm or 494 nm wavelength light to show CTB-Fluo594 or CTB-Fluo488 labeling, respectively, and were merged to identify TA (red), SOL (green), or double-labeled (yellow) motoneurons (Fig. 2). The CTB-Fluor 488- and/or CTB-Fluor 594-labeled motoneurons of TU and TC rats were identified, counted, measured, and compared with those of NT rats. The slides were then stored in a low-temperature freezer (−80°C) before further immunohistochemical processing.
Figure 2.

Motoneuron identification. Photomicrographs showing motoneurons labeled by CTB-Fluo594 only (red) (i.e., TA motoneurons), CTB-Fluo488 only (green) (i.e., SOL motoneurons), or both CTB-Fluo594 and CTB-Fluo488 (yellow) from a TU rat. The photomicrographs were taken with 590 nm (top left) or 494 nm (top right) wavelength light to show CTB-Fluo594 or CTB-Fluo488 labeling, respectively (white arrows), and were merged (bottom) to identify SOL (green arrow), TA (red arrow), or double-labeled (yellow arrow) motoneurons. Scale bar, 250 μm.
Synaptic boutons immunoreactive for VGLUT1 were analyzed in SOL motoneurons (i.e., motoneurons labeled with CTB-Fluor 488 and not labeled with CTB-Fluor 594) using a standard avidin-biotin complex (ABC)-peroxidase system (ABC Elite; Vector Laboratories). In each rat, every seventh section was selected for processing and analysis if it contained at least one labeled CTB-Fluor488-labeled SOL motoneuron. [In these VGLUT-1 labeled sections, the CTB-Fluor488-labeled SOL motoneurons were identified by matching them to their CTB-Fluor488-labeled images using location, somatic features, and other landmarks as described by Wang et al. (2006) and Pillai et al. (2008).] Sections from all three groups of rats (i.e., TU, TC, and NT) were processed together. The sections were washed in 0.05 m PBS containing 0.1% Triton X-100 (PBST, pH 7.4) three times (10 min each), incubated for 90 min with 5%-normal goat serum, and then incubated for 18–20 h in a humid chamber at room temperature in PBST containing 3% bovine serum albumin with rabbit anti-VGLUT1 (Synaptic Systems, 1:1000 dilution) as the primary antibody. The sections were again washed with PBST, and a biotinylated secondary antibody (goat anti-rabbit, 1:200 in PBS) was applied for 1.5 h. After endogenous peroxidase activity was quenched by 0.3% H2O2 for 15 min, the sections were reacted for 1.5 h with the avidin-biotin complex (1:100 in PBS). The sections were washed with 0.05 m Tris-HCl buffer (TBS, pH 7.6) before color development. Finally, the sections were reacted with 0.04% DAB solution containing 0.006% H2O2 for 7 min to optimize the signal-to-noise ratio.
In the VGLUT-1 labeled sections, we analyzed VGLUT1-positive terminals on SOL motoneurons (i.e., motoneurons labeled with CTB-Fluor 488 and not labeled with CTB-Fluor 594) by comparing with their images of CTB-labeled sections (Fig. 3A,B). In these sections, SOL motoneurons were identified by matching them to their CTB-Fluor488-labeled images using location, somatic features, and other landmarks as described previously (Wang et al., 2006; Pillai et al., 2008). Analysis was confined to those SOL motoneurons in which a nuclear shadow was observed and a clearly defined somatic border was evident. Approximately 70% of the CTB-Fluor488-labeled SOL motoneurons in these sections satisfied these criteria and were included for analysis.
Figure 3.

VGLUT1-positive terminals on SOL motoneurons. A, An Alexa Fluor-488-labeled SOL motoneuron in the ventral horn (dotted line) of the lumbar spinal cord from an NT rat. B–D, Higher-magnification pictures from an NT rat (the same motoneuron shown in A) (B), a TU rat (C), and a TC rat (D) showing VGLUT1 terminals (arrows). The motoneuron of the TC rat has fewer VGLUT1 terminals than that of either the NT or the TU rat. Scale bars: (in A), 200 μm; (in B), 20 μm (B–D).
The images of these SOL motoneurons were photographed with a digital camera [Olympus BH2-RFCA microscope, 500× magnification, fixed illumination, equipped with an Olympus Magnafire SP IKHO27801 digital camera (magnification 10×, standard illumination)]. The ImageJ program (NIH, version 1.39o) was used to trace the perimeter of each motoneuron. The program then calculated the average luminance of the motoneuron soma. The intensity of VGLUT1-immunoreactivity (VGLUT1-IR) was defined in percentage luminance, with the luminance of a totally clear slide defined as 0% and the luminance of a totally opaque slide defined as 100%. Terminals were defined morphologically as VGLUT1-positive punctate (i.e., bead-like) densities on the perimeter of the motoneuron somata and proximal dendrites (Fig. 3B–D). These terminal identifications were confirmed only if their average luminance value exceeded the average luminance value measured over the motoneuron soma by at least 30% (e.g., if the luminance value of the motoneuron was 40%, the luminance value of each identified terminal on it was at least 70%). The perimeter of each confirmed VGLUT1-positive terminal on each SOL motoneuron was traced at 10,000× with the image J program. The program calculated the number, area, diameter (Feret's diameter, the long axis of the terminal), and intensity (i.e., luminance) of all VGLUT1-positive terminals on the SOL motoneuron somata and proximal dendrites. All terminal identifications and measurements were done independently in a double-blind manner by two raters, neither of whom knew which rat group a particular section came from. Their results were then compared, and their rare discrepancies in identification (<3% of the terminals) were resolved by discussion before breaking the code that linked the section to a particular rat and group.
Results
Animals remained healthy and active throughout data collection. Body weight increased from 331 g (±14 g) at the time of implantation surgery to 397 g (±56 g) at the time of nerve transection and 614 g (±60 g) at the time of perfusion. In all rats, on postmortem examination, the cuff was still located where it had been implanted and was covered by connective tissue, and the PT nerve was well preserved inside the cuff. As previously reported (English et al., 2007), there was a significant difference in SOL muscle weights between the right (the sciatic-transected) leg and the left (the intact) leg. The right SOL muscle averaged 0.19 g (±0.04 g SD), and was significantly (p < 0.001 by paired t test) smaller than that of the left, which averaged 0.25 g (±0.04 g).
Daily trial number
In the course of its normal daily activity before nerve transection, each rat satisfied the background EMG requirement, received nerve cuff stimulation, and produced several thousand H-reflex trials per day. Before the nerve transection, daily trial number averaged 5420 (±2998 SD) (range, 2300–9336) for TC rats, and 5650 (±2376 SD) (range, 3400–10,178) for TU rats (p = 0.87). In Figure 4 the average daily trial numbers (in percentage of pretransection value) for 120 d following the nerve transection for TC (circles) and TU (up-triangles) rats are shown. The trial number varied from day to day. While TU rats appeared to have more average daily trial numbers in some periods, no statistically significant difference was detected by ANOVA. Thus, TC and TU rats were exposed to similar amounts of electrical stimulation of the distal segment of the PT nerve.
Figure 4.

Average (±SEM) daily trial number (in percentage of average pretransection value) for 120 d following sciatic nerve transection and repair for the five TC (circles) and eight TU rats (triangles). While TU rats appear to have somewhat more trials, particularly from 60 to 110 d after transection, no significant difference was detected by ANOVA.
Background EMG activity
Background EMG activity in both SOL and TA dropped dramatically after sciatic nerve transection and repair. This activity gradually recovered to close to pretransection levels over the first 40–60 d following nerve injury. In Figure 5A, the average (±SEM) daily SOL background EMG activity (in percentage of pretransection value) is shown for the TC (circles) and TU rats (up-triangles) for the final 7 d before and the 120 d following nerve transection. Activity in SOL in both groups dropped immediately after transection, reached its lowest level in 3–4 d, then gradually rose to ∼80% of pretransection level, and remained there. No further recovery occurred in either TC or TU rats during the 120 d post-transection data-collection period. However, TU rats reached this final level by ∼50 d after transection while TC rats did not reach it until ∼75 d after transection. ANOVA was applied to 20 d blocks of these data. The TU rats had significantly higher SOL background EMG activity than TC rats for days 21–40 and 41–60 (p < 0.05 for each) (Fig. 5A, shaded area).
Figure 5.

A, Average (±SEM) daily SOL background EMG [in percentage of pretransection (pre-TX) value (i.e., average of final 7 d before the sciatic nerve transection)] for the five TC (black circles) and eight TU (gray triangles) rats for 7 d before and 120 d after transection. The difference between TC and TU groups was significant (p < 0.05, ANOVA) for days 21–40 and 41–60 (shaded area). B, Average (±SEM) daily TA background EMG (in percentage of pretransection value) for 4 TC (black circles) and 6 TU (gray triangles) rats for 7 d before and 120 d after nerve transection. No significant difference was detected.
Average (±SEM) daily background EMG activity in TA (as a percentage of pretransection value) is shown in Figure 5B for the four TC (circles) and six TU (up-triangles) rats in which TA activity was monitored from 7 d before to 120 d after nerve transection. (In one TC and two TU rats, the TA EMG electrodes failed 25–50 d after nerve transection, and thus TA data from these rats are not included.) In both TC and TU rats, background EMG activity in TA decreased immediately after nerve transection, reached its lowest level in 4–5 d, gradually rose to nearly 80% of its pretransection level, and remained there. No further recovery occurred after reaching this level in either group. However, the TU rats appeared to reach this final level by ∼60 d after transection, while the TC rats did not do so until close to 80 d. Based on the results of ANOVA, TU rats had significantly higher TA background EMG activity than TC rats overall (p < 0.05) but there was no significant difference for any individual 20 d period.
Responses to PT nerve stimulation
Before sciatic nerve transection and repair, PT nerve stimulation in all rats elicited SOL M responses and H-reflexes (Fig. 6, top). PT nerve stimulation also elicited similar but generally smaller responses in the TA. Such TA responses to PT nerve stimulation have been observed previously (English et al., 2007; our unpublished observations). Since they usually differ in latency and form from those of SOL, we think that they are unlikely to be caused by pick-up of the SOL M response and H-reflex by the TA electrodes (i.e., “cross talk”), and we suggest that they may reflect spread of the PT nerve-cuff stimulus to activate axons in the common peroneal nerve.
Figure 6.
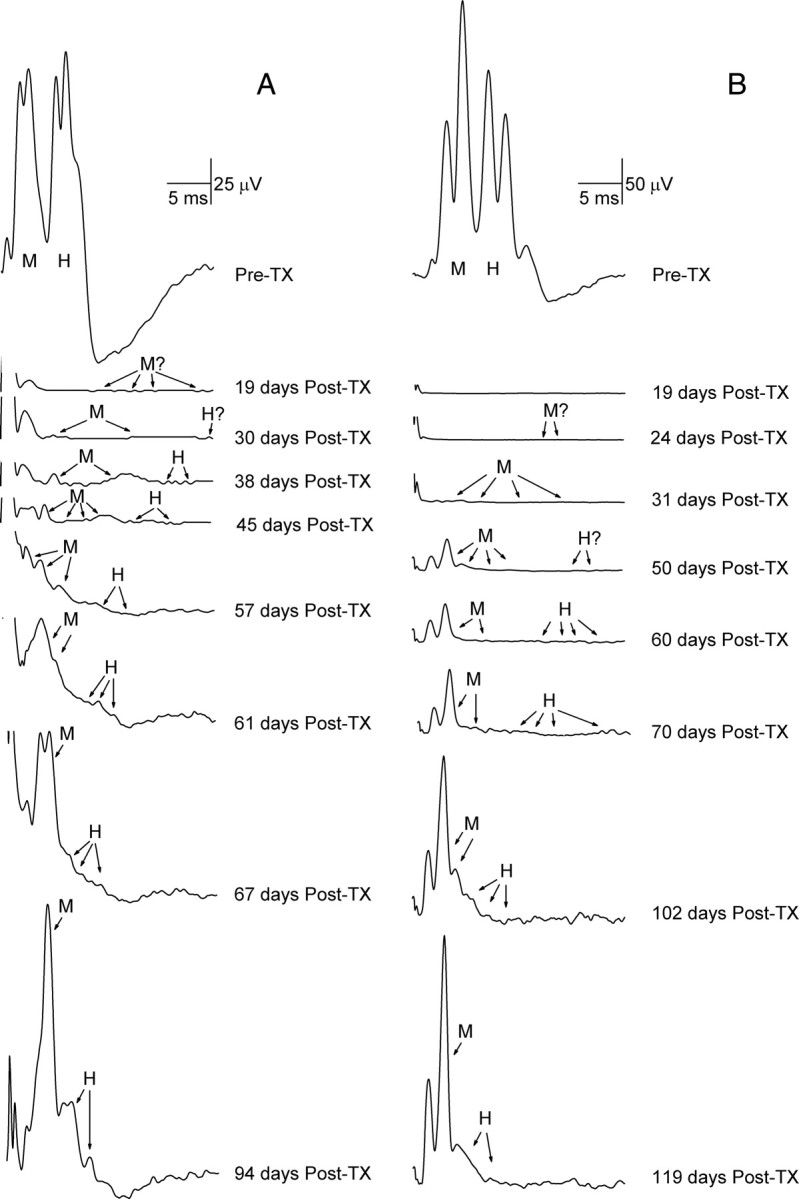
Time courses for reappearance of SOL M response and H-reflex. A, B, Average poststimulus SOL EMG for a day before and for representative days after sciatic nerve transection and repair in a TU rat (A) and a TC rat (B), showing the gradual reappearance of the M response (M) and the H-reflex (H). Each first reappeared ∼19–38 d after transection (Post-TX) as multiple small responses of varying latencies. The amplitudes of these responses gradually increased and their latencies shortened, and they eventually merged into a distinct M response and a distinct H-reflex. Peaks in the first 1–3 ms after stimulation are stimulus artifacts. The M response and H-reflex return earlier, and the final H-reflex is larger, in the TU rat than in the TC rat.
As found previously (English et al., 2007), in all rats the SOL H-reflex disappeared immediately after sciatic nerve transection and repair, while the SOL M response remained for 1–2 d and then disappeared. No response to PT nerve stimulation was seen between 2 d post-transection and 2 weeks post-transection. In all rats, the SOL M response started to reappear 19–41 d after the nerve transection, implying that functional reinnervation of the muscle first appeared at this time. The SOL H-reflex started to reappear 30–66 d after the transection. As illustrated in Figure 6, the returning responses were typically small and at first occurred at longer latencies than typically found in intact rats. As the days passed, these responses became larger and occurred earlier. The initially long latencies often made determination of whether a particular response represented the M response or the H-reflex difficult; the returns of both M responses and H-reflexes were characterized by progressive decreases in latency and increases in amplitude. Thus, in labeling responses as M or H, we took into account the overall course of their gradual return, as illustrated in Figure 6.
The consistently later reappearance of the H-reflex might be due to later or slower regeneration of afferent than efferent axons, and/or to additional time needed for afferent axons to reestablish functioning synaptic contacts on motoneurons following the synaptic stripping that accompanies peripheral axotomy (Titmus and Faber, 1990; Brännström and Kellerth, 1998). The precise time course and the magnitude of recovery of M response and H-reflex varied across rats, but both M response and H-reflex reappearances always started as multiple small responses of varying latencies. As their amplitudes increased and their latencies shortened, these small responses gradually merged into distinct M responses and H-reflexes (Fig. 6). These observations are consistent with our earlier studies (English et al., 2007).
Effects of up-conditioning on the return of M responses and H-reflexes
The times that elapsed from sciatic nerve transection and repair to the definite reappearances of clear SOL M responses and H-reflexes were shorter in TU rats than in TC rats. For the SOL M response, the time elapsed averaged 26 d (±8 d SD) in TU rats and 34 d (±5 d SD) in TC rats (p < 0.05 by t test). For the H-reflex, the time elapsed averaged 43 d (±6 d SD) in TU rats and 55 d (±7 d SD) in TC rats (p < 0.02 by t test). Figure 6 illustrates these differences.
By the end of data collection, the SOL M response had returned to its pretransection M response latency range in all TU and TC rats, and the SOL H-reflex returned to its pretransection latency range (6–10 ms after PT nerve stimulation) in all TU and four of five TC rats. The final SOL M response size (i.e., average M response amplitude for post-transection days 111–120 as percentage of pretransection average value) averaged 97.6% (±5.6% SEM) in TU rats and 94.2% (±2.6%) in TC rats (p > 0.59 by t test). In contrast, the final SOL H-reflex size (i.e., average H-reflex amplitude for post-transection days 111–120 as percentage of pretransection average value) averaged 56.7% (±5.3%) in TU rats and 37.8% (±6.6%) in TC rats. The final H-reflex was significantly larger in TU rats than in TC rats (p < 0.05 by t test). In Figure 7 the average poststimulus SOL EMG activity is shown for 7 d before nerve transection (solid line), and for the final 10 d period (i.e., post-transection days 111–120) (dashed line) after transection from a TU rat (upper) and a TC rat (bottom). The M response has recovered similarly in the two rats, while the H-reflex has recovered better in the TU rat than in the TC rat.
Figure 7.

Average poststimulus SOL EMG activity for the final 7 d before nerve transection (solid line) and for post-transection days 111–120 (dashed line) from a TU rat (top) and a TC rat (bottom). The M response has recovered similarly in the two rats. In contrast, the H-reflex has recovered better in the TU rat than in the TC rat. Note that the M and H latencies, marked by vertical dashed lines, differ slightly in these two rats. Peaks in the first 1–2 ms after stimulation are stimulus artifacts.
In all rats, the PT stimulation elicited first (i.e., M-response latency range) and second (i.e., H-reflex latency range) EMG responses in TA. Like the SOL M-response, the first TA response remained for 1–2 d after sciatic transection and then disappeared; and like the SOL H-reflex, the second TA response disappeared immediately after sciatic transection. Both responses reappeared several weeks later. The second TA response size for the final 10 d (i.e., post-transection day 111–120, in percentage of initial value) averaged 51.1% (±22.9% SEM) in the TC rats and 53.0% (±16.3%) in the TU rats (p > 0.9 by t test). In contrast with the significant difference between TU and TC rats in final SOL H-reflex amplitudes, this lack of difference in the second TA responses is further evidence that the TA responses to PT stimulation were not due to pickup of the SOL EMG activity by the TA electrodes (see Responses to PT nerve stimulation above).
Effects of up-conditioning on SOL and TA motoneuron pools
The numbers and proportions of motoneurons retrogradely labeled by CTB-Fluor 488 and/or CTB-Fluor 594 for the three groups of rats are shown in Figure 8. Average (±SD) numbers of CTB-Fluor 488-labeled (i.e., SOL) motoneurons (A), CTB-Fluor 594-labeled (i.e., TA) motoneurons (B), and double-labeled motoneurons (C) in TU, TC, and NT rats are shown. In both TU and TC (i.e., the nerve-transected) rats, significantly smaller numbers of SOL and TA motoneurons were found than in NT rats (p < 0.001 for both by one-way ANOVA). In Figure 8, D–F, these same values are expressed as a percentage of the total number of labeled motoneurons (i.e., CTB-Fluor 588-labeled motoneurons plus CTB-Fluor 594-labeled motoneurons plus double-labeled motoneurons) for TU, TC, and NT rats. The two nerve-transected groups (i.e., TU and TC) have significantly higher proportions of double-labeled motoneurons than the intact (i.e., NT) rats (p = 0.03, and p = 0.002, respectively). However, TU and TC rats do not differ significantly in numbers of SOL (p > 0.79), TA (p > 0.43), or double-labeled (p = 0.17) motoneurons, nor in their proportions of SOL (p > 0.49), TA (p > 0.81), or double-labeled motoneurons (p > 0.41).
Figure 8.

A–C, Average (±SD) numbers of labeled SOL (A), TA (B), and double-labeled (C) motoneurons in TU, TC, and NT rats. D–F, Average (±SD) number of SOL (D), TA (E), and double-labeled (F) motoneurons in TU, TC, and NT rats (in percentage of total labeled motoneurons (i.e., sum of SOL, TA, and double-labeled motoneurons) in the rat group). TU and TC (i.e., the nerve-transected) rats have significantly fewer numbers of labeled SOL and TA motoneurons and higher proportions of double-labeled motoneurons than NT (i.e., the intact untransected) rats. ***p < 0.001; **p = 0.002; *p = 0.03 versus NT rats by ANOVA.
Effects of up-conditioning on motoneuron VGLUT1 terminals
We identified and analyzed VGLUT1-positive terminals on the somata and attached proximal dendrites of CTB-Fluor 488-labeled SOL motoneurons that had a nucleus and a clear somatic border. Some retrogradely labeled motoneurons had proximal dendrites ≥100 μm long with VGLUT1-positive terminals on them (Fig. 3B–D). The VGLUT1 terminals were darkly labeled and typically had an ovoid shape. Their diameters (Feret's diameter, i.e., the long axis of the terminal) varied from 0.6 to 6.7 μm. Up-conditioning of SOL H-reflex affected the size and number of VGLUT1 terminals on SOL motoneurons. In Figure 9, the average (±SEM) number of VGLUT1 terminals/motoneuron (A), terminal diameter (B), terminal area (C), and terminal VGLUT1-IR intensity (D) on SOL motoneurons are shown for TU, TC, and NT rats. Both TU and TC rats had significantly fewer VGLUT1 terminals than NT rats [ANOVA followed by Tukey test (p < 0.005 and p < 0.00001 for TU vs NT and TC vs NT, respectively)]. At the same time, TU rats had significantly more VGLUT1 terminals than TC rats (p < 0.001). In addition to their substantial difference from NT rats in terminal number, TC (but not TU) rats also had slightly smaller terminal areas and diameters than NT rats (p < 0.05 for each comparison for TC rats, p > 0.15 for each comparison for TU rats). There was no significant difference in terminal VGLUT1-IR intensity among the three groups of animals (p > 0.2 for all). These findings are illustrated in the examples in Figure 3 of VGLUT1-labeled SOL motoneurons from a TU rat (Fig. 3C) and a TC rat (Fig. 3D). The motoneuron of the TU rat has more VGLUT1 terminals than that of the TC rat.
Figure 9.
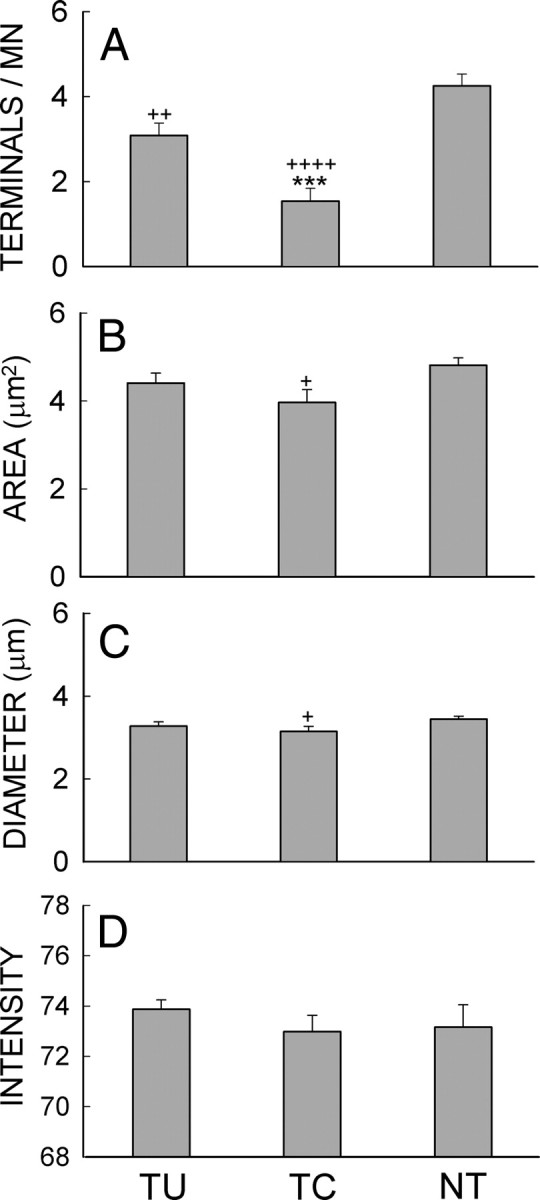
A–D, Average (±SE) numbers of VGLUT1 terminals per motoneuron (A), terminal areas (B), terminal diameters (C), and terminal VGLUT1-IR intensities (D) for TU, TC, and NT rats. +p < 0.05, ++p < 0.005, and ++++p < 0.00001, respectively, for TU or TC versus NT rats; ***p < 0.001 for TU versus TC rats by ANOVA.
Discussion
Peripheral nerve transection and repair affects the relationship between spinal circuits and the musculoskeletal system. Although axotomized spinal motoneurons in adult mammals can survive and their axons can regenerate and reinnervate peripheral targets, this reinnervation is usually much less specific than the innervation before nerve transection (Brushart and Mesulam, 1980; Brushart et al., 1983; English, 2005). This imperfect reinnervation is thought to be a major contributor to the poor functional outcomes noted clinically after nerve injury (Sunderland, 1978; Fu and Gordon, 1995; Edgerton et al., 1997). Thus, methods for enhancing appropriate reinnervation after nerve injury might improve functional recovery.
Laboratory and clinical studies indicate that spinal cord plasticity contributes to the acquisition of motor skills in normal life and the changes in motor function after trauma or disease (for review, see Wolpaw and Tennissen, 2001; Wolpaw, 2006b; Wolpaw and Chen, 2009). Operant conditioning of the spinal stretch reflex (SSR) (i.e., the tendon jerk) or its electrical analog, the H-reflex, can modify descending neural activity and thereby induce spinal cord plasticity that affects motor function (Wolpaw et al., 1983a; Wolpaw, 1987; Evatt et al., 1989; Chen and Wolpaw, 1995; Segal, 1997; Chen et al., 2005). Furthermore, H-reflex operant conditioning can improve locomotor function after partial spinal cord injury in rats (Y. Chen et al., 2006). Since reflex conditioning can induce spinal cord plasticity that changes motor function, we hypothesized that it might be able to induce adaptive changes that improve functional recovery after peripheral nerve injury.
This study asks whether reflex conditioning can improve the functional and anatomical outcomes after peripheral nerve injury and repair. In rats that underwent sciatic nerve transection and repair, we assessed the effect of up-conditioning the SOL H-reflex on: the recovery of SOL and TA function; the numbers of motoneurons reinnervating SOL and TA; and putative primary afferent terminals (i.e., VGLUT1-positive terminals) on SOL motoneurons.
Effects on SOL and TA function
Up-conditioning accelerated recovery of background EMG activity. Background SOL EMG attained its maximum post-transection values earlier in TU than in TC rats. This suggests that conditioning might enhance motor axon regeneration. Regenerating axons can take days to weeks to cross the transection site (Sunderland, 1978; Kline and Hudson, 1995; Witzel et al., 2005), and they then grow relatively slowly (Gordon, 2009). By the time later regenerating axons enter the distal nerve stump, their growth potential and the permissive growth environment of the stump have begun to deteriorate (Fu and Gordon, 1995; Whitworth et al., 1996). Thus, their ability to reinnervate distant targets is reduced. While the results suggest that H-reflex up-conditioning might promote faster entry into the regenerating pathway, increase the subsequent growth rate, and/or accelerate establishment of functional synaptic connections on muscle fibers, other explanations are possible. Alternatively, or in addition, the enhanced recovery might result from strengthening of motoneuron excitatory responses to primary afferent input (i.e., group I and large group II afferents). Further studies are needed to evaluate these possibilities.
H-reflex up-conditioning also increased the final size of the H-reflex. By 120 d after nerve transection, the H-reflex was significantly larger in TU than in TC rats. This difference cannot be readily explained by differences between the groups in the completeness of motor axon reinnervation, since neither the final M response nor the final background EMG level differed significantly between TC and TU rats. Nor can it be explained by the known effects of electrical stimulation on axonal regeneration (Nix and Hopf, 1983; Al-Majed et al., 2000; Brushart et al., 2005; Gordon et al., 2008). The stimuli that enhanced regeneration in these earlier studies were delivered to the proximal stump of the cut nerve at relatively high rates (e.g., 20 Hz) and intensities. In contrast, the stimuli of the present study were delivered to the distal stump as single pulses at a rate <0.3 Hz and at low intensity (usually just above M response threshold). Furthermore, TU and TC rats received similar total numbers of stimuli (Fig. 4), yet final H-reflexes were 50% larger in TU rats. At the same time, while the present results show that the up-conditioning protocol increased SOL H-reflex size, they do not establish that the reward contingency (i.e., the fact that larger H-reflexes were rewarded) was responsible. It is conceivable that some other aspect of the rewarding process contributed.
The selectivity of H-reflex conditioning indicated by the fact that TU and TC rats differed in final SOL H-reflex size but not in final TA H-reflex size is consistent with earlier H-reflex conditioning studies (Wolpaw et al., 1983b; Wolpaw et al., 1993). This specificity may be clinically useful since it should allow therapeutic conditioning protocols to focus on specific reflex pathways (Y. Chen et al., 2006).
The larger H-reflex in TU rats indicates that the PT stimulation activated a larger proportion of the pool of available SOL motor units in the TU rats than in the TC rats. We suggest that H-reflex up-conditioning either reduced the synaptic stripping that normally accompanies axotomy (Titmus and Faber, 1990; Brännström and Kellerth, 1998; Davis-Lopéz de Carrizosa et al., 2009; Alvarez et al., 2010), enhanced the regeneration of primary afferents, and/or increased the specificity of the regenerated synaptic connections. While other explanations are possible (e.g., up-conditioning may have increased the H-reflex by inducing other electrophysiological or anatomical changes in the motoneurons, their synaptic inputs, and/or spinal interneurons) (Carp and Wolpaw, 1994, 1995; Carp et al., 2001; Wang et al., 2006, 2009; Pillai et al., 2008), the hypothesis that up-conditioning enhanced functionally appropriate primary afferent connections on SOL motoneurons is supported by the data on VGLUT1-positive terminals discussed below.
Effects on muscle innervations of SOL and TA motoneurons
Significantly fewer retrogradely labeled motoneurons were found in both nerve-transected groups (i.e., TU and TC rats) than in NT rats, but these two groups did not differ significantly from one another. Thus, following sciatic nerve transection and subsequent regeneration, not all of the axotomized motoneurons reinnervated the SOL and TA. Up-conditioning of the SOL H-reflex did not affect final muscle reinnervation. These conclusions are consistent with the finding that SOL H-reflex up-conditioning did not affect the final level of SOL background EMG attained or the amplitude of the final SOL M response. What SOL H-reflex up-conditioning did do was to increase the proportion of the motoneurons reinnervating SOL that participated in the H-reflex.
The small number (∼7%) of double-labeled motoneurons found in intact (i.e., NT) rats probably reflected unavoidable leakage of a small amount of dye from one muscle to the other through the path left after intramuscular injection (since the SOL and TA are close together). The fact that TU and TC rats had significantly higher proportions of double-labeled motoneurons than NT rats suggests that some SOL and TA motoneurons reinnervated both SOL and TA muscles, as has been suggested (Brushart et al., 1983; English, 2005).
Effects on putative primary afferent terminals on SOL motoneurons
As Figure 9 summarizes, SOL motoneurons had more VGLUT1 terminals in TU rats than in TC rats. Synaptic boutons containing VGLUT1 are present in the ventral horn of the spinal cord (Varoqui et al., 2002), and VGLUT1 is an excellent marker for glutamatergic inputs from myelinated primary sensory afferents (Alvarez et al., 2004). It is most abundant in mechanosensory deep afferents (Oliveira et al., 2003; Todd et al., 2003; Alvarez et al., 2004; Landry et al., 2004), and is also expressed in muscle spindle afferents (Wu et al., 2004). Using cholera toxin B (CTB) retrograde labeling, Todd et al. (2003) found that CTB colocalized with VGLUT1 in afferent terminals of spinal laminae III–V. Others found that VGLUT1 terminals disappeared after dorsal rhizotomy (Alvarez et al., 2004; Wu et al., 2004). Thus, the VGLUT1 terminals on SOL motoneurons in the present study probably represent primary afferent contacts. The greater number of VGLUT1 terminals on SOL motoneurons in TU rats compared with TC rats suggests that SOL H-reflex up-conditioning strengthened primary afferent reinnervation of SOL motoneurons, and may explain why the final SOL H-reflex was larger in TU than in TC rats. Whether the greater number of VGLUT1 terminals resulted from enhanced (or more specific) primary afferent regeneration, from reduction in the synaptic stripping that accompanies axotomy (Titmus and Faber, 1990; Brännström and Kellerth, 1998; Davis-Lopéz de Carrizosa et al., 2009; Alvarez et al., 2010), and/or from increased VGLUT1 expression in terminals already present remains to be determined.
Conclusions
Following sciatic nerve transection and repair in rats, up-conditioning of the SOL H-reflex appeared to accelerate and enhance functional recovery: SOL EMG returned more quickly, and the SOL H-reflex achieved a greater size. In addition, up-conditioned rats had more VGLUT1 terminals (i.e., putative primary afferent terminals), which may explain why the H-reflex was larger. While the mechanisms responsible for these functional and anatomical effects are as yet uncertain, the results of this study suggest that operant conditioning of spinal reflexes could be a useful tool for modifying the outputs of spinal circuits so as to improve functional recovery after peripheral nerve injuries.
Footnotes
This work was supported by grants from the National Institutes of Health [HD32571 (A.W.E.), HD36020 (X.Y.C.), NS22189 (J.R.W.), and NS061823 (J.R.W. and X.Y.C.)], and the New York State Spinal Cord Injury Trust Fund (X.Y.C.). We thank Rongliang Liu for excellent technical assistance, and Drs. Dennis J. McFarland, Jonathan S. Carp, and Elizabeth Winter Wolpaw for valuable comments on the manuscript.
References
- Al-Majed AA, Neumann CM, Brushart TM, Gordon T. Brief electrical stimulation promotes the speed and accuracy of motor axonal regeneration. J Neurosci. 2000;20:2602–2608. doi: 10.1523/JNEUROSCI.20-07-02602.2000. [DOI] [PMC free article] [PubMed] [Google Scholar]
- Alvarez FJ, Villalba RM, Zerda R, Schneider SP. Vesicular glutamate transporters in the spinal cord, with special reference to sensory primary afferent synapses. J Comp Neurol. 2004;472:257–280. doi: 10.1002/cne.20012. [DOI] [PubMed] [Google Scholar]
- Alvarez FJ, Bullinger KL, Titus HE, Nardelli P, Cope TC. Permanent reorganization of Ia afferent synapses on motoneurons after peripheral nerve injuries. Ann N Y Acad Sci. 2010;1198:231–241. doi: 10.1111/j.1749-6632.2010.05459.x. [DOI] [PMC free article] [PubMed] [Google Scholar]
- Brännström T, Kellerth J. Changes in synaptology of adult cat spinal alpha-motoneurons after axotomy. Exp Brain Res. 1998;118:1–13. doi: 10.1007/s002210050249. [DOI] [PubMed] [Google Scholar]
- Brushart TM. The mechanical and humoral control of specificity in nerve repair. In: Gelberman RH, editor. Operative nerve repair and reconstruction. Philadelphia: Lippincott; 1991. pp. 215–230. [Google Scholar]
- Brushart TM, Mesulam MM. Alteration in connections between muscle and anterior horn motoneurons after peripheral nerve repair. Science. 1980;208:603–605. doi: 10.1126/science.7367884. [DOI] [PubMed] [Google Scholar]
- Brushart TM, Tarlov EC, Mesulam MM. Specificity of muscle reinnervation after epineurial and individual fascicular suture of the rat sciatic nerve. J Hand Surg Am. 1983;8:248–253. doi: 10.1016/s0363-5023(83)80152-x. [DOI] [PubMed] [Google Scholar]
- Brushart TM, Jari R, Verge V, Rohde C, Gordon T. Electrical stimulation restores the specificity of sensory axon regeneration. Exp Neurol. 2005;194:221–229. doi: 10.1016/j.expneurol.2005.02.007. [DOI] [PubMed] [Google Scholar]
- Carp JS, Wolpaw JR. Motoneuron plasticity underlying operantly conditioned decrease in primate H-reflex. J Neurophysiol. 1994;72:431–442. doi: 10.1152/jn.1994.72.1.431. [DOI] [PubMed] [Google Scholar]
- Carp JS, Wolpaw JR. Motoneuron properties after operantly conditioned increase in primate H-reflex. J Neurophysiol. 1995;73:1365–1373. doi: 10.1152/jn.1995.73.4.1365. [DOI] [PubMed] [Google Scholar]
- Carp JS, Chen XY, Sheikh H, Wolpaw JR. Motor unit properties after operant conditioning of rat H-reflex. Exp Brain Res. 2001;140:382–386. doi: 10.1007/s002210100830. [DOI] [PubMed] [Google Scholar]
- Chen XY, Wolpaw JR. Operant conditioning of H-reflex in freely moving rats. J Neurophysiol. 1995;73:411–415. doi: 10.1152/jn.1995.73.1.411. [DOI] [PubMed] [Google Scholar]
- Chen XY, Wolpaw JR. Dorsal column but not lateral column transection prevents down conditioning of H-reflex in rats. J Neurophysiol. 1997;78:1730–1734. doi: 10.1152/jn.1997.78.3.1730. [DOI] [PubMed] [Google Scholar]
- Chen XY, Wolpaw JR. Probable corticospinal tract control of spinal cord plasticity in the rat. J Neurophysiol. 2002;87:645–652. doi: 10.1152/jn.00391.2001. [DOI] [PubMed] [Google Scholar]
- Chen XY, Wolpaw JR. Ablation of cerebellar nuclei prevents H-reflex down conditioning in rats. Learn Mem. 2005;12:248–254. doi: 10.1101/lm.91305. [DOI] [PMC free article] [PubMed] [Google Scholar]
- Chen XY, Chen L, Wolpaw JR. Conditioned H-reflex increase persists after transection of the main corticospinal tract in rats. J Neurophysiol. 2003;90:3572–3578. doi: 10.1152/jn.00264.2003. [DOI] [PubMed] [Google Scholar]
- Chen XY, Carp JS, Chen L, Wolpaw JR. Sensorimotor cortex ablation prevents H-reflex up-conditioning and causes a paradoxical response to down-conditioning in rats. J Neurophysiol. 2006;96:119–127. doi: 10.1152/jn.01271.2005. [DOI] [PubMed] [Google Scholar]
- Chen Y, Chen XY, Jakeman LB, Schalk G, Stokes BT, Wolpaw JR. The interaction of a new motor skill and an old one: H-reflex conditioning and locomotion in rats. J Neurosci. 2005;25:6898–6906. doi: 10.1523/JNEUROSCI.1684-05.2005. [DOI] [PMC free article] [PubMed] [Google Scholar]
- Chen Y, Chen XY, Jakeman LB, Chen L, Stokes BT, Wolpaw JR. Operant conditioning of H-reflex improves locomotion after spinal cord injury in rats. J Neurosci. 2006;26:12537–12543. doi: 10.1523/JNEUROSCI.2198-06.2006. [DOI] [PMC free article] [PubMed] [Google Scholar]
- Davis-Lopéz de Carrizosa MA, Morado-Díaz CJ, Tena JJ, Benítez-Temiño B, Pecero ML, Morcuende SR, de la Cruz RR, Pastor AM. Complimentary actions of BDNF and Neurotrophin-3 on the firing patterns and synaptic composition of motoneurons. J Neurosci. 2009;29:575–587. doi: 10.1523/JNEUROSCI.5312-08.2009. [DOI] [PMC free article] [PubMed] [Google Scholar]
- Edgerton VR, de Leon RD, Tillakaratne N, Recktenwald MR, Hodgson JA, Roy RR. Use dependent plasticity in spinal stepping and standing. Adv Neurol. 1997;72:233–247. [PubMed] [Google Scholar]
- English AW. Enhancing axon regeneration in peripheral nerves also increases functionally inappropriate reinnervation of targets. J Comp Neurol. 2005;490:427–441. doi: 10.1002/cne.20678. [DOI] [PubMed] [Google Scholar]
- English AW, Chen Y, Carp JS, Wolpaw JR Chen XY. Recovery of electromyographic activity after transection and surgical repair of the rat sciatic nerve. J Neurophysiol. 2007;97:1127–1134. doi: 10.1152/jn.01035.2006. [DOI] [PubMed] [Google Scholar]
- Evatt ML, Wolf SL, Segal RL. Modification of human spinal stretch reflexes: preliminary studies. Neurosci Lett. 1989;105:350–355. doi: 10.1016/0304-3940(89)90646-0. [DOI] [PubMed] [Google Scholar]
- Fu SY, Gordon T. Contributing factors to poor functional recovery after delayed nerve repair: prolonged denervation. J Neurosci. 1995;15:3886–3895. doi: 10.1523/JNEUROSCI.15-05-03886.1995. [DOI] [PMC free article] [PubMed] [Google Scholar]
- Gordon T. The role of neurotrophic factors in nerve regeneration. Neurosurg Focus. 2009;26:E3. doi: 10.3171/FOC.2009.26.2.E3. [DOI] [PubMed] [Google Scholar]
- Gordon T, Brushart TM, Chan KM. Augmenting nerve regeneration with electrical stimulation. Neurol Res. 2008;30:1012–1022. doi: 10.1179/174313208X362488. [DOI] [PubMed] [Google Scholar]
- Kline DG, Hudson AR. Nerve injuries: operative results for entrapments and tumors. Philadelphia: Saunders; 1995. [Google Scholar]
- Koerber HR, Seymour AW, Mendell LM. Mismatches between peripheral receptor type and central projections after peripheral nerve regeneration. Neurosci Lett. 1989;99:67–72. doi: 10.1016/0304-3940(89)90266-8. [DOI] [PubMed] [Google Scholar]
- Landry M, Bouali-Benazzouz R, El Mestikawy S, Ravassard P, Nagy F. Expression of vasicular glutamate transporters in rat lumbar spinal cord, with a note on dorsal root ganglia. J Comp Neurol. 2004;468:380–394. doi: 10.1002/cne.10988. [DOI] [PubMed] [Google Scholar]
- Nix WA, Hopf HC. Electrical stimulation of regenerating nerve and its effect on motor recovery. Brain Res. 1983;272:21–25. doi: 10.1016/0006-8993(83)90360-8. [DOI] [PubMed] [Google Scholar]
- Oliveira AL, Hydling F, Olsson E, Shi T, Edwards RH, Fujiyama F, Kaneko T, Hökfelt T, Cullheim S, Meister B. Cellular localization of the vesicular glutamate transporter mRNAs and proteins in rat spinal cord and dorsal root ganglia. Synapse. 2003;50:117–129. doi: 10.1002/syn.10249. [DOI] [PubMed] [Google Scholar]
- Pillai S, Wang Y, Wolpaw JR, Chen XY. Effects of H-reflex up-conditioning on GABAergic terminals on rat soleus motoneurons. Eur J Neurosci. 2008;28:668–674. doi: 10.1111/j.1460-9568.2008.06370.x. [DOI] [PMC free article] [PubMed] [Google Scholar]
- Sabatier MJ, Redmon N, Schwartz G, English AW. Treadmill training promotes axon regeneration in injured peripheral nerves. Exp Neurol. 2008;211:489–493. doi: 10.1016/j.expneurol.2008.02.013. [DOI] [PMC free article] [PubMed] [Google Scholar]
- Segal RL. Plasticity in the central nervous system: operant conditioning of the spinal stretch reflex. Top Stroke Rehabil. 1997;3:76–87. doi: 10.1080/10749357.1997.11754130. [DOI] [PubMed] [Google Scholar]
- Sunderland S. Nerve and nerve injuries. London: Churchill Livingstone; 1978. [Google Scholar]
- Titmus MJ, Faber DS. Axotomy induced alterations in the electrophysiological characteristics of neurons. Prog Neurobiol. 1990;35:1–51. doi: 10.1016/0301-0082(90)90039-j. [DOI] [PubMed] [Google Scholar]
- Todd AJ, Hughes DI, Polgár E, Nagy GG, Mackie M, Ottersen OP, Maxwell DJ. The expression of vesicular glutamate transporters VGLUT1 and VGLUT2 in neurochemically defined axonal populations in the rat spinal cord with emphasis on the dorsal horn. Eur J Neurosci. 2003;17:13–27. doi: 10.1046/j.1460-9568.2003.02406.x. [DOI] [PubMed] [Google Scholar]
- Varoqui H, Schäfer MK, Zhu H, Weihe E, Erickson JD. Identification of differentiation-associated Na+-PI transporter as a novel vesicular glutamate transporter expressed in a distinct set of glutamatergic synapses. J Neurosci. 2002;22:142–155. doi: 10.1523/JNEUROSCI.22-01-00142.2002. [DOI] [PMC free article] [PubMed] [Google Scholar]
- Wang Y, Pillai S, Wolpaw JR, Chen XY. Motor learning changes GABAergic terminals on spinal motoneurons in normal rats. Eur J Neurosci. 2006;23:141–150. doi: 10.1111/j.1460-9568.2005.04547.x. [DOI] [PubMed] [Google Scholar]
- Wang Y, Pillai S, Wolpaw JR, Chen XY. H-reflex down-conditioning greatly increases the number of identifiable GABAergic interneurons in rat ventral horn. Neurosci Lett. 2009;452:124–129. doi: 10.1016/j.neulet.2009.01.054. [DOI] [PMC free article] [PubMed] [Google Scholar]
- Whitworth IH, Brown RA, Dore CJ, Anand P, Green CJ, Terenghi G. Nerve growth factor enhances nerve regeneration through fibronectin grafts. J Hand Surg Br. 1996;21:514–522. doi: 10.1016/s0266-7681(96)80058-1. [DOI] [PubMed] [Google Scholar]
- Witzel C, Rohde C, Brushart TM. Pathway sampling by regenerating peripheral axons. J Comp Neurol. 2005;485:183–190. doi: 10.1002/cne.20436. [DOI] [PubMed] [Google Scholar]
- Wolpaw JR. Operant conditioning of primate spinal reflexes: the H-reflex. J Neurophysiol. 1987;57:443–459. doi: 10.1152/jn.1987.57.2.443. [DOI] [PubMed] [Google Scholar]
- Wolpaw JR. The education and re-education of the spinal cord. Prog Brain Res. 2006a;157:261–280. doi: 10.1016/s0079-6123(06)57017-7. [DOI] [PubMed] [Google Scholar]
- Wolpaw JR. Activity-dependent plasticity in the intact spinal cord. In: Selzer ME, Clarke S, Cohen LG, Duncan P, Gage FH, editors. Textbook of neural repair and rehabilitation; neural repair and plasticity. Cambridge, UK: Cambridge UP; 2006b. pp. 109–125. [Google Scholar]
- Wolpaw JR, Chen XY. The cerebellum in maintenance of a motor skill: a hierarchy of brain and spinal cord plasticity underlies H-reflex conditioning. Learn Mem. 2006;13:208–215. doi: 10.1101/lm.92706. [DOI] [PMC free article] [PubMed] [Google Scholar]
- Wolpaw JR, Chen XY. Operant conditioning of reflexes. In: Squire LR, editor. Encyclopedia of neuroscience. vol 7. Oxford: Academic; 2009. pp. 225–233. [Google Scholar]
- Wolpaw JR, Tennissen AM. Activity-dependent spinal cord plasticity in health and disease. Annu Rev Neurosci. 2001;24:807–843. doi: 10.1146/annurev.neuro.24.1.807. [DOI] [PubMed] [Google Scholar]
- Wolpaw JR, Braitman DJ, Seegal RF. Adaptive plasticity in the primate spinal stretch reflex: initial development. J Neurophysiol. 1983a;50:1296–1311. doi: 10.1152/jn.1983.50.6.1296. [DOI] [PubMed] [Google Scholar]
- Wolpaw JR, Seegal RF, O'Keefe JA. Adaptive plasticity in the primate spinal stretch reflex: behavior of synergist and antagonist muscles. J Neurophysiol. 1983b;50:1312–1319. doi: 10.1152/jn.1983.50.6.1312. [DOI] [PubMed] [Google Scholar]
- Wolpaw JR, Herchenroder PA, Carp JS. Operant conditioning of the primate H-reflex: factors affecting the magnitude of change. Exp Brain Res. 1993;97:31–39. doi: 10.1007/BF00228815. [DOI] [PubMed] [Google Scholar]
- Wu SX, Koshimizu Y, Feng YP, Okamoto K, Fujiyama F, Hioki H, Li YQ, Kaneko T, Mizuno N. Vesicular glutamate transporter immunoreactivity in the central and peripheral endings of muscle-spindle afferents. Brain Res. 2004;1011:247–251. doi: 10.1016/j.brainres.2004.03.047. [DOI] [PubMed] [Google Scholar]