

Abstract
We have employed recently developed techniques in T-cell culturing to study the nature and function of infiltrating hepatic allograft T cells. Using the rationale that intragraft T cells are activated during cell mediated damage to the allograft, we were able to show that these cells would propagate and remain functionally active in the presence of the T-cell growth factor, IL-2. In several instances, phenotypic analysis of cells grown in this manner was very similar to that found within the graft. Both proliferative and cytotoxic responses could be detected from the cultured cell lines. The majority of the proliferative responses were donor-directed and immunogenetic analysis could define donor-directed HLA reactivity, to either class I or class II antigens, or both. Monoclonal anti-HLA antibodies inhibition profiles verified the apparent HLA reactivity. In a smaller percentage of cases, only IL-2 responsiveness could be detected, and no HLA reactivity could be determined. Cytotoxicity could be detected against both class I and class II antigens, however, those cells which demonstrated a greater magnitude of donor-directed cytotoxicity appeared to be directed against class I antigens. A significant correlation between donor-directed proliferation of biopsy cultured lymphocytes and cellular rejection was found. This model appears to be useful in delineating functions of the intragraft T-cell population during rejection.
Introduction
Hepatic allograft transplantation has become an accepted form of therapy for treatment of a variety of life-threatening liver diseases [1–4]. The indications for this procedure range from end-stage liver failure, due to a variety of causes, to patients with inborn errors in metabolism and hepatic malignancy. The success of this procedure has been well documented. With the advent of cyclosporine immunosuppression, 60–70% 5-yr survival rates are being achieved [1]. Rejection continues to be a major cause of graft dysfunction, in spite of technological and immunosuppressive advances [1,4].
While little is known about the immunobiology of hepatic rejection, several observations point out possible differences from other allograft rejection models. The ability to transplant cadaveric livers in spite of a positive lymphocytotoxicity cross-match and across ABO incompatibilities highlight possible differences in allorecognition [5,6]. Whether this reflects the unique anatomic architecture of the liver, or whether there are differences in the expression of alloantigens, is not known. Several studies have demonstrated disparity of expression of class I and class II MHC antigens on normal liver vasculature when compared to other vascularized organs [7,8].
While most current models of allorecognition and subsequent rejection assign T lymphocytes a central role [9], little is known regarding the function of these cells or their contribution to the severity of graft rejection. Immunohistochemical staining of organ transplant tissues with monospecific cell surface marker antibodies has given conflicting data on the CD4 and CD8 markers1 of infiltrating T cells [11–14]. These studies have other limitations: (i) inability to correlate cell surface markers with functional characteristics of the cells in question, and (ii) presence of “irrelevant” mononuclear cell infiltrates in the absence of clinical rejection within the allograft [15,16]. Several models have therefore been advanced to study the functional characteristics of infiltrating graft cells and their role in rejection. In vitro functional assays of enzymatically isolated lymphocytes from rejected organs have demonstrated allospecificity [17]. The sponge-allograft model has been employed to study the kinetics of graft infiltration [18,19]. Recent advances in T-cell culture technology have enabled the propagation and expansion of activated T cells from allograft biopsies. Kim et al. have shown that cloned noncytotoxic T-cell lines from mouse skin allografts could mediate rejection when reinjected into naive animals [20]. Both Moreau et al. [21], and Mayer et al. [22], have described isolation of functionally active allospecific human T-cells lines propagated from either percutaneous biopsies or rejected renal grafts. We have recently described the allospecificity of T cells grown from serial endomyocardial biopsies from heart allograft recipients, and demonstrated both class I and class II HLA recognition [23].
We are interested in understanding the mechanisms of allorecognition and hepatic rejection. Because immunologic monitoring of peripheral blood has limitations in these patients [24], we have routinely obtained liver core biopsies during an episode of hepatic allograft dysfunction for histologic confirmation of cellular infiltration. Utilizing T-cell culture techniques, we report the functional characterization of expanded T cells from these biopsies.
Materials and Methods
Source material
Samples of hepatic allografts were obtained from clinical material taken from percutaneous liver biopsies, intraoperative liver biopsies, or allograft hepatectomies. The patient profile is shown in Table 1. All transplant recipients were placed on post-operative intravenous cyclosporine A and steroids, as maintenance immunosuppression. Indications for sampling were derangements in liver function tests and bile composition via T-tube drainage from the allograft [25]. All material was taken in a sterile manner for propagation of infiltrating cells and for histologic evaluation.
TABLE 1. Patient and allograft profile.
| Patient number | Age | Sex | Primary diagnosis | Liver biopsy | Graft functoning? |
|---|---|---|---|---|---|
| 1 | 19 | M | chronic hepatitis | 1.7B | yes |
| 2 | 44 | F | hemachromatosis | 2.16A | no |
| 3 | 54 | F | hepatic carcinoma | 3.32A | yes |
| 4 | 27 | M | Caroli's Disease | 4.12A | yes |
| 5 | 42 | M | hemachromatosis | 5.300B | yes |
| 6 | 7 | F | biliary atresia | 6.73A | yes |
| 7 | 48 | F | primary biliary cirrhosis | 7.5A | yes |
| 8 | 42 | M | post hepatitic cirrhosis | 8.9A | |
| 8.13A | no | ||||
| 9 | 36 | F | cryptogenic cirrhosis | 9.9A | no |
| 9.11B | |||||
| 9.39B | no | ||||
| 10 | 17 | M | Wilson's Disease | 10.59B | no |
| 11 | 17 | F | hypercholesterolemia | 11.3A | no |
| 12 | 15 | M | sclerosing cholangitis | 12.3A | no |
| 13 | 43 | F | primary biliary cirrhosis | 13.5A | no |
| 13.28B | no | ||||
| 14 | 9 | M | Alagilles Syndrome | 14.3A | yes |
Histology
Samples sent for histology were sectioned and stained with (i) hematoxylin and eosin, (ii) reticulin, and in several instances (iii) immunohistochemical stains, e.g., anti-T cell, anti-B cell, and anti-DR. These slides were then evaluated in a blind manner by one of us (J.D.) using previously defined criteria for liver rejection [25–28].
Panel cells
Lymphocytes were obtained either by mechanical disruption of donor spleens, obtained during organ procurement, or from peripheral blood from normal healthy adult volunteers. Cells were isolated by centrifugation over a Ficoll-Hypaque gradient (sp gr 1.077) (Ficoll-Paque, Pharmacia, Piscataway, NJ) and washed several times with Hank's Balanced Salt Solution (B&B/SCOTT, Fiskeville, RI). Viability was determined with trypan blue and the cell aliquots were frozen in 20% human AB serum and 20% dimethyl sulfoxide, and stored in liquid nitrogen. EBV-transformed lymphoblastoid cell lines (LCL) were prepared from donor splenocytes using Epstein-Barr virus and cyclosporine A [29]. PHA-transformed lymphoblast cultures were prepared by incubating lymphocytes with phytohemagglutin-M (PHA) (DIFCO, Detroit, MI) for 4 days prior to use.
Generation of lymphocyte cultures from liver samples
Percutaneous and intraoperative core liver biopsies were divided into several smaller fragments, generally 4–12 in number. Allograft hepatectomy samples were similarly sectioned but the yield was substantially greater and a total of 96 fragments were processed. For purposes of this paper, all liver samples will be designated as “biopsy.” All fragments were individually placed into 100 μl tissue culture medium (TCM) supplemented with 100 μl recombinant IL-2 (Sandoz Pharmaceuticals, Basel) (final dilution 1:10,000) in 96-well microculture plates (COSTAR, Cambridge, MA). TCM consisted of RPMI-1640 (B&B/SCOTT), supplemented with 10% normal human AB serum, 4 mM L-glutamine, 24 mM HEPES buffer, and 60 μg/ml of gentamycin sulfate (GIBCO, Chagrin Falls, OH).
Liver sample cultures were incubated at 37°C in a humidified 5% CO2 atmosphere. After 3–4 days culture, supernatants were replenished with fresh TCM supplemented with recombinant IL-2. The cultures were observed daily on an inverted stage microscope for cellular outgrowth. When growth was observed, the contents of the wells were pooled and transferred into 24 well culture plates (COSTAR) and again supplemented with IL-2 and TCM. After approximately 2 weeks, sufficient cells were obtained for functional and phenotypic studies as well as for further propagation.
Primed lymphocyte testing (PLT)
The PLT activity of lymphocyte cultures grown from liver samples was measured in 3-day proliferation assays, as previously described for alloreactive T-cell clones [30,31]. Prior to testing, the lymphocyte cultures had not received IL-2 for 3 days. This was necessary to reduce background proliferation of these cultured cells. In each PLT assay, 5 × 10³ cultured cells were incubated for 72 hr with 10% AB serum, IL-2, or 5 × 10⁴ irradiated stimulators (2000R) in 96-well round bottom microculture plates with TCM in a final volume of 200 μl. During the final 20 hr of incubation, each culture was pulsed with 1 μCi of 3H-thymidine (specific activity, 20 mCi/mmol, New England Nuclear Products, Boston, MA). The cultures were harvested with a multiple sample harvester (Skatron, Inc, Sterling, VA) and uptake determined by liquid scintillation counting (LKB, Gaithersburg, MD).
PLT inhibition with monoclonal antibodies (MoAb)
Inhibition of proliferation of bulk cultured biopsy T cells to irradiated donor lymphocytes, by monoclonal anti-class I and anti-class II antibodies, was accomplished according to previously described methods [32]. Briefly, the same number of stimulator and responder cells as for PLT, in 100 μl TCM, were coincubated with 100 μl of various MoAbs. The following MoAbs, with their corresponding HLA molecular specificity, were used: SG157 (anti-DR) and SG465 (broad anti-class II) (S. Goyert and J. Silver [33]); L243 (anti-DR) and Leu 10 (anti-DQw1 + w3) (Becton Dickinson, Mountain View, CA [34–36]); and PA2.6 (anti-HLA-A,B,C) (P. Parham [37,38]). The PLT activity was measured in a 72-hr assay as described above.
Cell mediated cytotoxicity (CML)
The CML activity of lymphocyte cultures grown from liver samples was measured in 4-hr 51Cr release assays, according to previous descriptions for alloreactive T-cell clones [31] with slight modifications as noted. Briefly, targets were 4-day PHA stimulated spleen cells (class I targets) or EBV-transformed spleen cells (class I and II targets) from the donor or other HLA-typed panel cells (LCL). An effector:target ratio of 10:1 was used to measure release of labeled chromium from 2 × 10³ labeled target cells. A measured aliquot of supernatant was mixed with a high-efficiency aqueous compatible scintillation counting mixture (READY-SOLV HP/b, Beckman Instruments, Fullerton, CA) and counted in a liquid scintillation counter. The percentage of CML expressed was calculated from a formula which represents a ratio of experimental to total (determined by Iriton-X release) 51Cr release (subtracting spontaneous release) [32].
Cell surface phenotypic analysis
Lymphocytes grown from liver samples were tested for various T-cell differentiation antigens using a modification of the avidin-biotin-immunoperoxidase technique [39]. The following differentiation markers were analyzed: CD3 (pan-T cell), CD4 (“helper/inducer T cell”), and CD8 (“cytotoxic/suppressor T cell”) (OKT series purchased from Ortho Diagnostics, Raratan, NJ; Leu series purchased from Becton Dickinson, Sunnyvale, CA). In addition, anti-DR staining was similarly done using a monoclonal anti-HLA-DR (Becton Dickinson). Briefly, cytocentrifuge smears were prepared, using 2.5 × 10⁴ cells/slide, and fixed in acetone immediately after preparation. A total of 200–400 cells were enumerated.
HLA phenotyping
Peripheral blood lymphocytes, donor spleen cells, and lymphoblastoid cell lines (LCL) were typed for HLA A, and B antigens by the standard NIH microlymphocytotoxicity technique. Serologic typing for HLA DR was done by prolonged incubation microlymphocytotoxicity test using enriched B-cell preparations obtained following carbonyl-iron treatment and Ficoll-Hypaque sedimentation after rosetting with neuraminidase treated sheep red cells.
Statistical analysis
Cultured lymphocytes were defined as reactive towards a given stimulator cell in proliferation assays when the total incorporated 3H-thymidine count ± 2 SD was greater than background counts (i.e., counts with cultured lymphocytes with 10% AB serum alone plus irradiated stimulator cells with 10% AB serum alone) ± 2 SD. Analysis of statistical significance was done using the Chi square test.
Results
Patient/Sample Profile
Lymphocytes were grown from 18 biopsies obtained from 14 liver transplant patients. Table 1 summarizes the salient features of these patients including age, sex, primary diagnosis at the time of transplantation, the post-transplant day of the biopsy, and the current status of the allograft. In this paper, each liver biopsy (LB) culture is referred to by a unique number which identifies the patient and the post-transplant day when the biopsy was obtained. In addition, the letters A and B designate the first and second allografts, respectively. For example, LB1.7B was obtained from patient 1 on day 7 post-transplant from the second allograft and LB2.16A was obtained from patient 2 on day 16 post-transplant from the first liver transplant. This representative population of transplant patients included patients with end-stage liver failure due to a variety of causes as well as patients with inborn errors of metabolism and hepatic malignancy (Table 1). Biopsies were obtained from 11 first transplants and five second transplants, including two patients (9 and 13), who provided specimens from both first and second allografts. The interval from transplantation to biopsy ranged from 3 days to 330 days, with a median of 14 days post-transplant.
Generation and Expansion of Activated T Lymphocytes from Liver Biopsies
Biopsies obtained from hepatic allografts were incubated in vitro, in the presence of recombinant human IL-2, but without the addition of irradiated feeder cells. After 2–3 days, an outgrowth of mononuclear cells was seen (Figure 1). The cultures were supplemented at 2–3 day intervals with IL-2 and transferred into larger wells. Expansion was continued until confluence was obtained, generally within 10–14 days following initial biopsy. Sufficient number of cells (5 × 10⁵−1 × 10⁶) were then obtained for functional assays and phenotypic analysis.
FIGURE 1.
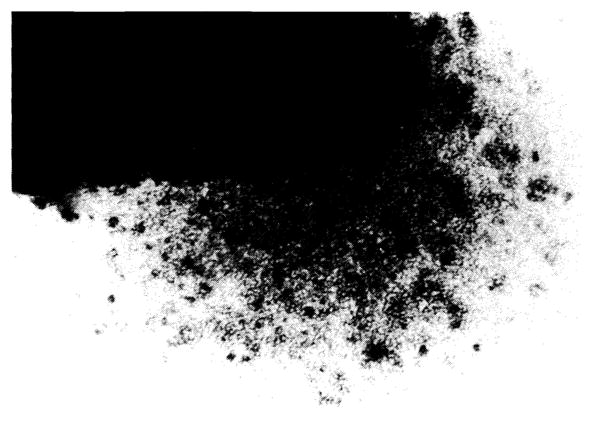
In vitro propagation of lymphocytes from a liver biopsy culture. This is a 400× magnification (original magnification) taken with an inverted stage microscope 4 days after expansion in tissue culture medium supplemented with IL-2. The dark area in the left corner is the liver biopsy tissue.
Phenotype analysis of biopsy-grown mononuclear cells showed a predominance of CD3 positive T lymphocytes, many of which also expressed DR antigens (an indication of activation [40]). Biopsy cultured lymphocytes were typed phenotypically between 2 and 4 weeks following sampling. Table 2 lists representative results which also demonstrate a mixture of CD4 and CD8 positive cells in most cultures. Among seven lymphocyte cultures tested, there seemed to be an overall trend towards CD4 predominance, although statistical significance could not be established, possibly because of small sample size. In two patients (8 and 10), who had undergone a percutaneous liver biopsy, subsequent allograft hepatectomy was required for unremitting rejection shortly thereafter. Cells from these rejected livers, extracted by mechanical disruption followed by Ficoll-Hypaque purification and then directly analyzed, showed very similar phenotype profiles to cells grown from the biopsies (Table 2).
TABLE 2. Phenotypic analysis of lymphocytes.
| Source of cells | |||
|---|---|---|---|
| Patient number | Surface marker | Liver biopsya | Extracted lymphocytesb |
| 8 | CD3 | 86 | 91 |
| CD4 | 37 | 31 | |
| CD8 | 65 | 57 | |
| DR | ND | ND | |
| 10 | CD3 | 94 | 73 |
| CD4 | 35 | 25 | |
| CD8 | 60 | 50 | |
| DR | 58 | 48 | |
| 2 | CD3 | 94 | ND |
| CD4 | 62 | ND | |
| CD8 | 24 | ND | |
| DR | 65 | ND | |
| 1 | CD3 | 93 | ND |
| CD4 | 58 | ND | |
| CD8 | 27 | ND | |
| DR | 45 | ND | |
| 14 | CD3 | 86 | ND |
| CD4 | 66 | ND | |
| CD8 | 9 | ND | |
| DR | 65 | ND | |
Liver-biopsy bulk cultured cells.
Bulk extracted cells from hepatectomy.
Allospecificity of Infiltrating Allograft T Cells in Secondary Proliferation
The alloreactivity of biopsy-grown lymphocytes was determined in secondary proliferation assays (PLT). Table 3 shows the proliferative responses of biopsy-cultured lymphocytes to irradiated spleen cells from the transplant donor and also to exogenous IL-2 in 3-day assays.
TABLE 3. Proliferative responses vs. histology.
| Liver biopsy | Days in culture | Proliferative responses (CPM ± S.D.) | Cause of graft dysfunction | ||
|---|---|---|---|---|---|
| Background | Exogenous IL-2 | Donor stimulated | |||
| 1.7A | 12 | 452 ± 62 | 19,581 ± 1,536 | 27,472 ± 2,741 | moderate rejection |
| 3.32A | 14 | 2,097 ± 1,608 | 13,413 ± 1,395 | 17,120 ± 1,119a | mild rejection |
| 5.300B | 12 | 825 ± 92 | 8,614 ± 365 | 9,404 ± 1,466 | mild rejection |
| 6.73A | 10 | 303 ± 65 | 15,870 ± 908 | 16,223 ± 827a | severe rejection |
| 7.5A | 14 | 858 ± 114 | 11,867 ± 1,453 | 9,334 ± 1,757 | moderate rejection |
| 8.9A | 9 | 708 ± 60 | 2,556 ± 50 | 4,008 ± 380 | severe rejection |
| 8.13A | 7 | 916 ± 191 | 15,215 ± 71 | 27,738 ± 1,989 | moderate rejection |
| 9.9A | 12 | 222 ± 23 | 7,730 ± 306 | 1,8941 ± 959 | severe rejection |
| 9.11B | 12 | 2,210 ± 335 | 34,678 ± 1,556 | 22,896 ± 1,900 | moderate rejection |
| 9.39B | 8 | 1,211 ± 152 | 9,299 ± 93 | 21,547 ± 1,544a | severe rejection |
| 10.59B | 4 | 614 ± 194 | 30,713 ± 1,209 | 18,067 ± 911 | severe rejection |
| 13.5A | 10 | 939 ± 75 | 14,981 ± 884 | 8,448 ±115 | early rejection? |
| 13.28B | 7 | 4,447 ± 194 | 55,395 ± 1,694 | 125,294 ± 1,972 | ischemic injury |
| 2.16A | 21 | 257 ± 35 | 10,189 ± 744 | 2,774 ± 1,119a | ischemic injury |
| 4.12A | 10 | 411 ± 112 | 8,536 ± 170 | 728 ± 117 | mild rejection |
| 11.3A | 15 | 1,118 ± 11 | 24,420 ± 606 | 2,690 ± 1,454 | ischemic injury |
| 12.3A | 18 | 631 ± 145 | 25,755 ± 3,149 | 865 ± 442 | yeast infection |
| 14.30A | 21 | 187 ± 5 | 9,775 ± 15 | 593 ± 64 | moderate rejection |
Donor cell not available, maximum stimulation with panel cell.
All cultured lymphocytes exhibited low spontaneous thymidine incorporation and high proliferative responses to IL-2 suggesting the presence of activated T cells with receptors for Il-2 (Table 3). The majority of expanded lymphocytes also showed strong proliferative responses to original donor lymphocytes. However, five biopsy-grown lymphocyte cultures expressed little or no PLT reactivity towards donor cells (LB2.16A, LB4.12A, LB11.3A, LB12.3A, and LB14.30A). When the phenotypes of these cultured T cells were correlated with donor-specific proliferation, no correlation between a predominance of CD8 bearing cells (“suppressor/cytotoxic” subset) and a lack of proliferation could be found.
We next compared the cause of graft dysfunction with the ability of the cultured lymphocytes to proliferate against donor cells. A statistically significant correlation of low donor induced proliferation with ischemic hepatic allograft dysfunction was noted, using the Chi square test for 2 × 2 contigency tables, p < 0.01. Of the five cultures with little PLT reactivity, ischemic injury was the cause of dysfunction in three. In the remainder of cultures that demonstrated strong donor stimulated proliferation, rejection was the cause of graft dysfunction in all but one.
Biopsy-grown lymphocytes were also tested for PLT specificity against a panel of unrelated cells selected to share HLA antigens with the original transplant donor. In many instances, it was possible to determine the allospecificity of these cells. Table 4 summarizes the apparent PLT specificity for those cultured lymphocyte lines that proliferated against donor HLA specificities. Three biopsies had PLT specificities limited to class I antigens, seven were class II specific, whereas three biopsies appeared to contain cells that recognize both class I and II donor antigens. Representative examples of results of the PLT analysis on biopsy-grown lymphocytes from three patients are described below.
TABLE 4. Donor-specificity and cytotoxicity.
| Liver biopsy | PLT alloreactivity | Percent cytotoxicity donor specific |
|---|---|---|
| 1.7B | B53, B44 | 71 |
| 2.16A | undetermined | 18 |
| 3.32A | DR6, DR7 | 2 |
| 4.12A | undetermined | ND |
| 5.330B | DR2, DR5 | −2 |
| 6.73A | DR3, DR6 | ND |
| 7.5A | DR2 | ND |
| 8.9A | B18, B35 | 37 |
| 8.13A | B18, DR5 | 100 |
| 9.9A | B18 | 81 |
| 9.11B | B7, DR4 | ND |
| 9.39B | B7, ?DR4 | ND |
| 10.59B | DR4, MT3 | ND |
| 11.3A | undetermined | 16 |
| 12.3A | undetermined | 18 |
| 13.5A | DR7 | 10 |
| 13.28B | DR3 | 21 |
| 14.3A | undetermined | −5 |
Patient 3
Patient 3, who was HLA typed A24,26; B35,w41; DR3,5; received a liver transplant from a donor who typed as A11,28; B35,w60; DRw6,7. On post-transplant day 32, the patient developed elevated liver enzymes while ultrasound studies indicated normal allograft architecture. The histology of a percutaneous liver biopsy showed subintimal lymphocytic infiltrates in the portal triads consistent with mild rejection.
The PLT specificity of LB3.32A was associated with DRw6 and DR7 antigens; all six positive stimulator cells bore either antigen specificity whereas all of the four negative cells lacked these class II antigens (Figure 2).
FIGURE 2.

PLT specificity of LB3.32A. Tritiated thymidine uptake was determined in 3-day proliferation assays. HLA antigens of the panel cells are listed, those shared with the original donor are underlined. The background count with 10% human AB serum was 2097 ± 1608 (1 SD).
Patient 8
Patient 8, was HLA typed as A24,25; B8,w62; DR1,4 and had received a liver from a donor with HLA antigens A3,24; B18,35; DR5,-. The patient developed elevated liver function tests 9 days post-transplant. A percutaneous liver biopsy showed a lymphocytic portal infiltration pattern consistent with moderate to severe rejection. Lymphocytes grown from biopsy LB8.9A showed PLT specificity associated with HLA B18 and B35, both class I antigens. Seven out of eight positive stimulator cells had either the B18 or B35 antigen while only one of seven negative stimulator cells bore either antigen. In addition, only three of seven stimulator cells typed as DR5 were positive in this PLT assay, indicating weak reactivity to this specificity (Table 5).
TABLE 5. PLT reactivity of liver biopsies from patient #8.
| HLA type | LB 8.9A (CPM) |
LB 8.13A (CPM) |
|||||
|---|---|---|---|---|---|---|---|
| A | A | B | B | DR | DR | ||
| 3 | 24 | 18 | 35 | 5 | — | 4,008a | 27,738 |
| 29 | 24 | 44 | 35 | 5 | 7 | 8,022 | 4,490 |
| 2 | 31 | 18 | 60 | 4 | — | 1,920 | 25,821 |
| 1 | 2 | 18 | 27 | 4 | 6 | 7,898 | 7,758 |
| 2 | — | 50 | 35 | 7 | — | 4,600 | ND |
| 26 | 30 | 49 | 35 | 6 | 8 | 7,998 | ND |
| 26 | 11 | 18 | 41 | 5 | 2 | 4,879 | 14,011 |
| 2 | 3 | 62 | 35 | 5 | — | 720 | 3,510 |
| 1 | 2 | 8 | 44 | 5 | 3 | 1,034 | 4,649 |
| 1 | 30 | 13 | 51 | 5 | 2 | 123 | 8,050 |
| 3 | 26 | 14 | 51 | 5 | 1 | 387 | 6,640 |
| 2 | 3 | 44 | 62 | 4 | — | 402 | 1,553 |
| 11 | 24 | 60 | — | 2 | — | 145 | 2,003 |
| 2 | 11 | 7 | 44 | 2 | 7 | 355 | 3,008 |
| 31 | — | 13 | 60 | 4 | 7 | ND | 1,267 |
| 2 | 24 | 7 | 49 | 2 | 4 | ND | 809 |
Positive stimulators are underlined (see statistical analysis for calculations).
In spite of aggressive immunosuppression the patient had continued clinical deterioration requiring allograft hepatectomy followed by retransplantation 4 days later. Fragments of the first donor liver (LB8.13A) were incubated under conditions similar to the initial biopsy and the expanded cells were tested against the same panel of cells. Histologically, the portal infiltrate appeared less extensive but a residium of lymphocytes and macrophages was noted, consistent with resolving rejection. As shown in Table 5, specificities to which these cells reacted towards were B18 and DR5. All four B18 positive stimulator cells and all seven DR5 positive panel cells stimulated T cells expanded from this biopsy, whereas five of five B18 and DR5 negative panel cells failed to do so. Thus it appears that within the interim, acquisition of DR5 reactivity appeared.
Patient 9
Patient 9, typed as A2,-; B35,w62; DR5,w6; received a first allograft from an A26,11; B18,w41; DR2,5 donor. Following initial satisfactory function, elevation of the serum bilirubin 5 days post-transplant necessitated a percutaneous liver biopsy for diagnosis. Histologically, there was no portal infiltrate and no lymphocytes could be grown from the biopsy. Four days later, however, because of increasing liver dysfunction, an allograft hepatectomy was performed. At this time, histologically there was moderate portal tract infiltrates with biliary epithelial damage and subendothelial collection of lymphocytes. Immunohistochemical staining showed T-cell infiltration with both CD4 and CD8 positive cells. In addition, there was expression of DR antigens on biliary and vascular epithelium, consistent with rejection [26]. Cells grown from this sample (LB9.9A) demonstrated marked proliferation in three of four B18 positive panel cells. No other donor specificity could be detected in all ten B18 negative cells which shared other donor-specific antigens (Figure 3).
FIGURE 3.
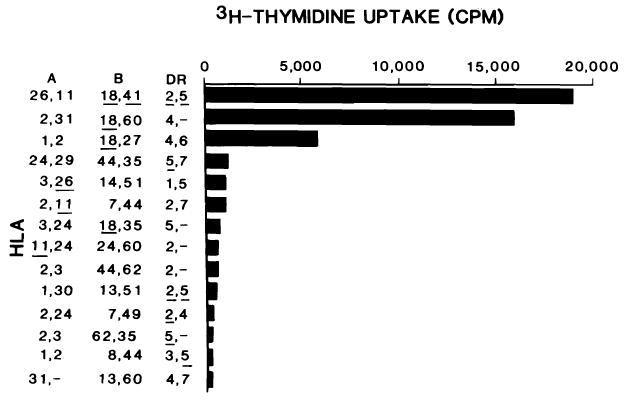
PLT specificity of LB9.9A. Legend is the same as for Figure 2. The background count was 222 ± 23 (1 SD).
The second donor was typed as A2,24; B7,49; DR2,4. Again, after initial function, deterioration of liver function occurred. A percutaneous liver biopsy (LB9.11B) was done 11 days after the second transplant revealed severe cholestasis with moderate portal lymphocyte infiltration and evidence of bile duct injury. T cells were expanded from this biopsy and as shown in Table 6; allospecificity was determined to be against DR4 and possibly B7. Nine of the nine stimulator cells bearing these antigens induced proliferation of the biopsy cultured T cells in PLT. None of the five DR4 or B7 negative cells induced proliferation in this cell line. We found only slight PLT reactivity of LB9.11B cells towards cells from the first transplant donor (donor A).
TABLE 6. PLT reactivity of liver biopsies from patient #9 (second graft).
| HLA type | LB 9.11B (CPM) |
LB 9.39B (CPM) |
|||||
|---|---|---|---|---|---|---|---|
| A | A | B | B | DR | DR | ||
| 2a | 24a | 7a | 49a | 2a | 4a | 22,896 | ND |
| 25 | — | 13 | 44 | — | 4 | 72,029 | 4,754 |
| 2 | 1 | 18 | 27 | 6 | 4 | 57,349 | 28,705 |
| 2 | — | 44 | 60 | 5 | 4 | 48,165 | ND |
| 1 | — | 58 | 55 | 7 | 4 | 45,854 | ND |
| 2 | 3 | 35 | — | 5 | 4 | 39,624 | 4,494 |
| 29 | 31 | 7 | 60 | 7 | 4 | 12,378 | 21,070 |
| 2 | 29 | 7 | — | 8 | 4 | ND | 21,547 |
| 2 | 11 | 7 | 44 | 2 | 7 | 15,116 | 23,830 |
| 2 | 1 | 7 | 62 | 3 | 7 | 8,414 | 7,297 |
| 2 | 28 | 7 | 44 | 2 | 4 | ND | 1,537 |
| 3 | 24 | 7 | 35 | 6 | 7 | ND | 756 |
| 2 | 24 | 35 | 62 | 6 | 7 | ND | 4,836 |
| 2 | 11 | 44 | 51 | 2 | 8 | ND | 4,638 |
| 26b | 11b | 18b | 41b | 2b | 5b | 7,030 | 21,041 |
| 2 | — | 57 | — | 6 | 7 | 4,185 | ND |
| 1 | — | 8 | 57 | — | 7 | 3,405 | ND |
| 2 | 3 | 62 | 35 | 5 | — | 2,756 | ND |
| 24 | 29 | 44 | 35 | 5 | 7 | 2,000 | ND |
| 3 | 24 | 18 | 35 | 5 | — | 4,620 | ND |
Second donor.
First donor.
Both first and second donor positive stimulators are underlined.
Finally, after 39 days following the second transplant, in spite of vigorous efforts to reverse rejection, another allograft hepatectomy with retransplantation was required for intractible rejection, as verified by histology. Cells grown from this sample (LB9.39B) were tested in PLT and revealed a similar pattern to cells obtained 4 weeks earlier, although a broader reactivity pattern was noted from the latter liver sample (Table 6).
Monoclonal Antibody Inhibition Profiles in PLT
A panel of defined monoclonal anti-HLA antibodies were used to inhibit proliferation of cultured biopsy lymphocytes towards irradiated donor stimulator cells. As shown in Table 7, the alloreactivity of the biopsy-cultured cells, as determined by immunogenetic analysis, was verified by blocking experiments with these MoAbs. Addition of the class I specific MoAb, PA2.6, to cells grown from LB1.7B (with PLT specificity towards class I donor antigens) resulted in a 51.7% reduction of donor-stimulated proliferation. In contrast, none of the class II specific MoAbs significantly inhibited LB1.7B proliferation.
TABLE 7. Monoclonal antibody inhibition profiles of the cultured cells.
| MoAbsa | |||||
|---|---|---|---|---|---|
| Class I | Class II | ||||
| Biopsy cells | PA2.6 | SG157 | SG465 | L243 | Leu 10 |
| LB1.7B | 51.7 | ND | −10.2 | 6 | −6 |
| LB7.5A | 8.3 | 64.1 | 62.9 | 33 | 42.2 |
| LB13.28B | −9.3 | 74.5 | 43.3 | 49.1 | 18.5 |
Expressed as percent inhibition of maximum donor stimulation.
The fine degree of discrimination of these MoAbs was also evident in the inhibition profiles of LB7.5A and LB13.28B, both of which demonstrated class II reactivity by PLT analysis. Cultured cells from both biopsies were not inhibited by PA2.6, while significant inhibition of proliferation was observed with the class II specific MoAbs.
Donor-Specific T-Cell Mediated Cytotoxicity
In several instances, CML assays were used to assess the ability of expanded biopsy-cultured T cells to lyse donor targets. Using PHA transformed T lymphoblasts and/or EBV-transformed B lymphoblastoid cell lines (derived from original donor spleen cells) as targets, cytotoxcity was determined at a 10:1 effector/target ratio. As shown in Table 4, several T-cell lines demonstrated significant cytotoxicity towards donor specificities. In general, those lines showing significant cytotoxicity in this assay correlated to class I antigen induced proliferation in PLT assays.
In patient M.S., LB13.28B, in vitro expanded intragraft T cells demonstrated DR3 allospecificity in PLT assay. The recipient was HLA typed as A1,24; B35,w55; DR2,5 while the donor typed as A1,2; B51,8; DR3,7. CML assay showed 21% cytolysis of EBV-transformed donor cells which correlated with CML specificity against the DR3 antigen. There was a much lower level of lympholysis against the PHA-transformed donor lymphoblast line (8%) and a significant lympholysis (32%) against another DR3 positive lymphoblastoid cell line (Figure 4). Therefore, while the general rule that class I antigens serve as targets for cell mediated lympholysis, class II antigens can also serve as recognition structures for cell-mediated lympholysis [41,42].
FIGURE 4.

HLA antigens of the panel cells are listed; those shared with the original donor are underlined. Lymphocytes incubated with PHA-M for 4 days prior to testing are designated as PHA targets. EBV targets are splenocytes that were originally transformed with EBV.
Discussion
We describe methodologies based upon our previous experiences allowing expansion and characterization of intragraft T-cell populations in hepatic allografts [23]. The rationale behind our approach is based on acquisition of IL-2 receptors during activation [43], and the subsequent requirement of IL-2 for further propagation [44]. In order to minimize introducing new antigen specificities, we used only lectin-free IL-2 without feeder cells to isolate and expand the infiltrating cell population. In two instances, these cells exhibited the same phenotypic makeup of cells obtained in situ.
When the phenotypic makeup of these biopsy bulk cultured cells were compared to the allospecificity of these cells, there did not appear to be a consistent pattern relating the predominance of either CD4 or CD8 to the HLA class I or class II specificity. This may reflect two possibilities, (i) that CD4 and CD8 positive cells are not restricted by HLA class I or class II antigens or (ii) that the cultured T-cell line represents a mixture of cells and only a small subpopulation of the expanded cells are responsible for allospecificity. Generally CD4 alloreactive cells recognize class II antigens whereas CD8 alloreactive cells recognize class I antigens; however, exceptions have recently been reported [45–47]. On the other hand, we have preliminary data, using limiting dilution analysis of these cells, that demonstrates that a proportion of activated T cells do not proliferate to donor HLA antigens. This suggests that only a subpopulation of the total biopsy-cultured cells recognize HLA determinants.
Kurnick and co-workers, using a similar approach, have recently reported their results characterizing expanded T cells from rejecting renal allograft from patients on azathioprine and prednisone immunosuppression [22]. Phenotypic analysis of their cell lines showed a predominance of cells bearing the CD8 phenotype, although they also noted that in one patient treated with cyclosporine, that the CD4 and CD8 populations were almost equal. The differences in the immunosuppression regimens may indeed explain the more frequent expression of CD4 populations in our series, and has been noted in other human allograft models [26,48,49].
We have shown, by immunogenetic analysis, that both class I and class II HLA determinants can serve as recognition antigens. In several instances, these PLT findings were verified by monoclonal anti-HLA antibody inhibition profiles. In our previous studies with alloreactive T-cell clones [32], we have shown that both proliferative and cytotoxicity assays can define allospecificity to either class I or class II antigens and correlated well with monoclonal anti-HLA antibody inhibition profiles. Proliferative responses to class I antigens, where the donor and recipient are DR identical, were noted by Mayer et al. [22]. In addition, we present evidence suggesting that the same HLA antigenic determinant can serve as the recognition structure for both proliferation and cytolysis. This has been confirmed in vitro MLR generated cloned T-cell lines [43].
Analysis of in situ generated allospecific T-cell lines from the initial and subsequent allografts during rejection has shown that allorecognition and infiltration of T cells is specific and dynamic in nature. We have shown that there may be acquisition of additional antigen specificities during unsuccessful treatment of rejection. This is in agreement with the observations on acquisition and loss of donor specificities in our previous reports studying heart allografts [23]. Following hepatectomy of the initial graft containing cells with specificity towards the first donor, subsequent allografts appear to have an influx of cells bearing specificity towards the donor antigens of that respective graft. Late in rejection, however, nonspecific mechanisms may attract “irrelevant” cells [7].
It is interesting to speculate on the role and antigen specificity of culture expanded intragraft T cells that do not proliferate to donor HLA antigens nor lyse appropriate targets bearing donor HLA antigens. The finding that non-HLA alloantigens, e.g., tissue-specific [50] and vascular endothelial cell or VEC [50–52] antigens, can participate in allograft rejection, has been demonstrated. Unlike the HLA system, definition of the majority of these non-HLA have been elusive, so that their importance in allograft rejection is not clearcut. Nevertheless, once appropriate donor cell preparations can be obtained bearing the antigen system in question, application of the techniques described in this paper can begin to shed light on their relative role in allorecognition.
Acknowledgments
The authors would like to thank the Pittsburgh Transplant Foundation for their invaluable aid in donor sample procurement. We also would like to thank Christina Kaufman, Loretta DiVecchia, Daniel Graziano, Ellen Hamill, and David Bockstoce for their expert technical help. We thank the following individuals for their generous gifts of monoclonal anti-MHC antibodies, Drs. Sanna Goyert, Jack Silver (Cornell University, New York, NY), and Peter Parham (Stanford University, Palo Alto, CA).
Abbreviations
- IL-2
Interleukin-2
- MHC
major histocompatibility complex
- HLA
human leucocyte antigen
- PHA
phytohemagglutin-M
- EBV
Epstein-Barr virus
- LCL
lymphoblastoid cell line
- TCM
tissue culture medium
- VEC
vascular endothelial cell
- MoAb
monoclonal antibodies
Footnotes
Supported by Grants AI-21410 and AI-18923 from NIAID, Grant AA93 from United Way Health Research Service Foundation, Grant AM-29961, and a grant from the Competitive Medical Research Fund—Richard King Mellon Foundation.
The nomenclature CD3, CD4, and CD8 refer to T3, T4, and T8, respectively, according to the 1984 report by the Committee on Human Leucocyte Differentiation Antigens: IUIS/WHO Nomenclature Subcommittee [10].
Note added in proof: Since submission of the manuscript, we have become aware of further evidence to substantiate our findings. Dr. James Kurnick and coworkers (Boston, MA) have similarly found a preponderance of CD4 positive cells in biopsy grown T cells from liver transplant patients on cyclosporine (as compared to a preponderance of CD8 cells from renal transplant patients on azathioprine).
References
- 1.Shaw BW, Starzl TE, Iwatsuki S, Gordon RD. An overview of orthotopic transplantation of the liver. In: Flye W, editor. Principles of organ transplantation. Philadelphia: W.B. Saunders; 1985. [Google Scholar]
- 2.Iwatsuki S, Shaw BW, Starzl TE. Current status of hepatic transplantation. Semin Liver Dis. 1983;3:173. doi: 10.1055/s-2008-1040683. [DOI] [PMC free article] [PubMed] [Google Scholar]
- 3.Iwatsuki S, Shaw BW, Starzl TE. Five year survival after liver transplantation. Transplant Proc. 1985;17:259. [PMC free article] [PubMed] [Google Scholar]
- 4.Starzl TE, Iwatsuki S, Shaw BW, Gordon RD. Orthotopic liver transplantation in 1984. Transplant Proc. 1985;17:250. [PMC free article] [PubMed] [Google Scholar]
- 5.Iwatsuki S, Rabin BS, Shaw BW, Starzl TE. Liver transplantation against T cell-positive warm crossmatches. Transplant Proc. 1984;16:1427. [PMC free article] [PubMed] [Google Scholar]
- 6.Houssin DS, Gugenheim J, Bellon B, et al. Absence of hyperacute rejection of liver allografts in hypersensitized rats. Transplant Proc. 1985;17:293. [Google Scholar]
- 7.Hayry P, Von Willebrand E, Parthenais E, et al. The inflammatory mechanisms of allograft rejection. Immunol Rev. 1984;77:1985. doi: 10.1111/j.1600-065x.1984.tb00719.x. [DOI] [PubMed] [Google Scholar]
- 8.Harty JT, So SKS, Keller GA, Hoffman R, Ascher NL, Simmons RL. Immunospecific lymphocyte-mediated injury of isolated hepatocytes. Transplant Proc. 1985;17:606. [Google Scholar]
- 9.Hancock WW. Analysis of intragraft effector mechanisms associated with human renal allograft rejection: immunohistological studies with monoclonal antibodies. Immunol Rev. 1984;77:61. doi: 10.1111/j.1600-065x.1984.tb00718.x. [DOI] [PubMed] [Google Scholar]
- 10.Bernard A, Bernstein I, Boumsell L, et al. Nomenclature for clusters of differentiation antigens defined on human leucocyte populations. Committee on human leucocyte differentiation antigens: IUIS/WHO nomenclature subcommittee. Disease Markers. 1984;2:443. [Google Scholar]
- 11.Kolbeck PC, Tatum AH, Sanfilippo F. Relationships among the histologic pattern, intensity, and phenotypes of T cells infiltrating renal allografts. Transplantation. 1984;38:709. doi: 10.1097/00007890-198412000-00032. [DOI] [PubMed] [Google Scholar]
- 12.Hoshinaga K, Mohanakumar T, Goldman MH, et al. Clinical significance of in situ detection of T lymphocyte subsets and monocyte/macrophage lineages in heart allografts. Transplantation. 1984;38:634. doi: 10.1097/00007890-198412000-00017. [DOI] [PubMed] [Google Scholar]
- 13.Stelzer GT, McLeish KR, Lorden RE, Watson SL. Alterations in T lymphocyte subpopulations associated with renal allograft rejections. Transplantation. 1984;37:261. doi: 10.1097/00007890-198403000-00009. [DOI] [PubMed] [Google Scholar]
- 14.Fiche M, Soulillou JP, Bignon JD, Billaudel S, Guenel J. T lymphocyte monitoring in kidney transplant recipients undergoing cytomegalovirus infection or rejection episodes. Transplantation. 1984;37:421. doi: 10.1097/00007890-198404000-00023. [DOI] [PubMed] [Google Scholar]
- 15.Burdick JF, Beschorner WE, Smith WJ, et al. Lymphocytes in early renal allograft biopsies. Transplant Proc. 1985;17:562. [Google Scholar]
- 16.Burdick JF, McGraw D, Bender W, Beschorner WE, Williams GM, Solez K. Renal allograft infiltrate in the absence of rejection. Transplant Proc. 1984;16:1580. [PubMed] [Google Scholar]
- 17.Tilney NL, Kupiec-Weglinski JW, Heidecke CD, Lear PA, Strom TB. Mechanisms of rejection and prolongation of vascularized organ allografts. Immunol Rev. 1984;77:185. doi: 10.1111/j.1600-065x.1984.tb00722.x. [DOI] [PubMed] [Google Scholar]
- 18.Roberts PJ, Hayry P. Effector mechanisms in allograft rejection. I. Assembly of sponge-matrix allografts. Cell Immunol. 1976;26:160. doi: 10.1016/0008-8749(76)90360-9. [DOI] [PubMed] [Google Scholar]
- 19.Ascher NL, Ferguson RM, Hoffman RA, Simmons RL. Partial characterization of cytotoxic cells infiltrating sponge-matrix allografts. Transplantation. 1979;27:254. doi: 10.1097/00007890-197904000-00010. [DOI] [PubMed] [Google Scholar]
- 20.Kim B, Rosenstein M, Weiland D, Eberlein TJ, Rosenberg SA. Clonal analysis of the lymphoid cells mediating skin allograft rejection. Mediation of graft rejection in vivo by cloned Lyt-1 + 2- proliferative, noncytotoxic long term cell lines. Transplantation. 1983;36:525. doi: 10.1097/00007890-198311000-00011. [DOI] [PubMed] [Google Scholar]
- 21.Moreau JF, Vie H, Peyrat MA, Soulillou JP. Function and cell surface markers of cloned T lymphocytes obtained from rejected human kidney allografts. Transplant Proc. 1985;17:810. [Google Scholar]
- 22.Mayer TG, Fuller AA, Fuller TC, Lazarovits AI, Boyle LA, Kurnick JT. Characterization of in vivo-activated allospecific T lymphocytes propagated from human renal allograft biopsies undergoing rejection. J Immunol. 1985;134:258. [PubMed] [Google Scholar]
- 23.Zeevi A, Fung JJ, Zerbe TR, et al. Allospecificity of activated T cells grown from endomyocardial biopsies from heart transplant patients. Transplantation. doi: 10.1097/00007890-198605000-00014. in press. [DOI] [PubMed] [Google Scholar]
- 24.Thompson JF, Carter NP, Bolton EM, McWhinnie DL, Wood RFM, Morris PJ. The composition of the lymphocytic infiltrate in rejecting human renal allografts is not reflected by lymphocyte subpopulation in the peripheral blood. Transplant Proc. 1985;17:556. [Google Scholar]
- 25.Fung JJ, Demetris AJ, Porter KA, et al. Use of OKT3 with cyclosporine and steroids for reversal of acute kidney and liver allograft rejection. Surg Gynecol Obstet. doi: 10.1159/000184431. submitted. [DOI] [PMC free article] [PubMed] [Google Scholar]
- 26.Demetris AJ, Lasky S, Van Thiel DH, Starzl TE, Whiteside T. Induction of DR/Ia antigen in human liver allografts: an immunocytochemical and clinicopathologic analysis of 20 failed grafts. Transplantation. doi: 10.1097/00007890-198511000-00007. in press. [DOI] [PMC free article] [PubMed] [Google Scholar]
- 27.Demetris AJ, Lasky S, Van Thiel DH, Starzl TE, Dekker A. Pathology of hepatic transplantation: a review of 62 adult allograft recipients immunosuppressed with a cyclosporine/steroid regimen. Am J Pathol. in press. [PMC free article] [PubMed] [Google Scholar]
- 28.Snover DC, Sibley RK, Freese DK, et al. Orthotopic liver transplant rejection: a pathological study of 63 serial liver biopsies from 17 patients with special reference to the diagnostic features and natural history of rejection. Hepatology. 1984;4:1212. doi: 10.1002/hep.1840040620. [DOI] [PubMed] [Google Scholar]
- 29.Thorley-Lawson DA, Chess L, Strominger JL. Suppression of in vitro Epstein-Barr virus infection. A new role for human T lymphocytes. J Exp Med. 1977;146:495. doi: 10.1084/jem.146.2.495. [DOI] [PMC free article] [PubMed] [Google Scholar]
- 30.Zeevi A, Scheffel C, Annen K, Bass G, Marrari M, Duquesnoy RJ. Association of the PLT specificity of alloreactive lymphocyte clones with HLA-DR, MB and MT determinants. Immunogenetics. 1982;16:209. doi: 10.1007/BF00343310. [DOI] [PubMed] [Google Scholar]
- 31.Zeevi A, Annen K, Scheffel C, Duquesnoy RJ. Detection of non-HLA-DR determinants by alloreactive lymphocyte clones. Hum Immunol. 1983;6:97. doi: 10.1016/0198-8859(83)90066-6. [DOI] [PubMed] [Google Scholar]
- 32.Zeevi A, Duquesnoy RJ. Specificity of alloactivated human T lymphocyte clones in secondary proliferation, cell-mediated lympholysis and interleukin-2 release. J Immunogenet. 1985;12:17. doi: 10.1111/j.1744-313x.1985.tb00826.x. [DOI] [PubMed] [Google Scholar]
- 33.Goyert SN, Silver J. Further characterization of HLA-DS molecules: implications for studies assessing the role of human Ia molecules in cell interactions and disease susceptibility. Proc Natl Acad Sci USA. 1983;80:5719. doi: 10.1073/pnas.80.18.5719. [DOI] [PMC free article] [PubMed] [Google Scholar]
- 34.Lampson LA, Levy R. Two populations of Ia-like molecules on a human B cell line. J Immunol. 1980;125:293. [PubMed] [Google Scholar]
- 35.Bono MR, Strominger JL. Direct evidence of homology between human DC-1 antigens and murine I-A molecules. Nature. 1982;299:836. doi: 10.1038/299836a0. [DOI] [PubMed] [Google Scholar]
- 36.Brodsky FM. A matrix approach to human class II histocompatibility antigens: reactions of four monoclonal antibodies with the products of nine haplotypes. Immunogenetics. 1984;19:179. doi: 10.1007/BF00364762. [DOI] [PubMed] [Google Scholar]
- 37.Brodsky FM, Parham P, Barnstable CJ, Crumpson MJ, Bodmer WF. Monoclonal antibodies for analysis of the HLA system. Immunol Rev. 1979;47:3. doi: 10.1111/j.1600-065x.1979.tb00288.x. [DOI] [PubMed] [Google Scholar]
- 38.Brodsky FM, Parham P. Monomorphic anti-HLA-A,B,C monoclonal antibodies detecting molecular subunits and combinatorial determinants. J Immunol. 1982;128:129. [PubMed] [Google Scholar]
- 39.Paradis IL, Merral E, Krell J, Dauber JH, Rogers RM, Rabin BS. Lymphocyte enumeration by flow cytometry and by a modified avidin-biotin-immunoperoxidase system. J Histochem Cytochem. 1984;32:358. doi: 10.1177/32.4.6368677. [DOI] [PubMed] [Google Scholar]
- 40.van Es A, Baldwin WM, Oljans PJ, Tanke HJ, Ploem JS, van Es LA. Expression of HLA-DR on T lymphocytes following renal transplantation, and association with graft-rejection episodes and cytomegalovirus infection. Transplantation. 1984;37:65. doi: 10.1097/00007890-198401000-00018. [DOI] [PubMed] [Google Scholar]
- 41.Zeevi A, Duquesnoy RJ. Recognition of major histocompatibility complex gene products by human alloreactive T cell clones. In: von Boehmer H, Haas W, editors. T cell clones. Amsterdam: Elsevier; 1985. [Google Scholar]
- 42.Zeevi A, Duquesnoy RJ. Correlation between PLT and CML specificity of alloreactive T cell clones. In: Albert ED, et al., editors. Histocompatibility testing, 1984. Berlin: Springer-Verlag; 1984. [Google Scholar]
- 43.Palacios R. Mechanisms of T-cell activation; role and functional relationship of HLA DR antigens and interleukins. Immunol Rev. 1982;63:73. doi: 10.1111/j.1600-065x.1982.tb00412.x. [DOI] [PubMed] [Google Scholar]
- 44.Depper JM, Leonard WJ, Robb RJ, Waldman TA, Green WC. Blockade of the interleukin-2 receptor by anti-Tac antibody: Inhibition of human lymphocyte activation. J Immunol. 1983;131:690. [PubMed] [Google Scholar]
- 45.Jeannet M, Chardonnens X. HLA Class II-directed alloproliferative and cytotoxic T cell clones may have the T4 or T8 phenotype. Transplant Proc. 1985;17:714. [Google Scholar]
- 46.Strassman G, Bach FH. OKT4 + cytotoxic T cells can lyse targets via Class I molecules and can be blocked by monoclonal antibody against T4 molecules. J Immunol. 1984;133:1705. [PubMed] [Google Scholar]
- 47.Spits H, Yssel H, Voordouw A, de Vries JE. The role of T8 in the cytotoxic activity of cloned cytotoxic T lymphocyte lines specific for Class II and Class I major histocompatibility complex antigens. J Immunol. 1985;134:2294. [PubMed] [Google Scholar]
- 48.Weintraub D, Masek M, Billingham ME. The lymphocyte subpopulations in cyclosporine-treated human heart rejection. Heart Transplant. 1985;4:213. [PubMed] [Google Scholar]
- 49.Marboe CC, Schierman SW, Rose E, Reemtsma K, Fenoglio JJ. Characterization of mononuclear cell infiltrates in human cardiac allografts. Transplant Proc. 1984;16:1598. [PubMed] [Google Scholar]
- 50.Steinmuller D. Tissue-specific and tissue-restricted histocompatibility antigens. Immunol Today. 1984;5:234. doi: 10.1016/0167-5699(84)90096-3. [DOI] [PubMed] [Google Scholar]
- 51.Cerilli J, Brasile L, Galouzis T, Lempert N, Clarke J. The vascular endothelial cell antigen system. Transplantation. 1985;39:286. doi: 10.1097/00007890-198503000-00016. [DOI] [PubMed] [Google Scholar]
- 52.Pober JS, Gimbrone MA, Collins T, et al. Interactions of T lymphocytes with human vascular endothelial cells: Role of endothelial cells surface antigens. Immunobiology. 1984;168:483. doi: 10.1016/s0171-2985(84)80132-1. [DOI] [PubMed] [Google Scholar]