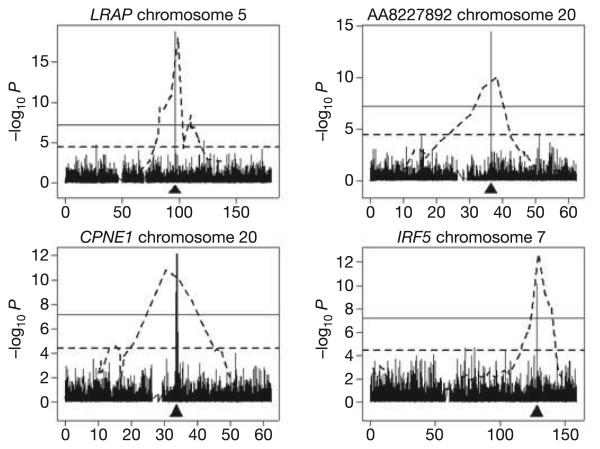
Figure 2. Results of genome-wide linkage analysis (dotted line) superimposed on those from genome-wide association (bars) for the chromosome where the expressed gene is located.
The location of the expressed gene is indicated by an arrow. The dotted horizontal line is for data from linkage scans and corresponds to t = 4, P = 3.7 × 10⁻⁵. The solid horizontal line is for data from GWA and corresponds to P = 0.05 after Šidák correction. The x axis indicates chromosome location in megabases.

