

Abstract
Background
The Dietary Approaches to Stop Hypertension (DASH) diet is recommended in the 2005 US Dietary Guidelines. To understand the potential benefits of DASH on coronary heart disease (CHD), we applied the Framingham risk equations to calculate 10-year risk of developing CHD using data from the DASH trial.
Methods and Results
In the DASH trial, 459 individuals with prehypertension or stage-1 hypertension not taking antihypertensive medication were randomly assigned to 1 of 3 diets: control, fruits and vegetables (F/V), or DASH (rich in fruits, vegetables, low-fat dairy, and reduced in fats and cholesterol). Weight was held constant. Estimated 10-year CHD risk was the primary outcome of this secondary analysis. Among 436 participants with complete data, mean (SD) age was 44.7 (10.7) years, 51% were male, and 60% were African-American. Median 10-year CHD risk was 0.98% at baseline and decreased in all groups. Compared with control, the relative risk ratio comparing 8-week with baseline 10-year CHD risk was 0.93 (95% confidence interval, 0.85 to 1.02; P=0.12) for F/V and 0.82 (95% confidence interval, 0.75 to 0.90; P<0.001) for DASH. Comparing DASH with F/V, the relative risk ratio was 0.89 (95% confidence interval, 0.81 to 0.97; P=0.012). With the exception of an interaction between dietary pattern and race suggesting a greater risk reduction in blacks than whites (P for interaction=0.038), results were similar across subgroups.
Conclusions
Compared with control and F/V, the DASH diet reduced estimated 10-year CHD risk by 18% and 11%, respectively. In addition to reducing blood pressure, the DASH diet should substantially reduce the risk of CHD.
Clinical Trial Registration
URL: http://clinicaltrials.gov. Unique identifier: NCT00000544.
Keywords: coronary disease, nutrition, diet
Hypertension is a major independent risk factor for coronary heart disease (CHD).1,2 Initial treatment for hypertension includes lifestyle modification: physical activity, weight loss, and dietary change.2 The Dietary Approaches to Stop Hypertension (DASH) Trial showed that 2 dietary patterns, the DASH and the fruits and vegetables (F/V), significantly decreased blood pressure independent of known determinants of blood pressure, including weight and sodium intake.3 DASH also reduced serum levels of low-density lipoprotein cholesterol; however, it reduced high-density lipoprotein cholesterol and had no effect on triglycerides.4 The net effect on CHD events is uncertain. Because of cost and logistical considerations, dietary intervention trials such as the DASH Trial focus on risk factors instead of clinical outcomes such as CHD events.
The Framingham Heart Study equations5,6 estimate 10-year CHD risk using modifiable risk factors (systolic blood pressure [SBP], total cholesterol, and high-density lipoprotein (HDL) cholesterol) as well as nonmodifiable risk factors (age and sex).5 The beneficial effects of multicomponent weight loss interventions on estimated CHD risk have been reported.7 Given the well-recognized challenges of sustaining weight loss, dietary change alone without weight loss may provide a feasible alternative to reduce CHD risk.
We investigated the effects of changes in dietary patterns on estimated 10-year CHD risk in the DASH Trial.3 We hypothesized that DASH would decrease estimated CHD risk in comparison to the F/V and control diets.
Methods
The DASH Trial was a multicenter, randomized, controlled feeding trial sponsored by the National Heart, Lung, and Blood Institute.8 Main findings have been published.3,8 Institutional review boards at all sites reviewed the protocol, and participants provided informed consent.3,8
Study Participants
DASH Trial participants were at least 22 years of age and were not taking antihypertensive medication.3,8 To be eligible, participants had to have an average SBP <160 mm Hg and an average diastolic blood pressure (DBP) between 80 and 95 mm Hg.3,8 Major exclusion criteria were the following: poorly controlled diabetes mellitus; use of antihypertensive medications or nutritional supplements that could affect BP; unwillingness to modify current diet; significant morbidity that would interfere with participation or assessment; renal insufficiency; hyperlipidemia; cardiovascular event in the last 6 months; body mass index (BMI) >35 kg/m2; cancer or cancer therapy within the last 6 months; anemia; pregnancy or lactation; and excessive alcohol intake (>14 drinks/wk).3,8 Each potential participant completed 3 screening visits and then a 3-week run-in period during which they ate the control diet.
Random Assignment
Interested and eligible participants who completed the 3-week run-in period were then eligible for the 8-week intervention phase, in which individuals consumed 1 of 3 randomly assigned study dietary patterns: control, F/V, or DASH (Figure 1). Randomization was stratified by center and balanced over time.8 Data collection staff were blinded to randomization assignment.3,8
Figure 1.
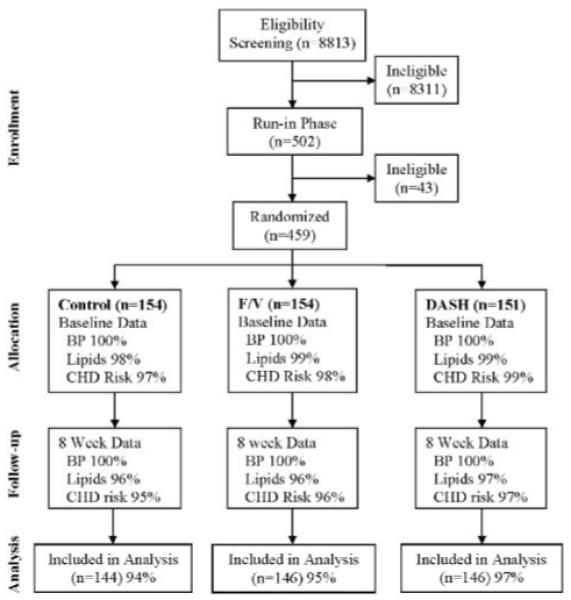
Consort diagram.
Intervention Diets
The control diet was designed to be typical of what many Americans eat; it was low in minerals (potassium, magnesium, and calcium) and high in saturated fat, total fat, and cholesterol.3,8 The F/V diet was rich in fruits and vegetables but was otherwise similar to the control diet. The DASH diet was rich in fruits, vegetables, and low-fat dairy foods and was reduced in saturated fat, total fat, and cholesterol.3,8 The ratio of polyunsaturated fats to saturated fats was similar in control and F/V and higher in DASH.3,8
All diets were prepared in research kitchens and consisted of foods that were commonly available in different forms (fresh, frozen, dried, and canned).3,8 Lunch or dinner was consumed onsite on weekdays.3,8 After their on-site meal, participants were given a cooler with food to be consumed off-site, which included breakfast for the next morning.3,8 On Fridays, participants were given food for all meals to be consumed over the weekend, lasting through breakfast on Monday.3,8 For each day during the study, participants recorded their intake of discretionary items (beverages and salt) as well as any nonstudy foods they may have eaten.3,8 Participants also recorded if they did not finish the study meals.3,8 The intervention phase lasted 8 weeks.3,8
Measurement
All BP measurements were made by study personnel who were trained and certified to measure BP in a standardized fashion.9,10 A random-zero sphygmomanometer was used to obtain 2 BP measurements in the seated position, and the average of these measurements was used as the BP measurement for that day.8 Baseline BP was the average of measurements obtained during screening and run-in phases of the study. End-of-study BP was the average of 5 sets of BP measured during the last 2 weeks of the intervention phase.
Serum samples from each subject were analyzed at certified laboratories at each study site to obtain total and HDL cholesterol measurements at baseline and 8 weeks.8
Statistical Analysis
We used STATA version 10.0 (STATACorp, College Station, Tex) for all analyses. Baseline characteristics were compared among the 3 randomized arms. Counts with proportions are reported for categorical and dichotomous variables. Means with standard deviations (SD) are reported for continuous variables.
Baseline characteristics were compared between dietary pattern intervention groups using ANOVA for continuous variables and the χ2 test for dichotomous and categorical variables. Baseline characteristics were also compared between those with and those without complete data using a t test for continuous variables and the χ2 test for dichotomous and categorical variables.
Estimated 10-year CHD risk at baseline and 8 weeks was calculated for each individual using the Framingham risk equations.5,6 These equations incorporate individual modifiable (systolic blood pressure, total cholesterol, HDL cholesterol, and smoking status) and nonmodifiable factors (age and sex) to estimate 10-year risk of CHD.5,6 Median values of estimated CHD risk were then calculated. Using linear regression, the difference between the logarithm of 10-year CHD risk at 8 weeks and the logarithm of 10-year CHD risk at baseline, the outcome variable, was regressed on intervention dietary pattern (categorical variable), and adjusted for site. Because the Framingham risk estimates were not normally distributed, log transformation was used so that linear regression could be performed. The ratio of estimated 10-year CHD risk at 8 weeks to that at baseline for each diet intervention was calculated and reported as the relative risk. The ratio of these relative risks between 2 different intervention dietary patterns was reported as the relative risk ratio (RRR), as done previously.7 Three pairwise contrasts were of interest: DASH versus control, F/V versus control, and DASH versus F/V.
Because F/V can be considered an “intermediate” dietary pattern between control and DASH,8 the dietary patterns were recoded as an ordered variable, and linear regression was used to test for trend across the dietary patterns.
We performed exploratory analyses to evaluate if the effect of the dietary patterns varied across subgroups defined by baseline variables. These subgroups included race (white or black), age (<60 years and ≥60 years), sex, hypertension status (prehypertensive and hypertensive), baseline 10-year CHD risk (<10% and ≥10%), and baseline total cholesterol (<5.18 mmol/L and ≥5.18 mmol/L). In these models, we included terms for the main effect of the interventions and subgroup and for interactions between these variables and the intervention groups.
A probability value less than 0.05 was considered statistically significant. No adjustment for multiple comparisons was made.
Results
Of the 459 participants randomly assigned in the original DASH Trial, 436 (95%) participants had complete data that allowed for calculation of both baseline and 8-week estimated 10-year CHD risk using the Framingham equations5,6 (Figure 1). At baseline, the DASH arm had a lower mean total cholesterol than the F/V and control arms (Table 1). There were no significant differences in baseline characteristics between participants with complete data and those with missing data (data not shown).
Table 1.
Baseline Characteristics of Participants With Complete Data for Secondary Analysis
| Characteristic | Control (n=144) | F/V (n=146) | DASH (n=146) | All (n=436) |
|---|---|---|---|---|
| Age, median (min, max) | 45 (24, 75) | 45 (21, 70) | 44 (24, 73) | 45 (21, 75) |
| Female, n (%) | 66 (45.8) | 71 (48.6) | 75 (51.4) | 212 (48.6) |
| Ethnicity, n (%) | ||||
| African American | 85 (59.0) | 86 (58.9) | 89 (61.0) | 260 (59.6) |
| White | 53 (36.8) | 52 (35.6) | 47 (32.2) | 152 (34.9) |
| Other | 6 (4.2) | 8 (5.5) | 10 (6.9) | 24 (5.5) |
| BMI, mean (SD), kg/m2 | 27.9 (3.8) | 28.1 (4.0) | 28.6 (4.0) | 28.2 (3.9) |
| Total cholesterol, mean (SD) | 191.4 (33.9) | 194.8 (36.1) | 187.1 (35.4) | 191.1 (35.2) |
| HDL, mean (SD) | 48.1 (14.1) | 47.9 (13.9) | 48.5 (15.6) | 48.2 (14.5) |
| Current smoking, n (%) | 11 (7.6) | 21 (14.4) | 13 (8.9) | 45 (10.3) |
| SBP, mean (SD), mm Hg | 131 (11) | 132 (11) | 131 (10) | 131 (11) |
| DBP, mean (SD), mm Hg | 85 (5) | 85 (5) | 85 (4) | 85 (5) |
| Education, n (%) | ||||
| High school or less | 26 (18.1) | 33 (22.6) | 18 (12.3) | 77 (17.7) |
| Some college | 85 (59.0) | 77 (52.7) | 101 (69.2) | 263 (60.3) |
| Some graduate school | 33 (22.9) | 36 (24.7) | 27 (18.5) | 96 (22.0) |
| Income, n (%) | ||||
| <$30 000 | 89 (61.8) | 81 (55.5) | 93 (63.7) | 263 (61.3) |
| $30 000 to $59 999 | 46 (31.9) | 53 (36.3) | 46 (31.5) | 145 (33.3) |
| ≥$60 000 | 7 (4.9) | 9 (6.2) | 7 (4.8) | 23 (5.3) |
| Unknown | 2 (1.4) | 3 (2.1) | 0 (0.0) | 5 (1.2) |
| Postmenopausal estrogen use, n (%)* | 10 (15.2) | 10 (14.1) | 10 (13.3) | 30 (14.2) |
Percentages are calculated from number of women in each group.
Table 2 displays CVD risk factors at baseline and follow-up as well as between-diet differences in the 436 participants with complete data. Compared with control, the DASH diet lowered systolic BP, diastolic BP, total cholesterol, and LDL cholesterol, but it also lowered HDL cholesterol and had no effect on triglycerides.
Table 2.
CVD Risk Factors [Mean (SD) Baseline, 8-Week, and Change] and Between-Diet Differences in Mean Change [Mean Change (95% Confidence Interval)]
| Control (n=144) |
F/V (n=146) |
DASH (n=146) |
DASH Minus Control | DASH Minus FV | FV Minus Control | |
|---|---|---|---|---|---|---|
| SBP, mm Hg | ||||||
| Baseline | 131 (11) | 132 (11) | 131 (10) | |||
| 8 Weeks | 130 (14) | 128 (13) | 124 (10) | |||
| Change | −1 (6) | −4 (8) | −7 (8) | −6 (−7, −4) | −3 (−5, −1) | −3 (−4, −1) |
| DBP, mm Hg | ||||||
| Baseline | 85 (5) | 85 (5) | 85 (4) | |||
| 8 Weeks | 85 (7) | 83 (8) | 81 (6) | |||
| Change | −1 (5) | −2 (6) | −4 (5) | −3 (−4, −2) | −2 (−3, 0) | −1 (−2, 0) |
| Total cholesterol, mg/dL | ||||||
| Baseline | 191.4 (33.9) | 194.8 (36.1) | 187.1 (35.4) | |||
| 8 Weeks | 194.9 (33.9) | 194.7 (36.2) | 177.6 (31.2) | |||
| Change | 3.49 (25.3) | −0.18 (23.1) | −9.49 (22.1) | −12.98 (−18.48, −7.48) | −9.31 (−14.52, −4.10) | −3.67 (−9.28, 1.94) |
| Total LDL, mg/dL | ||||||
| Baseline | 121.6 (31.7) | 124.4 (32.3) | 117.8 (31.3) | |||
| 8 Weeks | 124.3 (32.6) | 125.2 (32.5) | 110.5 (28.7) | |||
| Change | 2.66 (23.3) | 0.77 (20.4) | −7.33 (20.4) | −9.99 (−15.06, −4.92) | −8.10 (−12.81, −3.39) | −1.89 (−6.96, 3.19) |
| Total HDL, mg/dL | ||||||
| Baseline | 48.1 (14.1) | 47.9 (13.9) | 48.5 (15.6) | |||
| 8 Weeks | 48.3 (13.9) | 47.9 (13.2) | 45.9 (13.2) | |||
| Change | 0.17 (5.3) | 0.034 (6.7) | −3.51 (6.5) | −3.68 (−5.05, −2.31) | −3.54 (−5.07, −2.02) | −0.13 (−1.52, 1.26) |
| Triglycerides | ||||||
| Baseline | 108.4 (55.7) | 112.4 (60.1) | 103.3 (48.7) | |||
| 8 Weeks | 111.7 (55.5) | 107.3 (54.2) | 110.1 (48.3) | |||
| Change | 3.3 (35.5) | −5.1 (38.6) | 6.8 (35.7) | 3.5 (−4.73, 11.72) | 11.9 (3.32, 20.46) | −8.4 (−16.96, 0.17) |
Median 10-year CHD risk was 0.98% at baseline (0.97% in control, 1.15% in F/V, and 0.91% in DASH), indicating an approximately 1% risk of developing CHD within 10 years.
At the end of intervention feeding, estimated CHD risk was reduced in each group (Figure 2). Compared with control, RRRs (95% confidence interval) for F/V and DASH were 0.93 (0.85 to 1.02, P=0.12) and 0.82 (0.75 to 0.90, P<0.001), respectively. This indicates a relative risk reduction of 18% in estimated CHD risk at 8 weeks compared with baseline for those on the DASH dietary pattern compared with those in the control group. The RRR (95% confidence interval) for DASH compared with F/V was 0.89 (0.81 to 0.97, P=0.012) (Table 3 and Figure 2). The probability value for trend across diets (control<F/V<DASH) was <0.001.
Figure 2.
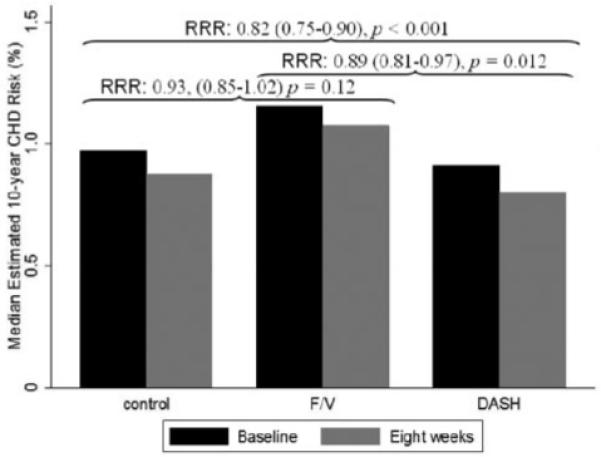
Ten-year probability of CHD event by randomized group.
Table 3.
Change in Estimated 10-Year CHD Risk in the DASH Trial by Subgroups
| Relative Risk Ratios (95% Confidence Interval) | ||||||||
|---|---|---|---|---|---|---|---|---|
| Baseline CHD Risk* |
F/V Versus Control |
P Value |
DASH Versus Control |
P Value |
DASH Versus F/V |
P Value |
P Value for Interaction |
|
| All, n=436 | 2.94/0.98 | 0.93 (0.85–1.02) | 0.120 | 0.82 (0.75–0.90) | <0.001 | 0.89 (0.81–0.97) | 0.012 | … |
| Men, n=224 | 4.72/2.40 | 0.88 (0.78–1.01) | 0.061 | 0.81 (0.71–0.93) | 0.002 | 0.92 (0.81–1.05) | 0.226 | 0.52 |
| Women, n=212 | 1.05/0.52 | 0.98 (0.86–1.13) | 0.801 | 0.84 (0.73–0.96) | 0.012 | 0.85 (0.75–0.98) | 0.020 | |
| CHD risk† ≥10%, n=41 | 14.2/13.36 | 0.93 (0.69–1.25) | 0.633 | 0.88 (0.64–1.21) | 0.436 | 0.95 (0.69–1.30) | 0.736 | 0.89 |
| CHD risk† <10%, n=395 | 1.77/0.84 | 0.93 (0.84–1.02) | 0.140 | 0.82 (0.74–0.90) | <0.001 | 0.88 (0.80–0.97) | 0.012 | |
| HTN,† n=126 | 4.02/1.47 | 0.89 (0.76–1.06) | 0.195 | 0.79 (0.66–0.95) | 0.011 | 0.88 (0.74–1.06) | 0.175 | 0.84 |
| No HTN,† n=310 | 2.50/0.84 | 0.95 (0.84–1.06) | 0.326 | 0.83 (0.75–0.93) | 0.001 | 0.88 (0.79–0.98) | 0.024 | |
| TC† ≥5.18 mmol/L, n=167 | 4.14/1.79 | 0.92 (0.80–1.05) | 0.228 | 0.96 (0.81–1.13) | 0.599 | 1.04 (0.88–1.23) | 0.638 | 0.20 |
| TC† <5.18 mmol/L, n=269 | 2.20/0.58 | 0.94 (0.83–1.07) | 0.332 | 0.82 (0.73–0.92) | 0.001 | 0.88 (0.78–0.98) | 0.024 | |
| Black, n=260 | 2.35/0.69 | 0.97 (0.86–1.10) | 0.615 | 0.78 (0.69–0.88) | <0.001 | 0.80 (0.71–0.91) | <0.001 | 0.038 |
| Caucasian, n=152 | 3.99/1.89 | 0.88 (0.75–1.03) | 0.106 | 0.92 (0.78–1.08) | 0.296 | 1.04 (0.89–1.22) | 0.598 | |
| Age† ≥60 y, n=42 | 10.1/10.2 | 0.88 (0.67–1.17) | 0.381 | 0.88 (0.63–1.23) | 0.454 | 1.00 (0.72–1.39) | 0.993 | 0.77 |
| Age† <60 y, n=394 | 2.17/0.84 | 0.93 (0.85–1.03) | 0.182 | 0.82 (0.74–0.91) | <0.001 | 0.88 (0.80–0.97) | 0.010 | |
Mean/median baseline CHD risk expressed as the 10-year probability (%) who would have a CHD event.
Based on baseline data.
RRRs were similar across subgroups of age, sex, baseline hypertension status, baseline estimated 10-year CHD risk, and baseline serum total cholesterol (Table 3). There was a statistically significant interaction between dietary pattern and race (P=0.038) suggesting a greater CHD reduction in blacks compared with whites (Table 3).
Discussion
In individuals with prehypertension or stage-1 hypertension, the DASH dietary pattern reduced estimated 10-year CHD risk by 18% compared with control and by 11% compared with F/V. The F/V diet also decreased estimated 10-year CHD risk by 7% compared with control although this result was not statistically significant. The DASH diet had the greatest reduction in estimated CHD risk and the control diet the least reduction with the F/V diet having intermediate effects. With the exception of a possible interaction between dietary pattern and race, results were similar across subgroups defined by baseline risk factors.
To date, no trial has tested the effects of the DASH dietary pattern on clinical outcomes. However, our results are consistent with other evidence suggesting that the adoption of DASH should reduce CHD risk. In the Nurses Health Study, a cohort study, women who ate a dietary pattern similar to DASH had a reduced risk of incident CHD.11 Although a reduction in CHD risk secondary to changes in blood pressure is assumed, this analysis quantifies the benefit and incorporates changes in lipid risk factors that also influence CHD risk.
The DASH Trial is a feeding study. As such, it should be viewed as an efficacy study, which documents the effects of the dietary patterns in the setting of maximal adherence. As for effectiveness, the PREMIER trial documented that a weight loss intervention that also promoted the DASH dietary pattern should reduce estimated CHD risk.7 However, the PREMIER trial only had partial adherence to the DASH diet, and there was no difference in estimated CHD risk between 2 weight loss interventions (1 with and 1 without the DASH diet). In subsequent analyses, greater adherence to the DASH diet led to greater reductions in blood pressure.12
Our results suggest the possibility of an interaction between dietary pattern and race, as have previous analyses in which the DASH dietary pattern reduced BP to a greater extent in blacks than in whites.3 However, the lack of a significant effect in whites should be interpreted cautiously because of the reduced sample size and hence limited power in this subgroup. In fact, we estimate that our study had 59% power to detect an RRR of 0.78, comparing DASH with the control group among white participants, with α (2-tailed) of 0.05. Also, the subgroup analyses were exploratory, and chance findings with multiple comparisons are possible.13 Regardless, the point estimates for the comparisons across interventions by race are largely similar to those of the overall results.
Limitations of this study deserve mention. First, the outcome of the current study is 10-year CHD risk estimated from the Framingham risk equations, not actual CHD events. However, the Framingham equations have been validated in blacks and whites who comprised the majority of our study population.14 Additionally, a large-scale randomized trial that tests the effects of dietary patterns on CHD events is unlikely to be performed because of cost and logistical considerations. Second, the study population had a relatively low baseline CHD risk, but even despite this low baseline risk, a substantial relative risk reduction was still present. Furthermore, such risk reductions when applied to the general population have great public health relevance. Third, the sample size of the trial, although large for a feeding study, was too small for analyses of all subgroups of interest, for example, postmenopausal women. The small sample size might also have led to chance differences in baseline characteristics of subgroups, for example, the differences in baseline CHD risk between blacks and whites. Finally, the DASH trial was a brief study. Although we cannot prove long-term effects, evidence from cohort studies suggest that as long as adherence is maintained, benefits should persist.11
Our study has several strengths. First, the trial enrolled a diverse population; 46% were female and 60% were black. The prevalence of prehypertension or stage-1 hypertension was 66%, which is similar to the prevalence of these conditions in the general US population.15 Second, this trial has strong internal validity with high rates of intervention adherence3 and few missing data. Also contributing to high internal validity were the standardized methods of BP measurement, meal preparation, and intervention delivery. Finally, ours is one of the few studies to assess the effect of changes in dietary pattern without weight loss on estimated CHD risk and the only to compare the DASH dietary pattern with a typical American diet. The OmniHeart Trial also evaluated the effect of diet on estimated CHD risk, but this study evaluated the effects of different macronutrients (carbohydrates, protein, and unsaturated fat) while holding other aspects of diet constant.16
Future research should focus on public health and clinical strategies to promote adoption of the DASH dietary pattern, which is currently recommended by the 2005 US Dietary Guidelines for Americans.17 Other research should include a validation study that assesses the relationship between change in estimated 10-year CHD risk from the Framingham equation with subsequent CHD.
In summary, adoption of the DASH dietary pattern, in the setting of stable weight, substantially decreased estimated 10-year CHD risk. In addition to decreasing BP, renewed efforts to promote the DASH dietary pattern could prevent CHD and have great public health implications given the enormous and persistent burden of CHD.18
WHAT IS KNOWN
Lifestyle modification, including dietary change, is the initial treatment for hypertension, a major independent risk factor for coronary heart disease (CHD).
The Dietary Approaches to Stop Hypertension (DASH) Trial demonstrated that the DASH diet lowers blood pressure and total and LDL cholesterols but decreases HDL cholesterol.
The Framingham Heart Study risk equations allow for the calculation of 10-year estimated CHD risk based on both modifiable risk factors (systolic blood pressure, total cholesterol, and HDL cholesterol) and nonmodifiable risk factors (age and sex).
WHAT THE STUDY ADDS
Our study demonstrates that adoption of the DASH diet has the potential to decrease estimated 10-year CHD risk by 18% when compared with the control diet, taking into account both its effects on blood pressure and lipids.
Given findings that the DASH diet should be especially effective in blacks, future research should explore the potential of the DASH diet as a means to reduce racial disparities in CHD.
Acknowledgments
Sources of Funding
There was no project-specific funding for this study. This publication was made possible by a grant (UL1 RR 025005) from the National Center for Research Resources (NCRR). Dr Chen was supported by the Johns Hopkins Predoctoral Clinical Research Training Program grant No. 1TL1RR-025007 from the National Center for Research Resources (NCRR)–Bethesda, Md. Dr Chen was awarded the “Excellence in Medical Student Research Award” from the Johns Hopkins University School of Medicine for his work on this project. Dr Maruthur was supported by a training grant (5 T32 HL007180) from the National Heart, Lung, and Blood Institute (NHLBI), NIH. The DASH trial was supported by grants (HL50981, HL50968, HL50972, HL50977, HL50982, HL02642, RR02635, and RR00722) from the NHLBI, the Office of Research on Minority Health, and the NCRR of the NIH. The contents of the manuscript are solely the responsibility of the authors and do not necessarily represent the official view of NCRR or NIH.
Footnotes
Disclosures
None.
References
- 1.Stamler JSR, Neaton JD. Blood pressure, systolic and diastolic, and cardiovascular risks. US population data. Arch Intern Med. 1993;153:598–615. doi: 10.1001/archinte.153.5.598. [DOI] [PubMed] [Google Scholar]
- 2.Lenfant C, Chobanian AV, Jones DW, Roccella EJ. Seventh report of the Joint National Committee on the Prevention, Detection, Evaluation, and Treatment of High Blood Pressure (JNC 7): resetting the hypertension sails. Hypertension. 2003;41:1178–1179. doi: 10.1161/01.HYP.0000075790.33892.AE. [DOI] [PubMed] [Google Scholar]
- 3.Appel LJMT, Obarzanek E, Vollmer WM, Svetkey LP, Sacks FM, Bray GA, Vogt TM, Cutler JA, Windhauser MM, Lin PH, Karanja N. A clinical trial of the effects of dietary patterns on blood pressure: DASH Collaborative Research Group. N Engl J Med. 1997;336:1117–1124. doi: 10.1056/NEJM199704173361601. [DOI] [PubMed] [Google Scholar]
- 4.Obarzanek E, Sacks FM, Vollmer WM, Bray GA, Miller ER, III, Lin PH, Karanja NM, Most-Windhauser MM, Moore TJ, Swain JF, Bales CW, Proschan MA. Effects on blood lipids of a blood pressure-lowering diet: the Dietary Approaches to Stop Hypertension (DASH) Trial. Am J Clin Nutr. 2001;74:80–89. doi: 10.1093/ajcn/74.1.80. [DOI] [PubMed] [Google Scholar]
- 5.Third Report of the National Cholesterol Education Program (NCEP) Expert Panel on Detection, Evaluation, and Treatment of High Blood Cholesterol in Adults (Adult Treatment Panel III) Final Report. Circulation. 2002;106:3143. [PubMed] [Google Scholar]
- 6.Wilson PWDAR, Levy D, Belanger AM, Silbershatz H, Kannel WB. Prediction of coronary heart disease using risk factor categories. Circulation. 1998;97:1837–1847. doi: 10.1161/01.cir.97.18.1837. [DOI] [PubMed] [Google Scholar]
- 7.Maruthur NM, Wang NY, Appel LJ. Lifestyle interventions reduce coronary heart disease risk. results from the PREMIER Trial. Circulation. 2009;119:2026–2031. doi: 10.1161/CIRCULATIONAHA.108.809491. [DOI] [PMC free article] [PubMed] [Google Scholar]
- 8.Sacks FMOE, Windhauser MM, Svetkey LP, Vollmer WM, McCullough M, Karanja N, Lin P, Steele P, Proschan MA, Evans MA, Appel LJ, Bray GA, Vogt TM, Moore TJ. Rationale and Design of the Dietary Approaches to Stop Hypertension Trial (DASH): a multicenter controlled-feeding study of dietary patterns to lower blood pressure. Ann Epidemiol. 1995;5:108–118. doi: 10.1016/1047-2797(94)00055-x. [DOI] [PubMed] [Google Scholar]
- 9.SHEP Cooperative Research Group Prevention of stroke by antihypertensive drug treatment in older persons with isolated systolic hypertension: final results of the Systolic Hypertension in the Elderly Program (SHEP) JAMA. 1991;265:3255–3264. [PubMed] [Google Scholar]
- 10.The effects of nonpharmacologic interventions on blood pressure of persons with high normal levels: results of the Trials of Hypertension Prevention, Phase I. JAMA. 1992;267:1213–1220. doi: 10.1001/jama.1992.03480090061028. [DOI] [PubMed] [Google Scholar]
- 11.Fung TT, Chiuve SE, McCullough ML, Rexrode KM, Logroscino G, Hu FB. Adherence to a DASH-style diet and risk of coronary heart disease and stroke in women. Arch Intern Med. 2008;168:713–720. doi: 10.1001/archinte.168.7.713. [DOI] [PubMed] [Google Scholar]
- 12.Obarzanek E, Vollmer WM, Lin PH, Cooper LS, Young DR, Ard JD, Stevens VJ, Simons-Morton DG, Svetkey LP, Harsha DW, Elmer PJ, Appel LJ. Effects of individual components of multiple behavior changes: the PREMIER trial. Am J Health Behav. 2007;31:545–560. doi: 10.5555/ajhb.2007.31.5.545. [DOI] [PubMed] [Google Scholar]
- 13.Wang R, Lagakos SW, Ware JH, Hunter DJ, Drazen JM. Statistics in medicine: reporting of subgroup analyses in clinical trials. N Engl J Med. 2007;357:2189–2194. doi: 10.1056/NEJMsr077003. [DOI] [PubMed] [Google Scholar]
- 14.D’Agostino RB, Sr, Grundy S, Sullivan LM, Wilson P. Validation of the Framingham coronary heart disease prediction scores: results of a multiple ethnic groups investigation. JAMA. 2001;286:180–187. doi: 10.1001/jama.286.2.180. [DOI] [PubMed] [Google Scholar]
- 15.Wang Y, Wang QJ. The prevalence of prehypertension and hypertension among US adults according to the new joint national committee guidelines: new challenges of the old problem. Arch Intern Med. 2004;164:2126–2134. doi: 10.1001/archinte.164.19.2126. [DOI] [PubMed] [Google Scholar]
- 16.Appel LJ, Sacks FM, Carey VJ, Obarzanek E, Swain JF, Miller ER, III, Conlin PR, Erlinger TP, Rosner BA, Laranjo NM, Charleston J, McCarron P, Bishop LM. Effects of protein, monounsaturated fat, and carbohydrate intake on blood pressure and serum lipids: results of the OmniHeart randomized trial. JAMA. 2005;294:2455–2464. doi: 10.1001/jama.294.19.2455. [DOI] [PubMed] [Google Scholar]
- 17.Committee DGA . 2005 Report of the Dietary Guidelines Advisory Committee on the Dietary Guidelines for Americans. US Department of Agriculture, Agricultural Research Service; 2005. [Google Scholar]
- 18.Mathers C, Fat DM, Boerma JT, World Health Organization . The Global Burden of Disease: 2004 Update. World Health Organization; Geneva, Switzerland: 2008. [Google Scholar]