Abstract
The present work examines the role of the complex geometry of the human vestibular membranous labyrinth in the process of angular motion transduction by the semicircular canals. A morphologically descriptive mathematical model was constructed to address the biomechanical origins of temporal signal processing and directional coding in determining the inputs to the brain. The geometrical model was developed based on shrinkage-corrected temporal bone sections using a segmentation/data-fitting procedure. Endolymph fluid dynamics within the 3-canal labyrinth was modeled using an asymptotic form of the Navier–Stokes equations and solved to estimate endolymph and cupulae volume displacements. The geometrical model was manipulated to study the role of major morphological features on directional and temporal coding. Anatomical results show that the bony osseous canals provide reasonable estimates of the orientation of the delicate membranous canals—the two differed by only 3.48 ± 1.89°. Biomechanical results show that the maximal response directions are distinct from the anatomical canal planes, but can be closely approximated by fitting a flat plane to the centerline of the canal of interest and weighting each location along the centerline with the inverse of the cross-sectional area squared. Vector cross-products of these maximal response directions, in turn, determine the null planes and prime directions that transmit the direction of angular motion to the brain as three independent directional channels associated with the nerve bundles. Finally, parameter studies indicate that changes in canal cross-sectional area and shape only moderately affect canal temporal and directional coding, while three-canal orientation is critical to directional coding.
Keywords: Vestibular, Mechanotransduction, Sensory, Inner ear
INTRODUCTION
The semicircular canals are frequently depicted as a mutually orthogonal collection of communicating tubes that respond maximally to angular accelerations in the plane of each canal. In this idealized view, one canal experiences peak excitation when rotated in its anatomical canal plane while its sister canals are oriented near their null planes and enter a quiescent state. Consequently, any three-dimensional (3D) head rotation has traditionally been viewed as being decomposed into vector components according to a coordinate system defined identically by anatomical and maximal response planes. This canal-based coordinate system would naturally extend to the central nervous system (CNS) to serve as one of the representations of angular head movement used by the brain to encode and reconstruct movement in 3D space.7,16,38 In fact, empirical evidence suggests that primary afferent responses of individual end organ nerves are segregated centrally where they become integrated with other sensory inputs for the coordination of vestibular reflexes.22,29,45 However, the details of canal directional coding are less clear, in part because anatomical canal planes are rarely orthogonal.3,4,5,10,14,18,19 Furthermore, studies investigating the directional sensitivities of the vestibular periphery have concluded that canal afferents respond maximally to rotations in planes that are distinct from anatomical canal planes, with maximal response planes deviating from anatomical planes by an average 7° in cats,17 6° in rhesus monkeys,21,37 and 26–56° in the pigeon AC.16 From these data, one might infer that the brain processes 3D rotational information in terms of maximal response directions. However, rotations about the maximal response direction of one canal generally do not silence the sister canals and therefore, the unit vectors along the maximal response directions are not the “eigenvectors” of the labyrinth or the natural coordinates of the system.
An alternate coordinate frame consists of three non-orthogonal vectors, or prime directions, that represent the axes of rotation that elicit afferent responses in only one canal.31 The existence of these directions follows deductively from directional responses of semicircular canal afferents observed experimentally, 16,17,37 and can also be shown using a mathematical model that predicts canal responses based on the fluid mechanics of the 3-canal labyrinth.31 The fact that the prime directions differ, at least to some extent, from the maximal response directions has interesting implications regarding coordinate system transformations carried out by the brain to convert sensory signals to the appropriate coordinates of motor outputs required for the vestibulo-ocular reflex (VOR) and musculoskeletal control systems. Of course, direct experiments to investigate directional coding of the afferent nerve bundles are not currently possible in humans and accordingly the precise orientation of the maximal response directions or prime directions is not yet known. However, since these features are determined by biomechanics it is possible to estimate the directions directly by utilizing the 3-D anatomy of the semicircular canals. This is one goal of the present study. To accomplish this it is necessary to first obtain a geometrical model of the human membranous labyrinth.
A significant fraction of the literature quantifying semicircular canal gross anatomy in humans is restricted to otic capsule anatomy, mainly because the bony regions of the vestibular system are accessible using a variety of imaging modalities.1,26,27 Conversely, the delicate membranous inner ear structures have been imaged in several species, but resolving them in humans with current technology is challenging.44,48 The most detailed human membranous labyrinth studies to date have employed histological techniques. These investigations typically consisted of canal plane calculations, endolymph volume estimates, or discrete measures of canal cross-sectional areas or sensory epithelia dimensions.11,12,23,25 Although valuable, none of the previous studies provided a sufficient quantitative description of semicircular canal membranous labyrinth geometry to formulate an accurate 3D biomechanical model. Therefore, as part of the present work, we developed a method to extract cross-sectional area/shape and planar information from the membranous and bony labyrinths through detailed segmenting of histological sections and parameterization of the membranous labyrinth geometry. The 3D membranous labyrinth reconstruction obtained in this way was subsequently used to predict endolymph flow and cupula deflection in each semicircular canals in response to a variety of prescribed head rotations.
An additional goal of the work was to characterize the temporal processing features of the human labyrinth system. Since Steinhausen’s groundbreaking work41 semicircular canal dynamics have been described by the second-order differential equation for the overdamped torsion pendulum.20,28,42,46,47,49 In these models, a single canal is represented as a perfectly rigid toroid of uniform cross-section and the time course of the cupula is governed by two time constants. The elastic or long time constant has been estimated from the human canal morphology to be ~10 s.28,47 The simple second-order models also predict a short time constant of approximately 3 ms (upper corner frequency). The weakness of the one canal approach is that it does not account for fluid communication between canals and is unable to describe the role of the semicircular canal geometry in responses to complex 3-D head movements. The present work reports a new 3-D reconstruction of the human membranous labyrinth and applies the mathematical approach of Damiano and Rabbitt14 and Rabbitt31 to make new predictions for the temporal response dynamics and directional sensitivity of the human semicircular canals. Histological results provide predictions of anatomical canal planes while biomechanical model results provide estimates of maximal response planes, prime directions, the dynamic responses of each cupula during rotations in arbitrary directions, and the prime coordinate system in which 3D angular accelerations may be transmitted to the human brain.
METHODS
Surface Reconstruction of the Vestibular Labyrinth
We obtained histological slides from the right temporal bones of a 67-year old female and a 43-year old male with no ear pathology or gross anatomical irregularity (Johns Hopkins Temporal Bone Collection, Dept. of Otolaryngology—Head and Neck Surgery). The temporal bones had been fixed in 10% formalin, decalcified with formol nitric acid, neutralized in 5% sodium sulfate solution, dehydrated with graded concentrations of ethanol, and embedded in celloidin. Sections were sliced in the approximate AC plane at 24 μm. Each tenth section had been stained. The stained sections were scanned to obtain digitized slices with a 12.6 microns/pixel in-plane resolution. Global registration was initially achieved using the tissue block periphery. Inter-slice micro-registration was performed manually to minimize jump discontinuities in canal centerlines over the 2–3 canals appearing in previous and subsequent sections. We identified the membranous labyrinth in each section, traced the endolymph-wetted surface, and stacked the outlines to form a wire-frame reconstruction of the endolymphatic space. Figure 1 shows sample temporal bone slices with the membranous labyrinth segmented as a series of closed contours (solid black curves: a, canals; b, utricular vestibule). The wire-frame (Fig. 1c) shows the complete set of segmented contours for one labyrinth. To reconstruct a parameterized model from the segmented contours, the membranous labyrinth was subdivided into five anatomical segments: horizontal canal (HC), anterior canal (AC), posterior canal (PC), common crus (CC) and utricle (U). For each segment, curved centerlines were calculated from the traced contours. This was done by computing the centroid of each traced contour, lacing the centroids together, and smoothing the resulting 3D space-curve with a cubic spline algorithm (Igor Pro, WaveMetrics). The centerlines for the HC, AC, PC, CC and U were connected at the natural bifurcation points to form a series of continuous closed curves as illustrated in Fig. 2. These curves defined the local tangent direction of endolymph fluid displacement along the membranous labyrinth lumen. Center points were calculated at even intervals along each centerline.
FIGURE 1.
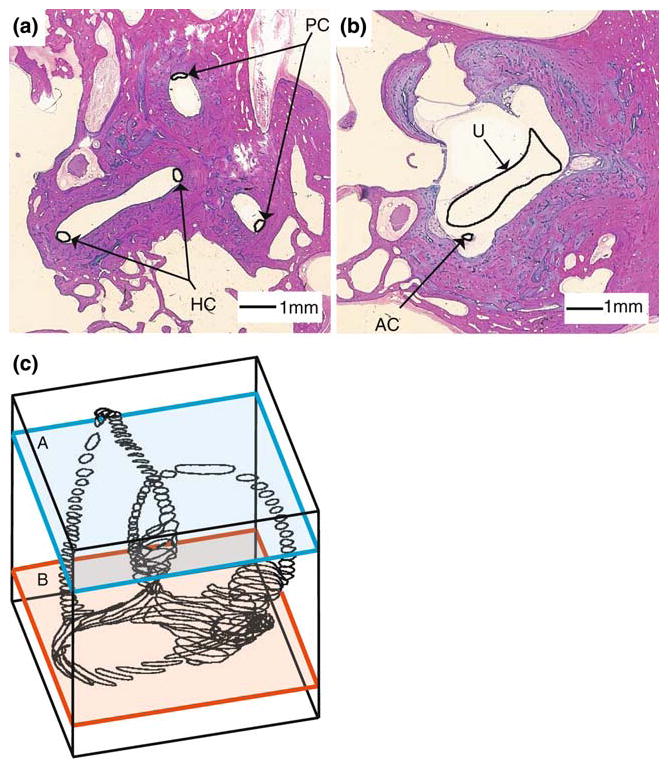
Segmentation of the human labyrinth. Two representative histological sections (a, b) are shown with the membranous labyrinth outline in black and labeled. Segmented sections were stacked to form the three-dimensional outline of the endolymphatic space (c).
FIGURE 2.
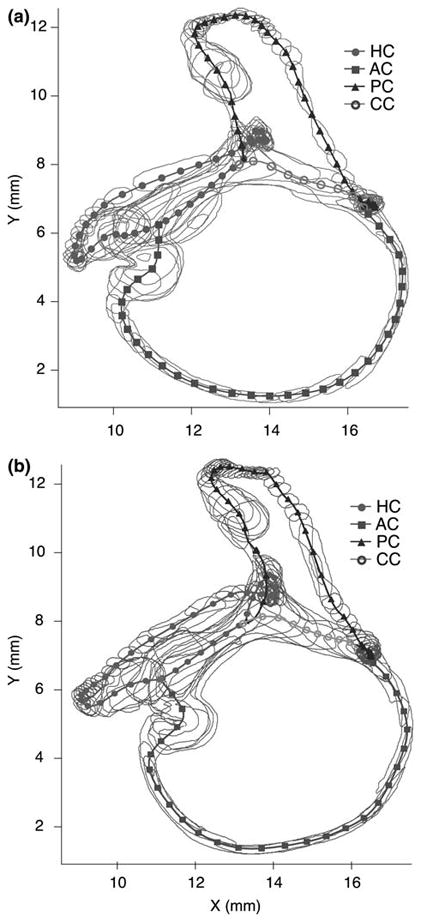
Labyrinth centerlines. The segmented endolymphatic space is shown for the two labyrinths (a, b) with the centerlines for the canals (HC, AC, PC) and the CC indicated. The utricular vestibule centerline was incorporated into that of the HC.14 Center points (symbols) were calculated at even intervals along the curved centerline of each canal and used to define local coordinate systems aligned tangent to the canal centerline.
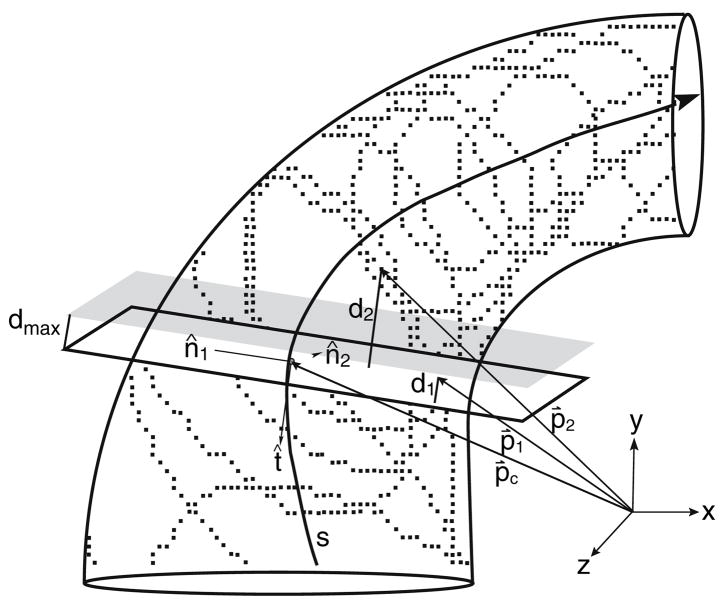
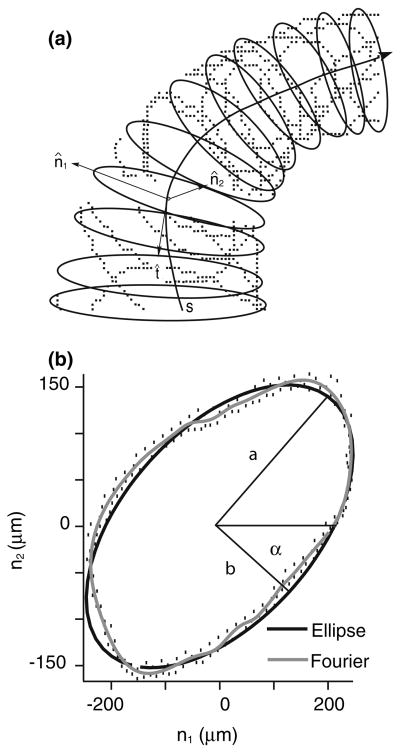
The curved centerlines were used to compute the local tangent (t), normal (n1) and binormal (n2) unit vectors illustrated in Fig. 3; the tangent vector was calculated directly from the centerline, the normal vector was the second derivative of the tangent and the binormal vector was the result of the cross product of the preceding two vectors. The tangent, normal and binormal vectors of each center point defined basis vectors of a local coordinate system that was used for curve fitting of a series of elliptical tubes to the membranous labyrinth surface. For this, a local subset of data points was selected by cutting a ~500-μm thick slice perpendicular to the tangent vector. The selected surface data were projected into the normal-binormal plane (e.g. subtracting d1 and d2 in Fig. 3) and a closed contour was fitted to the projected data using least squares. The choice of the best contour shape to represent the canal cross-section was determined by fitting a Fourier series, an ellipse and a circle to the projected data. A 10-term Fourier series, , was applied to obtain the best-fit parameters rn (n = 0…) and φn to describe the canal cross-sectional contour. When N = 1, the formula simplifies to the equation of an ellipse with semimajor (a) and semiminor (b) axes defined as a = 2(r0 + r1) and b = 2(r0 − r1). Sample raw data, projected data, and elliptical (black curve) and 10-term Fourier series (gray curve) fits are shown in Fig. 4 to illustrate the technique. The cross-sectional area, , was evaluated for the circular area, elliptical area, and 10-term Fourier area. In one region we did not have a sufficient number of points to fit the shape (e.g. lateral-most portion of the HC). In this case, a cross-sectional ellipse was estimated by interpolating between adjacent cross-sections where the data were adequate.
FIGURE 3.
Slice selection. For each point along the centerline of a canal, a local coordinate system composed of tangent, normal and binormal vectors (t̂, n̂1 and n̂2, respectively) was calculated directly from the centerline, s. A ~500 μm-thick slice was cut transverse to the canal as follows. If p̂c is a vector extending from the origin of the global coordinate system to the center point, and p̂n (n = 1,2,…) are vectors from the global system origin to the data points comprising the endolymphatic space, then dn, the distance between a data point and a plane centered at the center point and perpendicular to the tangent vector (white plane) is given by the equation: . To designate slice thickness, only points of dn < dmax are selected, corresponding to points falling between the white and shaded planes. In the specific case of 500-μm slices, dmax is set to 250 μm (e.g., the point of distance d1 would be selected as part of the slice while the point of distance d2 would not).
FIGURE 4.
Data fitting. A 10-term Fourier series, an ellipse (2-term Fourier series) and a circle (1-term Fourier series) were fitted to the selected slice of data points (Fig. 3) at each center point using least squares. The resulting fitted contours lie in the normal (n̂1) − (n̂s)plane and define the cross-sectional area perpendicular to the centerline tangent vector (a). The 10-term Fourier series curve (b, gray contour) closely reproduced details of the canal cross-sectional shape, but overall the shape and cross-sectional area were well represented by an ellipse (b, black contour; also see Results).
As quantified in the Results, the cross-sectional shape was well approximated by an ellipse. This allowed us to reconstruct the labyrinth based on the local major axis, minor axis, and orientation of the membranous duct cross-sectional area as functions of centerline position along each segment of the labyrinth. The result was a parameterized reconstruction consisting of a series of ellipses from which duct crosssectional areas and eccentricities are readily calculable. Since the methods also generated higher Fourier coefficients at each cross-section, a more accurate and bumpier surface could be rendered, but such visual detail was not needed to meet the aims of the present study.
Since the reconstruction was based on histological sections, additional steps were necessary to approximate the location of the 3D membranous labyrinth in the head. Several previous studies have quantified the spatial relationships of the semicircular canals as defined by the bony labyrinth.5,9,40,43 Della Santina et al.15 used reconstructions of multiplanar CT scans to determine the 3-D planar equations for the bony canals and the distance of each canal center from Reid’s stereotactic reference planes. We used these published data for the bony canals to orient our delicate membranous labyrinth within the head. For this, we first reconstructed the bony labyrinth, using the same approach with histological sections as used for the membranous labyrinth. Once the reconstruction was complete, the bony canal plane locations were determined by fitting flat planes to the centerlines by least squares. We then registered our bony labyrinth reconstructions with the Della Santina et al. CT population average results. The membranous labyrinths were moved along in the process, translated and rotated along with the bony labyrinth. Since the planar relationships of the specific bony labyrinths used here differed slightly from the average findings of Della Santina et al., the final registration with respect to Reid’s planes was not exact, but was within the range expected given intersubject variability. The final surface reconstruction described six membranous duct segments (n = HC, AC, PC, CC, UA (utricle, anterior) and UP (utricle, posterior)) with a series of ellipses centered along curved centerlines, sn. With the morphological boundaries of the labyrinth clearly defined, we were able to characterize endolymph and cupula responses to angular accelerations with the modeling approach developed by Rabbitt,31 with equations summarized in modified form in the Appendix.
3-Canal Mathematical Model
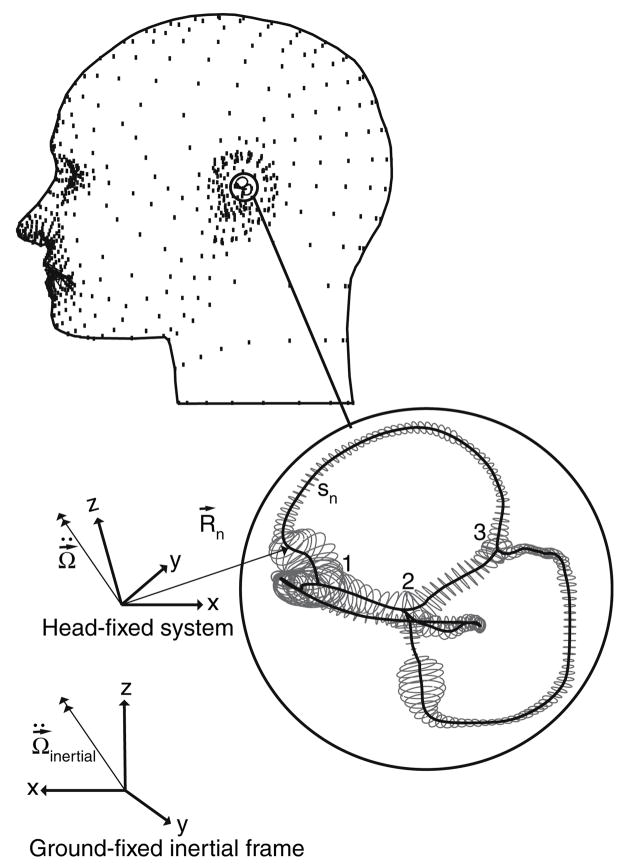
Models of the vestibular semicircular canals have traditionally been based on analysis of toroidal ducts of constant cross-sectional area.20,42,46,47, More thorough modeling approaches have been developed by Oman,30 Damiano and Rabbitt14 and Rabbitt31 using non-uniform canal geometries or considering the fluid communication between multiple canals and should be consulted as the foundations of the present work. Briefly, the present model considers the membranous labyrinth as a rigid structure filled with endolymph and fixed firmly to the temporal bone. During head rotations, the labyrinth moves with the skull as endolymph lags behind and the fluid motions relative to the duct wall are directly transmitted to the cupula. We assumed that endolymph is a viscous incompressible fluid undergoing unsteady flow. Motion of fluid exhibiting these properties is described by the Navier– Stokes equations. Oman et al.30 and Damiano and Rabbitt14 derived an approximate solution to these equations for endolymph flow in a single toroidal canal loop. This approach was extended to the 3-canal system by separating the labyrinth into six short segments corresponding to the HC, AC, PC, CC, UA and UP, each of which are represented by a second-order differential equation relating head acceleration to endolymph volume displacement, a pressure gradient, and the physical properties of the endolymph. The equations were linked together by pressure continuity and conservation of fluid volume at each of the bifurcation points. The cupula was modeled as a biphasic material consisting of a fluid and solid phase. A thorough description of the mathematical model, including all equations and numerical values for physical constants, is presented in the Appendix.
RESULTS
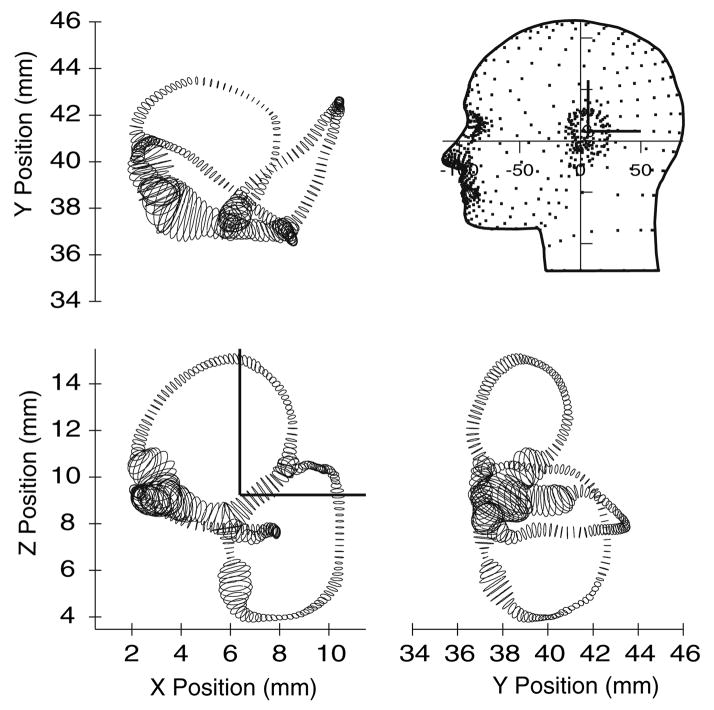
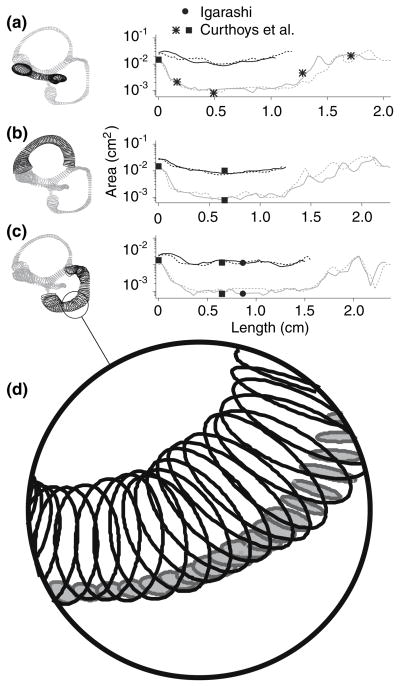
The segmentation/data-fitting process detailed above was applied to generate two membranous labyrinth surface reconstructions for input into the biomechanical model. Figure 2 shows raw segmentations of the two labyrinths and Fig. 5 illustrates one reconstruction oriented in a model of the head. The dimensions of the labyrinth were determined directly from the parameterized tubes comprising the reconstructions. The cross-sectional area was parameterized using a 10-term Fourier series, but from a practical point of view the shape was well approximated by an ellipse. Fitting the cross-sectional data with ellipses resulted in an enclosed cross-sectional area that differed from the 10-term Fourier area by an average of 0.2% (S.D. 0.3; Max. 0.9, Min. 0.001). Fitting cross-sectional data with circles resulted in an average error of 2.9% (S.D. 1.4; Max. 5.3; Min. 0.5). Therefore, the elliptical and circular approximations provided very good quantitative estimates of cross-sectional area. The area functions of the membranous ducts, showing cross-sectional areas as functions of the position, are presented in Fig. 6 for both labyrinths (not corrected for fixation shrinkage). Results for each membranous duct are shown around the complete loop, extending from the crista, along the canal, along the crus and/or utricle, and returning to the crista. Also displayed are the areas of the bony canals, which are an order of magnitude larger than those of the membranous canals.
FIGURE 5.
Orthographic views of the human membranous labyrinth. The reconstruction is presented with +x as posterior, +y as right lateral, and +z as superior (note direction of y). Labyrinths were reconstructed relative to histological block coordinates and placed within the head by minimizing the difference between the bony canals in the histological data and the average bony canals localized previously using CT data (Della Santina et al. 2005).
FIGURE 6.
Cross-sectional area functions. Bony canal (black) and membranous duct (gray) cross-sectional area functions are shown each canal duct are shown for the HC (a), AC (b) and PC (c). Solid curves are for labyrinth 1 and dashed curves are for labyrinth 2. The membranous ducts are defined to extend from the cupula, along the canal, down the CC and/or utricle, and back to the cupula. Comparable membranous labyrinth measures by Igarashi23, Curthoys et al.12 and Curthoys et al.11 are designated by a solid circle, a solid square, and an asterisk, respectively. Also shown is an enlarged view of the labyrinth (d), which emphasizes the order of magnitude difference between the areas of the bony (white filled ellipses) and membranous canals (gray filled ellipses).
To validate that the area values calculated from surface reconstructions were typical, comparable labyrinth dimensions reported in previous anatomical studies are reproduced in the figure.11,12,23 In the most extensive previous study, Curthoys et al. reported the areas of the horizontal membranous duct (shown as asterisks in Fig. 6) at the cupula, the ampulla-canal duct junction, the canal duct, the canal duct–utricle junction and the widest region of the utricle.11 Measurements of the posterior canals made by Igarashi (solid circle, Fig. 6) and the bony and membranous regions of the anterior and posterior canals by Curthoys et al. (solid square, Fig. 6) are also shown.12,23 Area values calculated from our reconstructions are in reasonable agreement with these previous reports, at least at the limited number of locations previously reported. Canal eccentricities were also calculated from the ellipses as . For labyrinth 1, average eccentricities (mean ± SD) of the PC, AC and HC were 0.74 ± 0.15, 0.76 ± 0.15, and 0.78 ± 0.10, respectively. The eccentricities for labyrinth 2 were comparable to labyrinth 1, with values of 0.72 ± 0.15, 0.72 ± 0.14 and 0.73 ± 0.14, respectively. These eccentricities increase the viscous drag by approximately 1.4 relative to the a circular tube of identical cross-sectional area (see λ, Appendix).
In any histology-derived representation of anatomical structures, tissue shrinkage, induced by fixation, is a challenge. In some previous reports these artifacts were corrected for by calculating a shrinkage factor determined from pre-fixation measurements of fresh tissue. While Curthoys et al. reported that shrinkage of the human membranous labyrinth was negligible, with no statistical significance between the dimensions of processed and fresh material,12 other studies estimated circumferential tissue shrinkage ranging from 9 to 10%.24,39 Ghanem et al.19 emphasized that shrinkage was not uniform in their studies, but varied from one region of the labyrinth to another. The labyrinth surface reconstructions presented in this report were derived from histological sections that undoubtedly underwent comparable shrinkage, and since labyrinth morphology is a key parameter in the present model, it was considered worthwhile to determine the degree to which changes in the cross-section of the canals affect the predictions of the model and, presumably, the biomechanical properties of the labyrinth. In order to quantify to what extent shrinkage of the labyrinth alters the biomechanics, simulations were carried out on the geometries after they had been processed in one of three ways. Group A reconstructions were those in which it was assumed that no shrinkage had occurred, and therefore the reconstructions were left unchanged.12 Group B reconstructions were resized to account for an estimated 9.2% uniform cross-sectional area shrinkage of the original tissue.24 Group C reconstructions were adjusted to correct for non-uniform shrinkage of the cross-sectional area of the labyrinth, ranging from an estimated 4% shrinkage of the HC, 16% of the AC (and presumably the PC), 13% of each ampulla, and 33% for the utricle.19 The size adjustments were made by independently resizing each ellipse by the appropriate shrinkage factor—an adjustment that is far more significant than the same scale change in the length of individual duct segments. The responses of the HC cupula during sinusoidal head movements in the HC canal plane are shown as Bode plots in Fig. 7.
FIGURE 7.
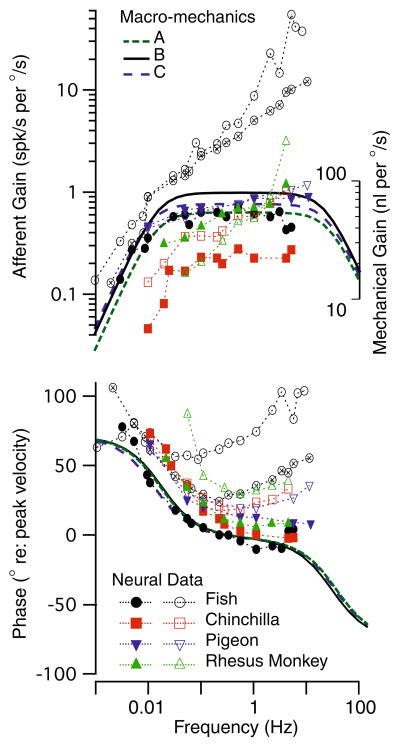
Frequency response. Model predictions for the volume displacement of the cupula (A–C) are shown along with semicircular canal neural afferent gain and phase (fish: Boyle and Highstein6; chinchilla: Baird et al.2; pigeon: Dickman et al.16; rhesus monkey: Haque et al.21). Note that the biomechanical predictions correspond reasonably well with some afferents (e.g., solid symbols, low-gain and regular units), while other afferents have phase and gain enhancements due to hair-cell afferent signal processing. The effect of shrinkage (compare A, B and C) on mechanical responses, although significant, is quite small relative to non-mechanical factors influencing gain, phase and the temporal signal transmitted to the brain (Rabbitt et al.32).
To provide context to interpret the Bode plots and the relative importance of canal mechanics, semicircular canal afferent responses to sinusoidal rotations are also shown in Fig. 7 for 4 species (symbols). Afferent modulation is shown in the form of Gain: spikes/second modulation per degree/second of sinusoidal angular head velocity, and phase: peak discharge relative to peak angular velocity stimulus. Solid symbols show responses of mid-band “velocity coding” afferents—units that are have regular spontaneous discharge characteristics in mammals. These afferent units have frequency dependent gain and phase that look similar to the mechanical input. In contrast, open symbols show responses of high-gain/acceleration coding afferents, units that have irregular spontaneous discharging characteristics in mammals. It is clear that only a subset of semicircular canal afferents directly reflect the mechanical volume displacement input and, even among these, there are quite large inter-afferent changes in sensitivity (gain) between units. The broad inter-afferent diversity is believed to arise primarily from hair-cell/afferent adaptation operators that are superimposed on top of the mechanical signal processing.32
The diverse afferent responses provide context to interpret the relatively small changes in gain and phase arising from changes in cross-sectional areas and shape of the ducts. This is exemplified by the biomechanical curves in Fig. 7 giving results for the three different shrinkage corrections. For uniform increases in duct diameter (Group B, Fig. 7), the gain increases and the bandwidth expands slightly relative to the control Group A case. This is in accordance with the predictions of several single canal models that have been reported previously.13,14,30 A more complex alteration of duct size (Group C, Fig. 7), in which the canals, the utricle, and the ampullae were resized with different shrinkage factors, similarly resulted in predictions of an increase in gain and bandwidth. However, the differences were relatively small, and given the ability of animals to adapt centrally it is unlikely that these differences would have any physiological implication. These findings indicate that size distortions of the reconstructions due to shrinkage of the original tissue have only a relatively small effect on the predictions in the model, and therefore, all subsequent calculations reported here were for Group A geometries. The consequences of shrinkage on the predictions of labyrinth directional sensitivities are addressed below.
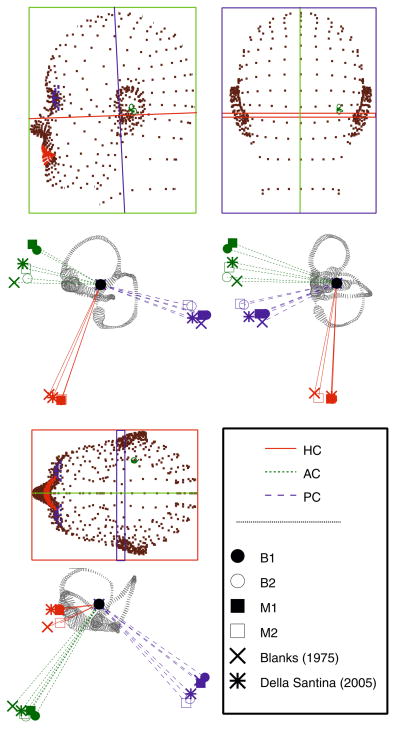
In many previous studies of semicircular canal geometry, it was assumed that the bony and membranous canals planes were identical and therefore, points selected along the circumference of the bony canals were assumed to provide an accurate measure of the membranous planes.3 One objective of the present study was to determine how well bony and membranous canal planes correspond, and therefore, whether bony canal measures derived from medical imaging could be used to adequately define the membranous canal orientations.1,15,26,27 In the present work, canal planes were defined by first, selecting center points extending from the ampulla to the utricle or CC, and minimizing the squared distance between a flat plane and the data points. Unit vectors perpendicular to each plane were determined, and the dot products formed to quantify the angles separating canal planes. The planes of the delicate membranous canals were found to differ from those of the bony canals only by an average of 3.48 ± 1.89°. These results indicate that the bony and membranous canal planes are indeed closely aligned and that the membranous labyrinth canal planes in humans may be approximated using the bony labyrinth as a guide. In addition, as is evident in Fig. 5, none of the canals form a perfect plane, nor are they orthogonal to one other. The non-orthogonality of human canals has long been acknowledged5,12 and that finding is reinforced here. Figure 8 illustrates the planar relationships of the bony and membranous canals for the two labyrinths, as well as average values recorded in the literature for the bony labyrinth.5,15 The results reveal slight intersubject differences in the bony canal spatial relationships. In labyrinth 1, HC–AC, HC–PC and AC–PC planes are nearly orthogonal with angles of 95.5°, 88.9° and 90.5°, respectively. These findings compare favorably with those of Della Santina et al., who concluded that the angles between bony canals were 90.6° ± 6.2° for the HC–AC, 90.4° ± 4.9°for the HC–PC, and 94.0° ± 4.0° for the AC–PC.15 In contrast, the bony canal planes of labyrinth 2 range from 78.8° to 90.6°. Blanks et al. reported similar canal non-orthogonality, though restricted to the HC–AC planes, where the angle formed between the canals was 111.76 ± 7.55°.5 The results for the two labyrinths reflect a relatively large degree of intersubject variability that exists in anatomical canal orientations, with angles ranging from approximately 80°–100°.15
FIGURE 8.
Anatomical canal planes. Orthographic views of canal plane normal vectors for the bony canals of the two labyrinths (B1, B2) and the membranous ducts of each labyrinth (M1, M2). It is notable that the bony canals and membranous ducts aligned quite well in the present study. Results are displayed along with previous results for the bony canals by Blanks et al. and Della Santina et al.5,15 The stereotactic reference frames defined by Reid’s planes are shown with respect to the human head. Below each is a view of labyrinth from the same vantage point.
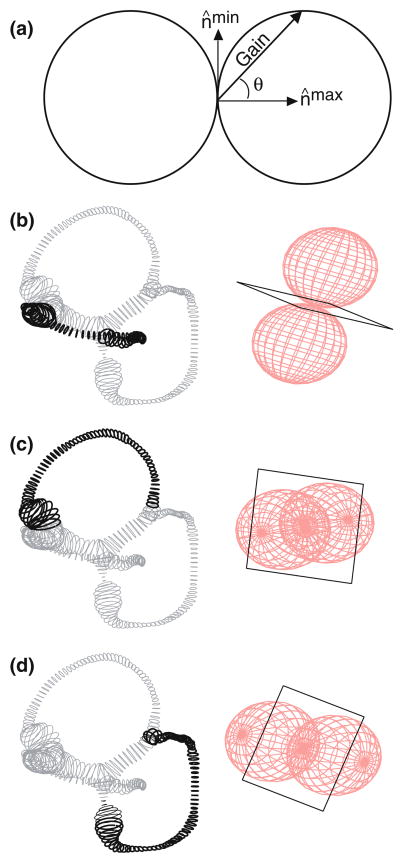
Experimental descriptions of afferent responses have routinely indicated that anatomical canal planes and maximal response planes differ.16,17,21,31,37 One might ask whether these deviations are due to central nervous system modulations of canal responses via the efferent system, or whether they are entirely a result of the mechanics of the labyrinth. We applied our threecanal model to this question by determining the maximal response direction (the axis perpendicular to maximal response planes) of each canal for rotations of 1 Hz. The maximal response direction is defined in Fig. 9a as the vector (n̂max). Rotations about this direction elicit a maximal response in a canal afferent. Circular bubbles represent the three-dimensional responses of each canal as described by the cosine rule. According to this principle, the cupula volume displacement gain is equal to the cosine of the angle between the maximal response direction and the axis of rotation. The plane perpendicular to the maximal response direction is the maximal response plane. This plane also describes the null plane of the canal, which has been used in previous studies to compute maximal response directions.16,17,37 All vectors perpendicular to the maximal response direction fall in the null plane and represent axes of rotation that minimize the response in a given canal. Theoretical considerations indicate that rotations in this “null plane” probably do not completely zero the response, but rather reduce the response by approximately three orders of magnitude and result in a “null” for all practical purposes.31 The maximal response directions for the HC, AC and PC are shown in Fig. 9b–d as the long axes of the double bubbles that describe the cosine rule. Null planes are represented by black squares.
FIGURE 9.
Maximal response directions. For any sinusoidal head rotation, the gain of the cupular volume displacement is proportional to the cosine of the angle (θ) between the axis of rotation and the maximal response directions (nmax) as illustrated by the vector from the origin to the surface of a circle (a). The three-dimensional cosine rule takes the form of a spherical bubble, shown here for the HC (b), AC (c), and PC (d). The vector nmin (a) represents an axis of rotation for which minimal response is elicited. A “null plane” is defined by a group of such vectors, and are illustrated as black squares for the HC (b), AC (c), and PC (d).
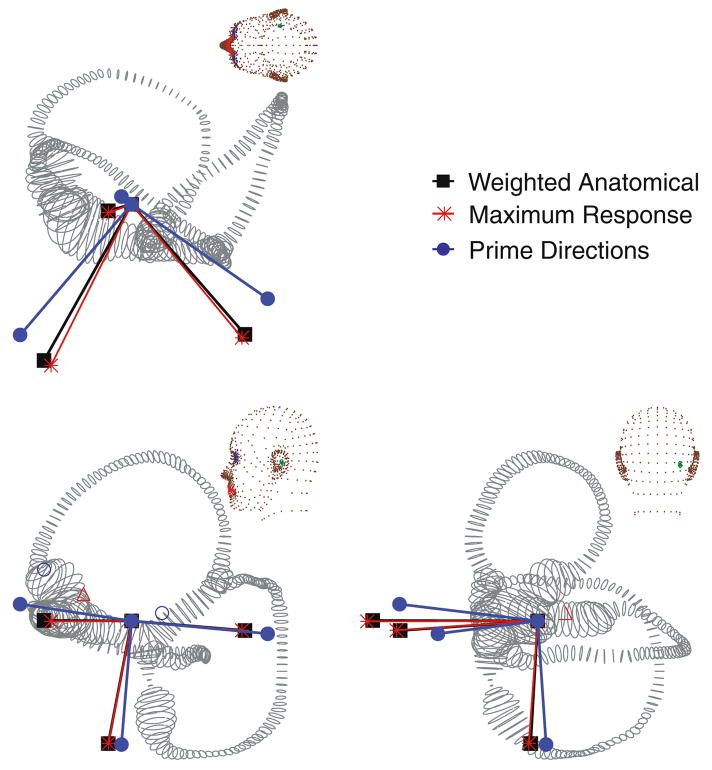
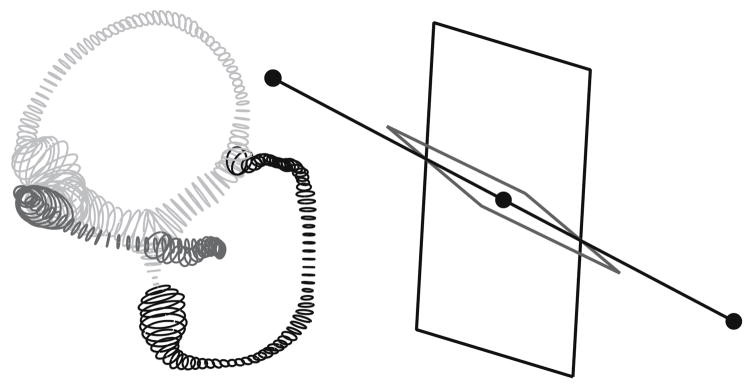
Since the canals are curved, bifurcate, and smoothly transition to the utricular vestibule and CC, it was not clear at the outset what mathematical approach should be used to define anatomical canal planes. When the anatomical canal planes were found by simply fitting a flat plane to the centerlines of the HC, AC and PC canals, we found they differed from the maximal response directions by an average of 2.27 ± 1.79°, 15.8 ± 2.08°, and 1.34 ± 0.558° for the HC, AC, and PC, respectively. The difference between the anatomical and maximal response planes disappeared when the anatomical plane was determined using only the long and slender portion of the membranous duct. Specifically, the anatomical and maximal response vectors were nearly identical when we weighted the anatomical centerline data with the inverse of the cross-sectional area squared (1/A2) when finding the anatomical plane by least squares (e.g., Fig. 11). Thus, differences between anatomical canal planes and maximal response planes recorded experimentally may be due solely to biomechanics and the method that was used to define the anatomical canal plane. One prominent feature of the predicted maximal response directions is non-orthogonality; therefore, movement about a maximal response direction typically stimulates multiple canals simultaneously. These results indicate that maximal response directions are not the coordinate frame used by the afferents to separate 3D rotational motion into three distinct components. Rather, a canal-based coordinate system defined by prime directions (n̂′)leads to large gain responses in one canal at a time. These prime directions, n̂′, are defined by the intersections of null planes of the sister canals as illustrated in Fig. 10. For instance, the prime direction of the posterior canal falls in the null planes of the HC and AC such that rotation about the prime direction does not stimulate the HC or AC. The model predicts that the prime directions are non-orthogonal vectors that are distinct from both maximal response directions and anatomical plane normal vectors. Figure 11 illustrates the weighted anatomical canal planes (weighted by inverse cross-sectional area squared), the maximal response directions, and the prime directions for a representative labyrinth. As described above, small changes in cross-sectional area, such as those that occur as a result of shrinkage correction, have a modest effect on the response dynamics of the three-canal system. Therefore, it is natural to assume that this would also alter the directional sensitivities of the canals. Interestingly, the canal maximal response and prime directions changed little with shrinkage correction, differing from the no-shrinkage case (Group A) by no more than 2° in any direction. Thus, even when tissue shrinkage or errors in cross-sectional area are considered, directional coding is robustly preserved and is primarily determined by the orientation of the slender portion of each canal in three dimensional space.
FIGURE 11.
Canal coordinate systems. Semicircular canals have three natural coordinate systems: anatomical canal planes, maximal response directions and prime directions. The three directions are illustrated for an example labyrinth. Anatomical canal planes were determined by fitting a plane to the canal center line data and weighting the fit with the inverse of the local duct cross-sectional area squared. Maximal response directions denote the direction of rotation that elicits the maximal cupular volume displacement, and prime directions denote the direction of rotation that nulls the responses of the sister canals. There is a weak frequency dependence on the prime and maximal response directions (shown here at 0.3 Hz).
FIGURE 10.
Prime directions. Prime directions are defined as the axis of rotation that nulls the responses of two sister canals while maintaining a large response in only one canal. They are defined by the intersection of the null planes of sister canals. The prime direction (dumbbell) of the posterior canal is illustrated here as the intersection of the HC and AC null planes (rectangles).
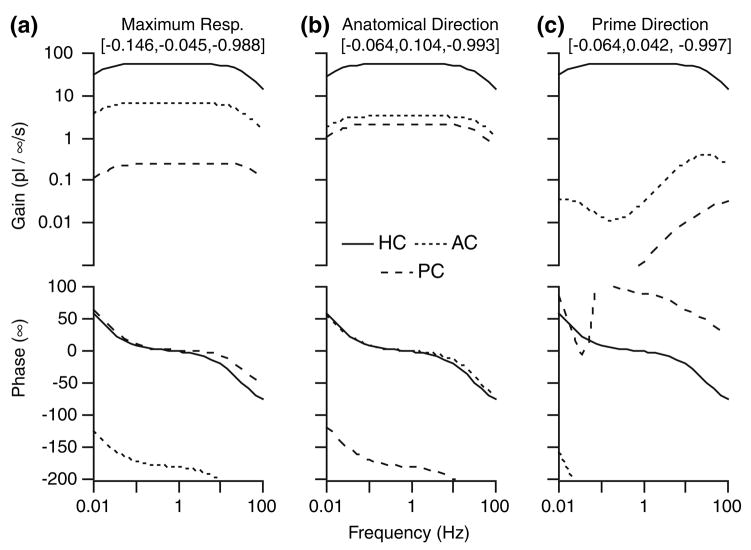
The properties of prime directions are further illustrated in the Bode plots of Fig. 12. The graphs show the gain and phase of each canal cupula as the head is rotated in the anatomical plane, in the maximal response plane, or about the prime direction of the HC. The model predicts for rotations in the anatomical plane that all three canals are stimulated, and that the HC response has the highest gain of the three for a broad range of rotation frequencies. The same trend is apparent during rotations in the maximal response plane. In this case, the HC is maximally stimulated, but the sister canals also exhibit significant activation levels. Only for rotations in the prime direction do large responses in the HC occur while the gain approaches zero for the AC and PC. In fact, the HC gain is approximately 100 times larger than those of the other canals within the physiological range of head rotations (0.01–10Hz) when rotating about its prime direction. It is interesting to note that the maximal response and prime directions are modestly frequency dependent. This is why the minimum response of the AC and PC occur as specific frequencies in Fig. 12c, but the frequency effect is weak and is unlikely to have physiological significance.
FIGURE 12.
Sensitivity for rotations in three key planes. Bode plots quantify cupula responses for sinusoidal rotations in the anatomical canal plane (a), about the maximal response direction (b), and about the prime direction (c) of the HC (see Fig. 11). Although all three rotations result in very similar gain and phase of the HC cupula, only rotation about the prime direction (c) results in large gain responses in the HC and simultaneous “inactivation” of the AC and PC.
DISCUSSION
The morphological and biomechanical modeling procedures detailed in this work have been used to investigate three potential coordinate frames used by the semicircular canals to represent angular motion in 3D space. The first frame defined by anatomical planes has been speculated previously to be consistent with the planes of maximum sensitivity of the canals. Although there was a correspondence between anatomical planes and biomechanical maximal response planes, the two were distinct. On average, present theoretical results for humans are consistent with differences found experimentally in other species such as the 6° and 7° differences in cats and monkeys, respectively.17,37 Present results further indicate that the differences between anatomical planes and maximal afferent responses previously observed experimentally are primarily due to the fact that regions of small cross-sectional area dominate the biomechanical sensitivity. The non-planar geometry of the semicircular canals, and the way in which fluid movements in one canal lead to concomitant fluid displacements in the other canals, contribute to a lesser degree.
Rotations about maximal response directions closely follow the cosine rule, with cupula gain proportional to the cosine of the angle of tilt away from the maximal direction. Afferent responses are minimized for head rotations about vectors perpendicular to the maximal response direction (i.e., the null plane). The maximal response directions of the canals are not orthogonal. The model demonstrates that as maximal responses are elicited in one canal, sister canals might also continue to exhibit fairly large biomechanical responses and associated afferent discharge. Thus, maximal response directions generally do not decompose accelerations into independent vectorial components. Rotations about prime directions, defined by the intersection of the null planes from the sister canals, are distinct from maximal response directions in that rotations in prime directions activate one canal only. Using the prime directions, any angular acceleration of the head, , can be represented in terms of the scalar components of acceleration for each canal ( ) and the prime directions as . In general, use of the maximal response directions would require additional matrix operations rather than a simple vector sum. An exception, of course, is the special case when the maximal response directions are mutually orthogonal—in this case they are identical to the prime directions.
Once the maximal response directions are known, it is straightforward to find the prime directions by forming the vector cross product between the maximal response directions of the sister canals. Therefore, afferent responses are the gold standard for finding the maximal response and prime directions. Unfortunately, afferent neurons cannot currently be recorded in humans. One approach to circumvent afferent recordings is to use labyrinthine anatomy to estimate the directions. Although it is routine to use CT data to locate the bony canal in humans, it is not yet technically possible to image the delicate membranous labyrinth in vivo. The present findings simplify the challenge by showing that the membranous ducts are very closely aligned with the osseous canals, therefore allowing us to use CT data to locate the bony canals and to imply the membranous duct anatomical planes. The membranous duct anatomical planes, however, still do not determine the maximal response directions directly. Present results also simplify this challenge in showing that the maximal response directions can be estimated directly from a single canal morphology by fitting a flat plane to the canal using the inverse of the local cross-sectional area squared (1/A2) as the weight. In the absence of knowing the actual area, Fig. 6 provides estimates that can be used in the weighting. With this we have a method to estimate maximal response directions and prime directions in humans, at least in the mid-frequency band where the response is dominated by viscous drag in the slender region of the membranous duct. The 1/A2 weighting requirement is not surprising since the viscous damping coefficient is proportional to 1/A2 and dominates the response in the mid-frequency band (see Appendix Eq. (3)). Because of this, directional sensitivities are dominated by the orientation of the slender regions of the ducts in 3D space.
The sensation of rotational head acceleration in 3D space is essential for the maintenance of balance, posture, and eye stabilization. The present work is consistent with the hypothesis that the brain receives from the semicircular canals movements coded in prime directions for integration with other sensory signals centrally. The significance of prime directions becomes apparent when considering the function of the VOR. The six extraocular muscles of each eye exhibit patterned responses to stimulation of individual canals.8 Single canal activation is analogous to a rotation about the prime direction of that canal without input from the contralateral labyrinth. In cats, stimulation of a canal nerve leads to the agonist-antagonist contraction of muscle pairs and the movement of eyes along pulling directions.8 It appears, in cats, that the ocular muscles do not align with the prime directions of the labyrinth and, therefore, it is likely that the VOR uses neural convergence to convert vestibular directions to ocular coordinates. Work in rhesus monkey suggests a correspondence between prime direction orientations and the on-directions of extraocular muscles.21 This finding lends support to the assertion that prime directions are an important storage form of vestibular inputs within the central nervous system.
The role of semicircular canal biomechanics in determining temporal features of afferent responses is much less profound than its role in directional coding. Afferent responses, summarized in Fig. 7 for a variety of species, show dramatic inter-afferent differences in the frequency-dependent gain and phase (within individual animals) that can not be explained on the basis of biomechanics.32 Only the velocity-sensitive afferents (regularly discharging units in mammals) show temporal response properties that directly reflect the endolymph volume displacement and cupula deflection. The difference between the mechanical input and neural responses is primarily due to afferent/hair-cell adaptation. 32 Inter-afferent variations in the magnitude and time-course of adaptation to maintained hair bundle displacements are very large and vastly overwhelm differences in mechanical inputs caused by inter-subject variations in gross labyrinth morphology. There are also large differences in gain between individual afferent units that are not due to mechanical differences but instead, correlate with synaptic structure and contacts. Hence, neural signal processing is a very important factor shaping the temporal response dynamics of afferents, while 3-canal biomechanics is dominant in determining directional sensitivities and coding.
An important component of the current report was the approach used to reconstruct the morphology of the membranous labyrinth. The process was sufficient for the present aims, but was not without shortcomings. Since the histological sections were obtained from an archival material bank (Johns Hopkins Temporal Bone Library) and were not oriented in the head prior to sectioning, the precise orientation of the labyrinth relative to Reid’s system was not known. Instead, to orient the canals in the head, the rigid bony duct surrounding the delicate membranous labyrinth was aligned with the population average reported by Della Santina et al. using least squares15. Stacking of individual sections based on the histological block edges and labyrinth centerlines also was not precise and no doubt introduced some skewing of the reconstructions. Nevertheless, the orientations of the individual bony canals were very similar to the average reported by Della Satnina et al. and fell well within their population range. These facts indicate that the reconstructions were representative of individuals within the normal population and appropriate to investigate general biomechanical principles governing temporal and directional coding by the semicircular canals. True subject-specific models, if needed in the future, would be facilitated by an imaging modality capable of resolving the fine membranous labyrinth.
This work has described anatomical reconstruction and biomechanical modeling of the human vestibular labyrinth for the characterization of semicircular canal temporal response dynamics and directional sensitivities. Results show that directional sensitivity to angular movement is exquisitely dependent upon the 3-canal morphology, and that afferent temporal responses are partially determined by canal mechanics. The approach may have application to predict canal responses to any dysfunction of the canals that has a mechanical basis. For instance, a model of the common disorder benign paroxysmal positional vertigo (BPPV) has been developed based on this approach.36 We hope that this work may encourage further investigation into the way 3D motion is represented centrally, a vital element in our understanding of CNS processing of multidimensional head and body movements.
FIGURE 13.
FIGURE A.1. Model labyrinth geometry. The human membranous labyrinth has 3 natural bifurcation points (1–3) where the six labyrinthine segments join. The three-dimensional motion of each segment was specified by time-dependent angular acceleration in the ground-fixed intertial frame and resolved into the moving head-fixed system. This introduces a Galilean transformation and an inertial force that appears in the Navier–Stokes equations. Poiseuille flow and slender body approximations were assumed to further reduce the equations to a set of coupled ordinary equations (Damiano and Rabbitt14). Equations for six segments were coupled together at the bifurcations by conservation of mass and pressure continuity.
Acknowledgments
The authors would like to thank Dr. George Nager, Department of Otolaryngology – Head and Neck Surgery, Johns Hopkins University for providing the histological sections used in this work and Daniel Heibert for checking the equations and correcting a typographical sign error.
APPENDIX
The fluid filled labyrinth was modeled using the approach of Damiano and Rabbitt14 adjusted to the three-dimensional geometry of the human labyrinth. The endolymph was modeled as a Newtonian fluid undergoing low Reynolds number, low Stokes number, small displacement laminar flow. Inertial forcing due to acceleration of the head is introduced using a Galilean transformation. A slender body asymptotic expansion14 or, alternatively a control volume approach,34 reduces the Navier–Stokes equations to an ordinary differential equation acting along the curved centerline of each duct segment. Following the notation of Rabbitt31, for each short segment n of the labyrinth (n = HC, PC, AC, CC, UA, or UP), the volume displacement of the endolymph (Q) during head movements are represented by:
| (1) |
Parameters mn, cn and kn are proportional to the equivalent mass, damping and stiffness of the endolymph (or cupula depending on location in the canal, as will be discussed later), respectively, and can be estimated from endolymph density (ρ), viscosity (μ), shear stress (γ) and cross-sectional area function A(s) according to the following expressions:
| (2) |
| (3) |
| (4) |
The independent variable sn defines a curved coordinate running along the centerline of the canal segment. Integration limits are along the length (ln) of the duct segment (n). The term λ is a dimensionless number that relates the viscous drag to the flow rate based on the cross-sectional shape and frequency of excitation.14,30 For low Reynolds number, low Stokes number flow, the velocity distribution in an elliptical cross-section is , where (x,y) are cross-sectional coordinates with origin at the center, (a,b) are the major and minor radii, and ΔP/Δℓ is the pressure gradient. This results in a viscous drag factor , where the elliptical eccentricity . The parameter λ reduces to 8π for a circular cross-section and is easily extended to higher frequencies (Stokes number >1) by making λ a frequency-dependent complex-valued parameter following Damiano.14
The right hand side of Eq. (1) includes a pressure gradient, ΔP = Pn(ln) − Pn(0), relating the pressures on either end of the labyrinth segment, and inertial forcing fn, due to angular acceleration of the head. The inertial forcing was calculated as
| (5) |
where R⃗ is a vector extending from the stereotactic head-fixed coordinate system origin to the centerline of the segment of interest. Angular acceleration ( ) is presented as a vector resolved in the head-fixed coordinate frame (Fig. A.1). It is calculated from angular acceleration relative to the ground-fixed inertial frame ( ) by applying the time dependent orthonormal rotation matrix, N, relating the head-fixed frame to the ground-fixed frame using:
| (6) |
Equations (1)–(6) were employed to compute the endolymph fluid displacements and resultant pressure gradients in a single canal or other labyrinth component. Comparable equations have been used to describe the dynamic responses of a single the HC14,30 and a 3-canal labyrinth.31,35 In the single-canal models the pressure gradient, ΔP, corresponded to transcupular pressure. In the current work, pressure gradients and volume displacements apply to six individual duct segments, the HC, AC, PC, CC, UA and UP. Equations for the segments were coupled together to form a coupled 3-canal model. This was accomplished by identifying three bifurcation points (Fig. A.1) where the labyrinth segments naturally connect to one another and applying conservation of fluid volume and pressure continuity to create a matrix equation governing whole labyrinth endolymph (e) fluid mechanics:
| (7) |
The mass, Me, damping Ce, and stiffness Ke are matrices are
| (8) |
| (9) |
and
| (10) |
The diagonal elements are the addition of the segments forming a closed loop around the respective canal; e.g. MHC = mHC + mUP + mUA, MPC = mPC + mCC + mUP and, MAC = mAC + mCC + mUA. In the present work we have selected the local coordinate systems such that mHC, mUP, mUA, mPC, mCC and mAC are all positive. This simplifies the sign convention and clarifies the sign of each element in the matrix (but differs from previous work31,36). Each element in the above matrices was calculated from Eqs. (2)–(4). The pressure across the three cupulae is
| (11) |
and inertial forcing becomes
| (12) |
The vector Q⃗e contains the volume displacements of the endolymph at the HC, AC and PC cupulae:
| (13) |
The preceding equations provide a method of relating endolymph volume displacements to prescribed head angular accelerations. In order to characterize the effect of these fluid displacements on cupula movement, it is necessary to develop a model for the cupula. The cupula has often been modeled as an elastic or viscoelastic material impermeable to endolymph.46,30,33 These models neglect the intrinsic porosity of the cupula’s mucopolysaccharide matrix, resulting in a 1:1 relationship between endolymph and cupula displacement. In this model, we represent cupula porosity by assuming that the structure is composed of a fluid and a solid phase. The solid portion responds to pressure gradients according to the Equation
| (14) |
in which Mc, Cc, and Kc are diagonal matrices corresponding to the equivalent mass, stiffness and viscosity of each cupula. For these calculations, the upper limit of integration is cupula thickness, hc. Inertial forcing, F⃗c, is calculated from Eq. (5), where ρ refers to the total density of the solid and fluid phase components of the cupula. The pressure gradient, ΔP⃗, is the interaction force, where
| (15) |
The constant Γ is related to Darcy’s constant (Da), a term used to describe fluid flow through a porous medium, the cupula solid phase volume fraction (ψ), and the cross-sectional area of the cupula (Ac) by
| (16) |
The equations governing endolymph and cupula responses were combined to produce the following differential equation describing the entire system:
| (17) |
Note, the forcing vector F⃗ has units of pressure and the displacement Q⃗ has units of volume. The effective mass, stiffness and damping matrices are
| (18) |
| (19) |
and
| (20) |
respectively, where the matrix Γ = ΓI.
The inertial forcing vector is condensed to
| (21) |
and endolymph and cupula volume displacements are simply
| (22) |
Thus any three-dimensional head movement may be described in terms of cupula volume displacements in the three canals. The physical parameter values used in these equations are listed in Table A.1.
TABLE A.1.
Model parameter values.
| Parameter | Value | Units | |
|---|---|---|---|
| ρe | 1.0 | g cm−3 | |
| μe | 8.5 × 10⁻³ | dyn s−1 cm−1 | |
| γe | 0 | dyn cm−2 | |
| ρc | 1.0 | g cm−3 | |
| μc | 0 | dyn s−1 cm−1 | |
| γc | 3.7 | dyn cm−2 | |
| Γ | 2.0 × 10⁶ | dyn s−1 cm−5 | |
| Ac | ≈ 1.2× 10⁻² | cm2 (see Fig. 6) | |
| hc |
|
cm |
The mass, damping and stiffness matrix elements were computed using the geometry and the physical parameters listed in Table A.1. For labyrinth 1, the effective mass matrix (g/cm4) was
the damping matrix (dyn)s/cm5) was
| (24) |
and the stiffness matrix (dyn/cm5) was
| (25) |
The pressure forcing vector (dyn/cm2) was determined from
| (26) |
where and are the projected components of head angular acceleration (rad/s2) in the prime directions n′HC = [−0.064, 0.042, −0.997], n′AC = [0.702, 0.699, −0.136] and n′PC = [0.857, −0.557, −0.103], respectively.
References
- 1.Arnold B, Jager L, Grevers G. Visualization of inner ear structures by three-dimensional high-resolution magnetic resonance imaging. Am J Otol. 1996;17(3):480–485. [PubMed] [Google Scholar]
- 2.Baird RA, et al. The vestibular nerve of the chinchilla. II. Relation between afferent response properties and peripheral innervation patterns in the semicircular canals. J Neurophysiol. 1988;60(1):182–203. doi: 10.1152/jn.1988.60.1.182. [DOI] [PubMed] [Google Scholar]
- 3.Blanks RH, et al. Planar relationships of the semicircular canals in rhesus and squirrel monkeys. Brain Res. 1985;340(2):315–324. doi: 10.1016/0006-8993(85)90928-x. [DOI] [PubMed] [Google Scholar]
- 4.Blanks RH, I, Curthoys S, Markham CH. Planar relationships of semicircular canals in the cat. Am J Physiol. 1972;223(1):55–62. doi: 10.1152/ajplegacy.1972.223.1.55. [DOI] [PubMed] [Google Scholar]
- 5.Blanks RH, I, Curthoys S, Markham CH. Planar relationships of the semicircular canals in man. Acta Otolaryngol. 1975;80(3–4):185–196. doi: 10.3109/00016487509121318. [DOI] [PubMed] [Google Scholar]
- 6.Boyle R, Highstein SM. Resting discharge and response dynamics of horizontal semicircular canal afferent of the toadfish, Opsanus tau. J Neurosci. 1990;10:1557–1569. doi: 10.1523/JNEUROSCI.10-05-01557.1990. [DOI] [PMC free article] [PubMed] [Google Scholar]
- 7.Cohen B. Representation of three-dimensional space in the vestibular, oculomotor, and visual systems. Concluding remarks. Ann N Y Acad Sci. 1988;545:239–247. doi: 10.1111/j.1749-6632.1988.tb19568.x. [DOI] [PubMed] [Google Scholar]
- 8.Cohen B, Suzuki JI, Bender MB. Eye Movements from Semicircular Canal Nerve Stimulation in the Cat. Ann Otol Rhinol Laryngol. 1964;73:153–169. doi: 10.1177/000348946407300116. [DOI] [PubMed] [Google Scholar]
- 9.Counter SA, et al. 3D MRI of the in vivo vestibulocochlea labyrinth during Gd-DTPA-BMA uptake. Neuro-report. 2003;14(13):1707–1712. doi: 10.1097/00001756-200309150-00010. [DOI] [PubMed] [Google Scholar]
- 10.Curthoys IS, et al. The orientation of the semicircular canals in the guinea pig. Acta Otolaryngol. 1975;80(3–4):197–205. doi: 10.3109/00016487509121319. [DOI] [PubMed] [Google Scholar]
- 11.Curthoys IS, Oman CM. Dimensions of the horizontal semicircular duct, ampulla and utricle in the human. Acta Otolaryngol. 1987;103(3–4):254–261. [PubMed] [Google Scholar]
- 12.Curthoys IS, Markham CH, Curthoys EJ. Semicircular duct and ampulla dimensions in cat, guinea pig and man. J Morphol. 1977;151(1):17–34. doi: 10.1002/jmor.1051510103. [DOI] [PubMed] [Google Scholar]
- 13.Damiano ER. A bi-phasic model of the cupula and the low-frequency mechanics of the vestibular semicircular canal. Soc Mech Eng Bed. 1997;35:61–62. [Google Scholar]
- 14.Damiano ER, Rabbitt RD. A singular perturbation model for fluid dynamics in the vestibular semicircular canal and ampulla. J Fluid Mech. 1996;307:333–372. [Google Scholar]
- 15.Della Santina CC, et al. Orientation of human semicircular canals measured by three-dimensional multiplanar CT reconstruction. J Assoc Res Otolaryngol. 2005;6(3):191–206. doi: 10.1007/s10162-005-0003-x. [DOI] [PMC free article] [PubMed] [Google Scholar]
- 16.Dickman JD. Spatial orientation of semicircular canals and afferent sensitivity vectors in pigeons. Exp Brain Res. 1996;111(1):8–20. doi: 10.1007/BF00229550. [DOI] [PubMed] [Google Scholar]
- 17.Estes MS, Blanks RH, Markham CH. Physiologic characteristics of vestibular first-order canal neurons in the cat. I. Response plane determination and resting discharge characteristics. J Neurophysiol. 1975;38(5):1232–1249. doi: 10.1152/jn.1975.38.5.1232. [DOI] [PubMed] [Google Scholar]
- 18.Ezure K, Graf W. A quantitative analysis of the spatial organization of the vestibulo-ocular reflexes in lateral-and frontal-eyed animals–I. Orientation of semicircular canals and extraocular muscles. Neuroscience. 1984;12(1):85–93. doi: 10.1016/0306-4522(84)90140-4. [DOI] [PubMed] [Google Scholar]
- 19.Ghanem TA, Rabbitt RD, Tresco PA. Three-dimensional reconstruction of the membranous vestibular labyrinth in the toadfish, Opsanus tau. Hear Res. 1998;124(1–2):27–43. doi: 10.1016/s0378-5955(98)00108-7. [DOI] [PubMed] [Google Scholar]
- 20.Groen JJ. The semicircular canal system of the organs of equilibrium. II. Phys Med Biol. 1957;1(3):225–242. doi: 10.1088/0031-9155/1/3/302. [DOI] [PubMed] [Google Scholar]
- 21.Haque A, Angelaki DE, Dickman JD. Spatial tuning and dynamics of vestibular semicircular canal afferents in rhesus monkeys. Exp Brain Res. 2004;155(1):81–90. doi: 10.1007/s00221-003-1693-0. [DOI] [PubMed] [Google Scholar]
- 22.Hoffmann KP. Responses of single neurons in the pretectum of monkeys to visual stimuli in three-dimensional space. Ann N Y Acad Sci. 1988;545:180–186. doi: 10.1111/j.1749-6632.1988.tb19563.x. [DOI] [PubMed] [Google Scholar]
- 23.Igarashi M. Dimensional study of the vestibular apparatus. Laryngoscope. 1967;77(10):1806–1817. doi: 10.1288/00005537-196710000-00003. [DOI] [PubMed] [Google Scholar]
- 24.Igarashi M, O-Uchi T, Alford BR. Volumetric and dimensional measurements of vestibular structures in the squirrel monkey. Acta Otolaryngol. 1981;91(5–6):437–444. doi: 10.3109/00016488109138525. [DOI] [PubMed] [Google Scholar]
- 25.Igarashi M, Ohashi K, Ishii M. Morphometric comparison of endolymphatic and perilymphatic spaces in human temporal bones. Acta Otolaryngol. 1986;101(3–4):161–164. doi: 10.3109/00016488609132823. [DOI] [PubMed] [Google Scholar]
- 26.Jackler RK, Dillon WP. Computed tomography and magnetic resonance imaging of the inner ear. Otolaryngol Head Neck Surg. 1988;99(5):494–504. doi: 10.1177/019459988809900508. [DOI] [PubMed] [Google Scholar]
- 27.Koizuka I, et al. High-resolution magnetic resonance imaging of the human temporal bone. ORL J Otorhinolaryngol Relat Spec. 1991;53(6):357–361. doi: 10.1159/000276247. [DOI] [PubMed] [Google Scholar]
- 28.Mayne R. The dynamic characteristics of the semicircular canals. J Comp Physiol Psychol. 1950;43:304–319. doi: 10.1037/h0054827. [DOI] [PubMed] [Google Scholar]
- 29.McCrea RA, et al. Anatomical and physiological characteristics of vestibular neurons mediating the horizontal vestibulo-ocular reflex of the squirrel monkey. J Comp Neurol. 1987;264(4):547–570. doi: 10.1002/cne.902640408. [DOI] [PubMed] [Google Scholar]
- 30.Oman CM, Marcus EN, Curthoys IS. The influence of semicircular canal morphology on endolymph flow dynamics. An anatomically descriptive mathematical model. Acta Otolaryngol. 1987;103(1–2):1–13. doi: 10.3109/00016488709134691. [DOI] [PubMed] [Google Scholar]
- 31.Rabbitt RD. Directional coding of three-dimensional movements by the vestibular semicircular canals. Biol Cybern. 1999;80(6):417–431. doi: 10.1007/s004220050536. [DOI] [PubMed] [Google Scholar]
- 32.Rabbitt RD, et al. Hair-cell versus afferent adaptation in the semicircular canals. J Neruophysiol. 2004;93(1):424–436. doi: 10.1152/jn.00426.2004. [DOI] [PMC free article] [PubMed] [Google Scholar]
- 33.Rabbitt RD, Boyle R, Highstein SM. Sensory transduction of head velocity and acceleration in the toadfish horizontal semicircular canal. J Neurophysiol. 1994;72(2):1041–1048. doi: 10.1152/jn.1994.72.2.1041. [DOI] [PubMed] [Google Scholar]
- 34.Rabbitt RD, Damiano ER, Grant JW. Biomechanics of the vestibular semicircular canals and otolith organs. In: Highstein SM, Popper A, Fay R, editors. The Vestibular System. Springer-Verlag: New York; 2003. pp. 153–201. [Google Scholar]
- 35.Rabbitt RD, Damiano ER, Grant JW. Biomechanics of the semicircular canals and otolith organs. In: Highstein SM, Fay RR, Popper AN, editors. The Vestibular System. Springer-Verlag; New York: [Google Scholar]
- 36.Rajguru SM, Ifediba MA, Rabbitt RD. Three-dimensional biomechanical model of benign paroxysmal positional vertigo. Ann Biomed Eng. 2004;32(6):831–846. doi: 10.1023/b:abme.0000030259.41143.30. [DOI] [PubMed] [Google Scholar]
- 37.Reisine H, Simpson JI, Henn V. A geometric analysis of semicircular canals and induced activity in their peripheral afferents in the rhesus monkey. Ann N Y Acad Sci. 1988;545:10–20. doi: 10.1111/j.1749-6632.1988.tb19552.x. [DOI] [PubMed] [Google Scholar]
- 38.Robinson DA. The use of matrices in analyzing the three-dimensional behavior of the vestibulo-ocular reflex. Biol Cybern. 1982;46(1):53–66. doi: 10.1007/BF00335351. [DOI] [PubMed] [Google Scholar]
- 39.Schuknecht H. Pathology of the Ear. Harvard University Press; Cambridge, MA: [Google Scholar]
- 40.Spoor F, Zonneveld F. Comparative review of the human bony labyrinth. Am J Phys Anthropol Suppl. 1998;27:211–251. doi: 10.1002/(sici)1096-8644(1998)107:27+<211::aid-ajpa8>3.3.co;2-m. [DOI] [PubMed] [Google Scholar]
- 41.Steinhausen W. Uber den Nachweis der Bewegung der Cupula in der intakten Bogengangsampulle des Labyrinthes bei der naturlichen rotatorischen und calorischen Reizung. Plugers Arch Gesamte Physiol. 1931;228:322–328. [Google Scholar]
- 42.Steinhausen W. Uber die beobachtungen der cupula in der bognegangsampullen des labyrinthes des libenden hecths. Pflugers Arch. 1933;232:500–512. [Google Scholar]
- 43.Takagi A, Sando I, Takahashi H. Computer-aided three-dimensional reconstruction and measurement of semicircular canals and their cristae in man. Acta Otolaryngol. 1989;107(5–6):362–365. doi: 10.3109/00016488909127522. [DOI] [PubMed] [Google Scholar]
- 44.Thorne M, et al. Cochlear fluid space dimensions for six species derived from reconstructions of three-dimensional magnetic resonance images. Laryngoscope. 1999;109(10):1661–1668. doi: 10.1097/00005537-199910000-00021. [DOI] [PubMed] [Google Scholar]
- 45.Uchino Y, et al. Horizontal canal input to cat extraocular motoneurons. Brain Res. 1979;177(2):231–240. doi: 10.1016/0006-8993(79)90774-1. [DOI] [PubMed] [Google Scholar]
- 46.Van Buskirk WC, Watts RG, Liu YK. The fluid mechanics of the semicircular canals. J Fluid Mech. 1976;78:87–98. [Google Scholar]
- 47.Van Egmond AAJ, Groen JJ, Jongkees LBW. The mechanics of the semicircular canals. J Physiol Lond. 1949;110:1–17. doi: 10.1113/jphysiol.1949.sp004416. [DOI] [PMC free article] [PubMed] [Google Scholar]
- 48.Voie AH. Imaging the intact guinea pig tympanic bulla by orthogonal-plane fluorescence optical sectioning microscopy. Hear Res. 2002;171(1–2):119–128. doi: 10.1016/s0378-5955(02)00493-8. [DOI] [PubMed] [Google Scholar]
- 49.Wilson VJ, Melvill Jones G. Human Semicircular Canals. Plenum Press; New York: Mammalian Vestibular Physiology. [Google Scholar]


