Abstract
Human epidermal growth factor receptor 2 (HER2) is a member of the human epidermal growth factor receptor kinases (other members include EGFR or HER1, HER3, and HER4) that are involved in signaling cascades for cell growth and differentiation. It is well established that HER2-mediated heterodimerization has important implications in cancer. Deregulation of signaling pathways and overexpression of HER2 is known to occur in cancer cells, indicating a role of HER2 in tumorigenesis. Therefore, blocking HER2-mediated signaling has potential therapeutic value. We have designed several peptidomimetics to inhibit HER2-mediated signaling for cell growth. One of the compounds (HERP5, Arg-βNaph-Phe) exhibited antiproliferative activity with IC50 values in the micromolar-to-nanomolar range in breast cancer cell lines. Binding of fluorescently labeled HERP5 to HER2 protein was evaluated by fluorescence assay, microscopy, and circular dichroism spectroscopy. Results indicated that HERP5 binds to the extracellular region of the HER2 protein. Structure of the peptidomimetic HERP5 was studied by NMR and molecular dynamics simulations. Based on these results a model was proposed for HER2-EGFR dimerization and possible blocking by HERP5 peptidomimetic using a protein-protein docking method.
Keywords: conformation, docking, fluorescence labeling, HER2, NMR, peptidomimetic
Introduction
Epidermal growth factor receptors (EGFR) are the best-studied growth factor receptors of the tyrosine kinase family of receptors (1,2). In normal cells, activation of this receptor tyrosine kinase family by ligands and/or epidermal growth factors triggers signaling pathways that control normal cell growth, differentiation, and motility. Binding of extracellular ligands such as epidermal growth factor (EGF) to the extracellular ligand binding domain of EGFR results in receptor homo-heterodimerization, activation of tyrosine kinase activity, and autophosphorylation of the receptors, thus initiating a mitogenic signaling cascade (3–8). Deregulation of this signaling process is a critical aspect of many types of cancers. Human epidermal growth factor receptor 2 (HER2) is a member of the family of human epidermal growth factor receptor kinases (other members include EGFR or HER1, HER3, and HER4) that are involved in signaling cascades for cell growth and differentiation. It is well established that HER2-mediated heterodimerization has important implications in cancer (8–13). Deregulation of signaling pathways and overexpression of HER2 is known to occur in cancer cells, indicating a role of HER2 in tumorigenesis (14–17).
The mechanism of regulation of EGFR- and HER2-dependent signaling cascades has clinical significance. Blockade of HER2-mediated multimerization results in inhibition of phosphorylation, ultimately leading to control of cell growth. Thus, blocking HER2-mediated signaling has potential therapeutic value. Monoclonal antibodies specifically directed against the extracellular domain of HER2 have been shown to be selective inhibitors of the growth of HER2-overexpressing cancer cells (13,18). The extracellular region of HER2 consists of four domains (I–IV). Domain II of HER2 is known to participate in dimerization with other HER receptors (2,5,6). Domain IV has an important cleavage site for matrix metalloproteases (MMP). The antibody herceptin (trastuzumab) binds to domain IV of HER2 and inhibits the cleavage site of MMP. This leads to indirect inhibition of dimerization and phosphorylation (6,10,19). Various therapeutic agents directed against HER2 have provided promising alternatives to traditional non-specific chemotherapy (20–25). Peptidomimetics and peptides vaccines have been reported to interfere with the dimer interface of HER2 with EGFR (12, 23, 26). However, no small molecule specifically targeting an extracellular region of HER2 has yet been approved for clinical use. Currently, computational technology in combination with experimental methods such as NMR and X-ray, is being widely employed in the invention of therapeutics such as anti-HIV compounds, neuraminidase inhibitors and medication for treating snakebite (27–29). Among the computational techniques employed are homology modeling, molecular dynamics and molecular simulations which allow to explore and understand target structure, protein stability and molecule-molecule interactions (30–40). Recently, Huang et al. (42) employed, in addition to homology modeling, both structure-based and ligand-based approaches in designing novel HER2-targeting compounds. The structure-based approach identifies potential ligands by docking compounds into receptor active site and then determining the receptor-ligand binding affinities (42). Ligand-based approach is based on the structure-activity relationship, which has already been widely used in the discovery of various therapeutic compounds (43, 44).
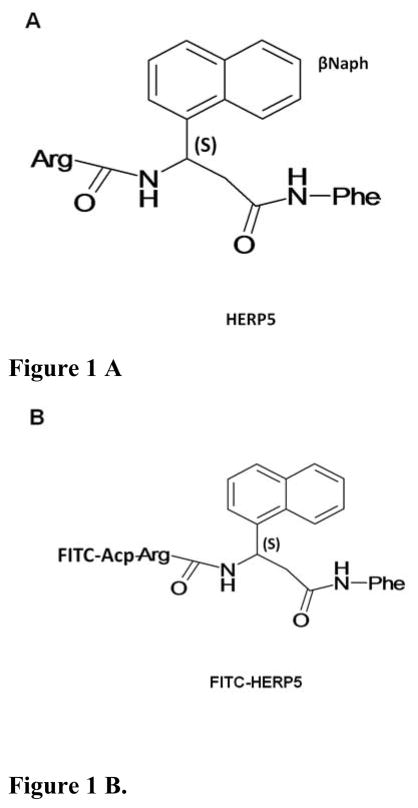
In an earlier report, we have described the design, synthesis, docking studies, and antiproliferative activity of peptidomimetics based on the crystal structure of HER2 complexed with its antibody herceptin (45). To further investigate the molecular mechanism of binding and target identification of peptidomimetic HERP5 (Figure 1A), fluorescently labeled HERP5 (Figure 1B) was used. Fluorescence assay and microscopy studies indicated that HERP5 binds to the extracellular region of HER2 protein. Docking studies were used to predict the binding of HERP5 to HER2 protein domain IV. HER2 is known to form a heterodimer with EGFR. Based on our studies and protein-protein docking, a possible model for HER2-EGFR heterodimer was proposed.
Figure 1.
Structure of A) HERP5 peptidomimetic and B) fluorescein isothiocyanate-labeled HERP5 (FITC-HERP5). FITC is conjugated to the peptidomimetic via an aminocaproic acid linker (Acp).
Materials and Methods
Peptidomimetics
Peptidomimetic HERP5 and its conjugate fluorescein isothiocyanate-labeled HERP5 were designed and custom synthesized by New England Peptides (Gardner, MA) and Aroztech LLC (Cincinatti, OH). The purity of the peptides was confirmed by HPLC, and the identity of the correct molecular ion was confirmed by mass spectrometry. For compound HERP5, both R and S configurations are possible at β-amino acid, 3-amino-3-(1-napthyl)-propionic acid (βNaph). The synthesized compound had S configuration at the βNaph group in the peptidomimetic.
MTT and CellTiter-Glo assay for determination of antiproliferative activity
The growth inhibitory activity of the target compound was determined on cell lines BT-474 (human breast cancer cell line that overexpresses HER2) and MCF-7 (human breast cancer cell line that does not overexpress HER2) using a modified version of the microculture tetrazolium assay and CellTiter-Glo assay (Promega Corporation, Madison, WI) (46–48). MCF-7 cells were cultured in Dulbecco's modified Eagle's medium (DMEM) supplemented with 10% FBS and 1% antibiotics; cells of passages 5 onward were used. The BT-474 cell line was maintained according to the supplier’s guidelines (ATCC, Manassas, VA).
Once the cells reached 90% confluency, a cell suspension was prepared by trypsinization of monolayer cultures. Cell counts were performed, and the suspensions were diluted accordingly to give 1 × 10⁴ cells/mL with the appropriate medium. Aliquots (100 μL) of the cell suspension were added to each well in a 96-well microtiter plate. The cells were incubated for 24 hours (37 °C, 5% CO2). A stock solution of the test compound was prepared in DMSO, and serial dilutions were made with the medium for the desired concentration range. Not more than 1% DMSO (final concentration) was present in each well. The test sample was incubated with the cells for 72 hours. Wells without cells and those with cells in culture medium/DMSO were examined in parallel. 0.1% SDS was included as a positive control. At the end of the incubation period, the medium was decanted and replaced with 100 μl MTT solution (0.5 mg/mL in 1x phosphate buffer saline solution (PBS). The cells were incubated for another 3 hours, after which the medium was removed from each well by pipetting and the cells were carefully washed with PBS (100 μL). DMSO (150 μL) was added to each well to lyse the cells and dissolve the purple formazan crystals. The absorbance of the formazan product was measured within 30 minutes at 590 nm on a microplate reader (Biotek, Winooski, VT).
For the Celltiter-Glo assay, after the compound was incubated with cells for 72 hrs, the wells were washed with PBS and 100 μL of CellTiter-Glo reagent was added to cells containing 100 μL medium. The plates were equilibrated for 10 minutes and luminescence from the cells with and without the compound was read using blank, cells with 0.1% SDS and 1% DMSO.
The absorbance/luminescence values obtained at each concentration (triplicates for each run and 3–4 independent runs were carried out) were averaged, adjusted by subtraction of blank values (wells without cells), and expressed as a percentage of the average absorbance obtained from control wells (in the absence of test compound). Cell viabilities were calculated as percentage living cells. IC50 values were determined from logarithmic plots of the % viability versus concentration generated using GraphPad Prism (San Diego, CA).
Fluorescence assay for binding of FITC labeled HERP5 to HER2 domain IV
Domain IV of HER2 protein fragment consisting of amino acid residues 537–636 was obtained from Abcam (Cambridge, MA). Antigen solution was prepared by dissolving an appropriate concentration of HER2 antigen in carbonate-bicarbonate buffer (coating buffer), pH 9.6. HER2 antigen solution at a concentration of 4 μg/mL per well was added to a 96-well tissue culture plate in triplicate. After overnight incubation of the antigen solution at 4 °C, wells were washed with deionized water three times followed by addition of PBS with 1% BSA (blocking buffer) at 100 μL/well. Various concentrations of FITC-HERP5 peptide (Figure 1B) (100 μM, 50 μm, 25 μM, and 1 μM) and FITC-antiHER2 (FITC-labeled antibody to HER2 extracellular domain, BD Biosciences, San Jose CA) were added to the well plates at a concentration of 0.55 μg/well (in 100 μl PBS). Wells with HER2 protein without the addition of FITC-HERP5, wells with FITC only, and blank wells were used as negative controls. After the plates were incubated for 2 hours at room temperature and washed three times with deionized water, fluorescence was quantified using a fluorescent plate reader (Biotek) with an excitation wavelength of 485 nm and emission wavelength at 535 nm. Relative fluorescence intensity (subtracted from blank) was plotted for each concentration. Statistical significance was determined using student’s t test, and p values were used for comparison. A difference of p <0.05 is considered as significant.
Binding of FITC labeled HERP5 on cell surface of HER2 overexpressing breast cancer cell lines
BT-474/SKBR-3/MCF-7 cells were plated at a density of 104 cells/well in a 96-well tissue culture plate and were incubated at 37 °C with 5% CO2 for 24 hours. Various concentrations of FITC-HERP5 peptide (100 to 0.05 μM), FITC at a concentration of 0.1 μM, and FITC-antiHER2 (to extracellular domain) diluted in PBS were added to the well plates in triplicate at a volume of 100 μL. After the plates were incubated for 1 hour at room temperature and washed three times with deionized water, fluorescence was quantified using a fluorescent plate reader with an excitation wavelength of 485 nm and emission wavelength at 535 nm. Statistical significance of the data was determined using student’s t test. Comparison of binding was made only with cells without FITC-labeled peptide. Green fluorescence emitted by the cell suspensions were examined under a fluorescence microscope (Olympus America Inc., Center Valley, PA) at 20x and 40x magnification. Photographs were taken at 20x magnification. As a control, MCF-7 cell lines which do not express HER2 protein, cells without the addition of FITC-HERP5, and blanks were used.
Competitive binding assay with unlabeled HERP5 peptide
BT-474/SKBR-3/MCF-7 cells were plated at a density of 104 cells/well in a 96-well tissue culture plate and were incubated at 37 °C with 5% CO2 for 24 hrs. After 24 hrs the medium was removed and various concentrations of unlabeled peptide (100 to 0.005 μM) with constant concentration of FITC-HERP5 (50 μM) were added to the wells and incubated for 1 hr. After washing, fluorescence from the cells was read in a microplate reader. Fluorescence values from triplicate experiments were averaged. Kinetics of competitive binding was obtained by plotting log of concentration of unlabeled peptide vs. average fluorescence intensity. Graphpad Prism (San Diego, CA) was used to calculate the affinity constant Ki. Curve fitting was obtained by using competitive binding with a one-site model using a fixed concentration of hot ligand as concentration of FITC-HERP5 and Kd value in the range of 1–10 μM (preliminary biacore experiments, Supplementary Material).
Circular dichroism studies
Circular dichroism experiments were carried out at room temperature on a Jasco J-815 spectropolarimeter (JASCO Inc., Easton, MD) flushed with nitrogen. Spectra were collected from 360–190 nm using a 1 mm path length of rectangular quartz cell. Each spectrum was the average of five scans taken at a scan rate of 50 nm/min with a spectral bandwidth of 0.1 nm. The concentration of peptidomimetic was 0.85 mM. For titration of protein to peptide, recombinant HER2 protein extracellular domain consisting of amino acids 23-652 (BD Biosciences, San Jose, CA) was dissolved in deionized water (50 μg/50 μL). Calculation of concentration of protein was based on the fact that the protein consists of 630 amino acid residues. Aliquots of 5 μL of protein solution were added to the peptide solution to obtain different ratios of protein:peptide concentrations (1:1000 to 1:150). For a control experiment, another sample of HERP5 was used and the same amount of water was added (in 5 μL aliquots) to peptide HERP5 to ensure that changes in the CD spectrum observed were not due to dilution of the peptide. For the final representation, the baseline was subtracted from the spectrum.
NMR studies
Peptidomimetic samples for NMR experiments were prepared in 90%H2O/10% D2O with 2,2-dimethyl-2-silapentane-5-sulfonic acid (DSS) as reference. 1 mg of peptidomimetic was dissolved in 650 μL volume of H2O/D2O to obtain the desired concentration. One- and two-dimensional NMR data were collected on a Varian Unity Inova operating at 500.15 MHz 1H frequency equipped with temperature control and water suppression. Unless otherwise specified, all the data were collected at 298 K. For water suppression in 2D NMR, WATERGATE sequence was used. TOCSY (49), ROESY (50), NOESY (51), and DQF-COSY (52, 53) experiments were performed with 2K data points in F1 and 512 experiments in F2 dimension. Data were processed using NMRPipe (54) on a Linux computer and analyzed using SPARKY (55). For temperature-dependence experiments, NMR data were collected from 280 K to 315 K in steps of 5 K.
NMR-restrained molecular dynamics
NMR-restrained molecular dynamics (MD) simulations and energy minimization were carried out using InsightII/Discover software version 2005 (Accelrys, Inc., San Diego CA), on a Linux computer. Structures of peptidomimetic HERP5 was built using a biopolymer module. Consistent valence force field (cvff) was used. Molecular dynamics (MD) and energy minimization were carried out using a simulated annealing procedure (56). Briefly, NMR upper and lower distances obtained from ROESY data were input as distance constraints to the peptide structure. A total of 17 inter- and intra-residue ROEs were used for the calculations (ten intra-residue ROEs, seven inter-residue ROEs). The peptidomimetic structure was subjected to the simulated annealing procedure by carrying out dynamics at 900 K for 10 ps. The history file was analyzed, and five low energy structures were chosen from the history file. Each of these structures was subjected to step-wise dynamics at 800 K to 400 K in steps of 100 K for 5 ps. Finally, each structure was soaked with 10 Å layers of water molecules, and dynamics was carried out at 300 K for 10 ps. A total of 80 structures were generated from this procedure. These structures were subjected to energy minimization using 100 steps of steepest descent method and 4000 steps of conjugate gradient method (with NMR constraints) until the rms derivative was 0.3 kcal/mol. Structures were further analyzed for intramolecular hydrogen bonding and secondary structure such as β- or γ-turn. The root mean square deviation (RMSD) of the backbone atoms were compared using Insight software (Accelrys Inc). Finally, twelve structures were chosen from the above 80 structures based on their backbone RMSD and their consistency with ROE data and were used for representation of the conformation of the peptides in solution. An average structure was chosen from these structures and represented as the structure of the peptide.
Docking of HERP5 to HER2 protein domain IV
Docking of ligand (HERP5) to protein HER2 was performed using Autodock (57, 58). The crystal structure of HER2 complexed with herceptin was downloaded from the protein data bank (PDB ID 1N8Z) (5). The antibody portion of the molecule, solvent, and counter ions were removed from the crystal structure using Insight II software (Accelrys) (59). To search for the possible binding site of peptidomimetic HERP5 on domain IV of HER2 protein, the entire domain IV was used. To cover the entire domain IV of HER2 protein for docking, three overlapping grid boxes were created on the protein: a) grid box covering the C-terminal region of domain IV, b) the N-terminal part of domain IV, and c) the center portion of domain IV with grid box of dimensions of 128 × 128 × 128 Å3 (Supplementary Material). The three-dimensional structure of ligand HERP5 was obtained from the NMR-restrained molecular dynamics studies described in this report. The peptidomimetc structure was docked to the HER2 protein domain IV structure using Autodock software (57, 58). Docking calculations were performed on a Linux Cluster computer, at the High Performance Computing Center, Louisiana State University, Baton Rouge via Louisiana Optical Network Infrastructure (LONI). During docking, rotatable bonds in the ligand were allowed to rotate. Twenty-five million energy evaluations were performed for each grid box. From each grid box docking, 50 structures with lowest energy (free energy changes) were selected and tabulated in increasing order of energy. Structures were clustered based on energy. Detailed analyses of the ligand-receptor interactions were carried out, and final coordinates of the ligand and receptor were saved as pdb files. For display of the receptor with the ligand binding site, PyMol software (DeLano Scientific LLC, San Diego, CA) was used.
Indentification of possible binding site of ligand on HER2 domain IV using surface mapping
To identify the possible binding site of ligand HERP5 on HER2 protein, the surface of HER2 domain IV was mapped with FTmap. In FTmap (60) the structure of the protein was soaked with solvent molecules of different polarity (16 small molecules such as ethanol, isopropanol, isobutanol, acetone, acetaldehyde, dimethyl ether, cyclohexane, ethane, acetonitrile, urea, methylamine, phenol, benzaldehyde, benzene, acetamide, and N,N-dimethylformamide as probes). The HER2 protein portions of domain III and domain IV consisting of residues 448–602 was subjected to FT-map calculation on the server (60). Analysis was based on a consensus of docked and clustered structures. Clusters with at least 10 structures were considered possible hits. The possible sites of clusters were compared with docking of HERP5 on domain IV of HER2.
Modeling of EGFR: HER2 heterodimer
Modeling of a heterodimer of EGFR with HER2 protein was carried out in four stages: i) docking of EGFR domains I–III and HER2 domain I–IV using ZDOCK, ii) docking of domain IV of EGFR and HER2, iii) modeling of domain IV of EGFR in the heterodimer, and iv) molecular dynamics and energy minimization of EGFR-HER2 heterodimer.
Docking of EGFR domains I–III and HER2 domain I–IV: Docking of EGFR and HER2 were performed using the software ZDOCK. ZDOCK (61, 62) is a fast, rigid-body, protein-protein docking algorithm that applies a pair-wise shape complementarity method that uses fast Fourier transformation. PDB structures of HER2 and EGFR were downloaded from the protein data bank. HER2 extracellular domain I–IV without antibody (5, 6, 63) herceptin was used. The structure was corrected for gaps/breaks using InsightII software. For EGFR, one of the molecules in the dimer structure was used. EGFR domains I–III without domain IV were used in the calculations. The resulting 20 best possible structures were used for final analysis. These 20 structures were generated based on shape complementarity in the first stage and scored on the basis of electrostatic and desolvation energy. The structures were minimzed to optimize the electrostatic interactions. Most of the docked structures showed that EGFR and HER2 interactions are predominant around domain II in both proteins. Based on the data available in the literature for domain II interactions in the two proteins, final models were selected. For final representation of the structure, PyMol software was used.
Docking of domain IV of EGFR and HER2: EGFR dimer crystal structure lacks domain IV. For EGFR protein, domain IV structure was obtained from EGFR monomer structure (64) (PDB ID 1NQL). To investigate how the IV domains of EGFR and HER2 interact, separate docking studies of EGFR and HER2 were carried out using ZDOCK. Domain IV of EGFR (513–614) and HER2 (481–611) were docked. The output consisted of ten structures with low-energy of docking and complementary surface matching. Among these ten structures three structures showed contact of C-terminal part of domain IV. The remaining structures exhibited antiparallel orientation of two domains. The resulting structure is only used as template to arrange the orientation of domain IV in the next stage of the model.
Modeling of domain IV of EGFR in the heterodimer: The structure of EGFR of Drosophila contains domains I–IV in autoinhibited form (65) and resembles the open conformation of EGFR with domain IV. Drosophila EGFR domain IV and HER2 EGFR domain IV were used as models of EGFR structure with domain IV in extended form. Comparison of domain IV of EGFR, Drosophila and HER2 indicated that the rms deviation of backbone atoms of three structures overlapped was 0.73 Å. Hence, the Drosophila structure was used as a template to model domain IV of EGFR. To the docked heterodimer structure of EGFR-HER2, domain IV was added based on the template structure of Drosophila EGFR.
Molecular dynamics and energy minimization of EGFR-HER2 heterodimer: The heterodimer structure of EGFR-HER2 with domains I–IV was minimized and subjected to molecular dynamics for 20 ps. During the dynamics, domain IV of EGFR and HER2 were brought into proximity by constraints based on the fact that C-terminal region of EGFR and HER2 domain IV interact. The resulting heterodimer structure was further subjected to 10 ps molecular dynamics at 300 K. During these dynamics calculations, all the domains (I–IV) of the heterodimer were allowed to move. Every 100th structure was saved during the dynamics, and a plot of energy vs. time was obtained. From this plot, the lowest energy structure was chosen and that structure was refined with minimization using the steepest descent method. The final structure was analyzed for quality of the structure using Ramachandran plot (66). To understand the dynamics of interactions of domain IV of the two proteins (HER2 and EGFR), the entire extracellular domains of the complex obtained from the modeling described above were subjected to 30 ps 600 K dynamics. From the history file of dynamics, plots of distance vs. time (distance between the atoms of particular amino acids (in domain II and domain IV of EGFR and HER2) were obtained. Comparison of the heterodimer with the homodimers of EGFR and HER2 was performed to reveal the changes differences in EGFR and HER2 structures from monomer structures.
Results
Antiproliferative activity of the peptidomimetics
We have previously reported the antiproliferative activity of HERP5 in SKBR-3, MCF-7, and HCT-116 cell lines (45). In the present study, we have used BT-474 cell lines, which are known to overexpress HER2 protein. To evaluate the antiproliferative activity of HERP5 (Figure 1A) in BT-474 cell lines, microculture tetrazolium assay (MTT) and CellTiter-Glo assay (47, 48, 67) were used. MTT assay is based on the ability of metabolically active cells to reduce the yellow tetrazolium salt to a colored formazan product, whereas CellTiter-Glo assay is a method of determining the number of viable cells based on quantitation of ATP present (48,67). Compound HERP5 exhibited an IC50 value 0.896 μM in BT-474 cell lines.
Fluorescence assay and competitive binding studies
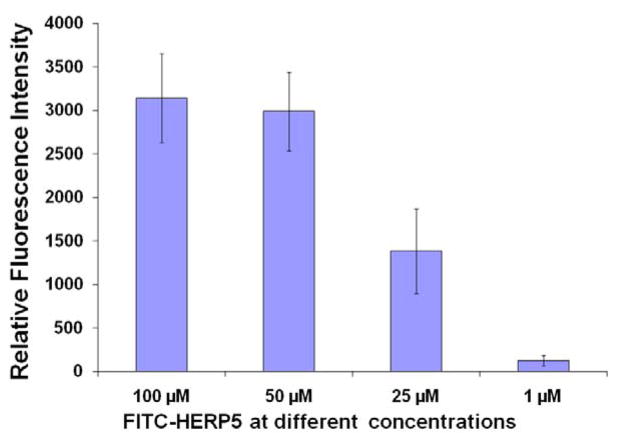
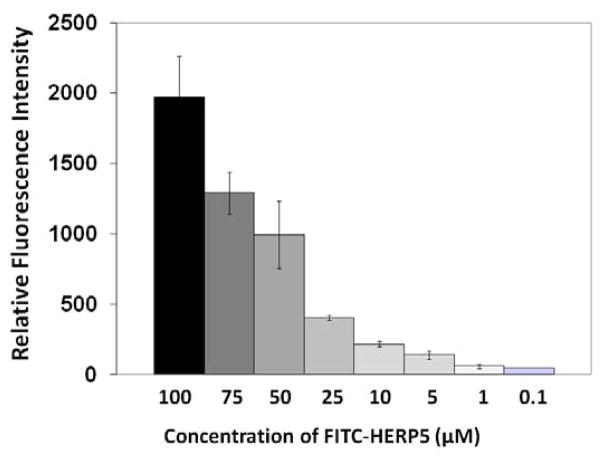
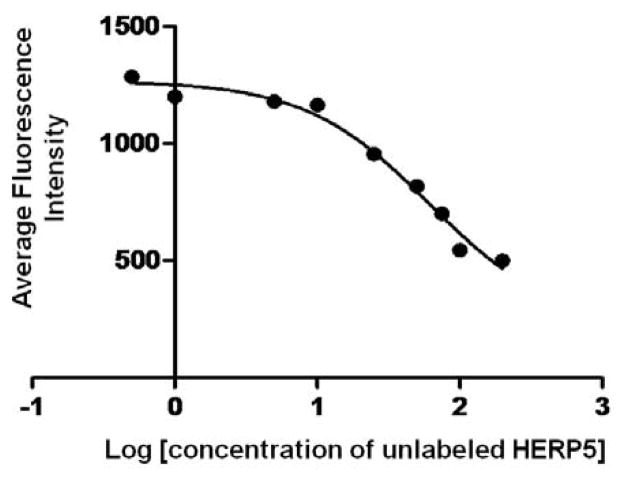
The peptidomimetic HERP5 was designed based on the crystal structure of HER2-herceptin complex. The hypothesis is that peptidomimetics can be designed to bind to HER2 and block the interaction of HER2 with other EGFR proteins and, hence, the cell signaling (by phosphorylation of the kinase domain), thereby inhibiting cell growth. The objective here was to evaluate (a) the binding of FITC-HERP5 with HER2 protein domain IV and (b) the binding properties of HERP5 to HER2 on the cell surface using fluorescently labeled HERP5 (FITC-HERP5, Figure 1B). The fluorescence assay was carried out using domain IV of the HER2 protein coated on 96-well plates. Results from the assay indicated that FITC-HERP5 binds to domain IV of HER2 in a concentration-dependent manner (Figure 2). Statistical analysis of the results indicated that there was significant binding of FITC-HERP5 at 100, 50, and 25 μM compared to the control and 1 μM of FITC-HERP5 (p <0.05). There was no difference in binding of FITC-HERP5 to HER2 domain IV at concentrations of 100 and 50 μM (p>0.05). Furthermore, we investigated the binding ability of FITC-HERP5 on cells that overexpress HER2 protein. Figure 3 shows the fluorescence assay carried out for FITC-HERP5 on BT-474 cell lines that overexpress HER2 protein. The results obtained clearly indicate that HERP5 binds to HER2 protein on the BT-474 cell lines. For comparison, an antibody to the extracellular region of HER2 protein was used. A competitive binding assay was also carried out to investigate the ability of unlabeled HERP5 peptidomimetic to inhibit the binding of FITC-labeled HERP5 to HER2 protein on BT-474 cells. Figure 4 shows the competitive binding curve for unlabeled HERP5 binding to BT-474 cells. Assuming simple one-site binding, curve fitting was obtained by providing the concentration of FITC-HERP5 (50 μM) and Kd values in the range of 1–10 μM (preliminary biacore experiments, Supplementary Material). The affinity constant, Ki, value obtained was 1.19 ± 0.12 μM (R2 = 0.982), suggesting specific binding of HERP5 to HER2 protein. Similar experiments were carried out on MCF-7 cell lines. There were no changes in the fluorescence intensity of labeled peptides bound when the unlabeled peptide concentration was varied, suggesting that HERP5 binds to MCF-7 cells non-specifically (Supplementary Material).
Figure 2.
Binding of FITC-HERP5 to domain IV of HER2 protein at different concentrations as revealed by fluorescence assay. Data are from triplicate experiments using a 96-well plate reader. Fluorescence excitation λ 485 nm, emission λ 528 nm.
Figure 3.
Binding of FITC-HERP5 to BT-474 cells at different concentrations as indicated by fluorescence assay. Data are from triplicate experiments using a 96-well plate reader. Fluorescence excitation λ 485 nm, emission λ 528 nm.
Figure 4.
Competitive binding of labeled peptide FITC-HERP5 with various concentration of unlabeled HERP5 to BT-474 cells. The binding curve was obtained by assuming a simple one-site binding; curve fitting was performed using Graphpad prism. Data are from triplicate experiments using a 96-well plate reader. The affinity constant (Ki) value obtained was 1.19 ± 0.12 μM (R2 = 0.982), suggesting specific binding of HERP5 to HER2 protein. The concentration of FITC-HERP5 was 50 μM; unlabeled HERP5 concentration was varied from 500 to 0.05 μM.
Fluorescence microscopy
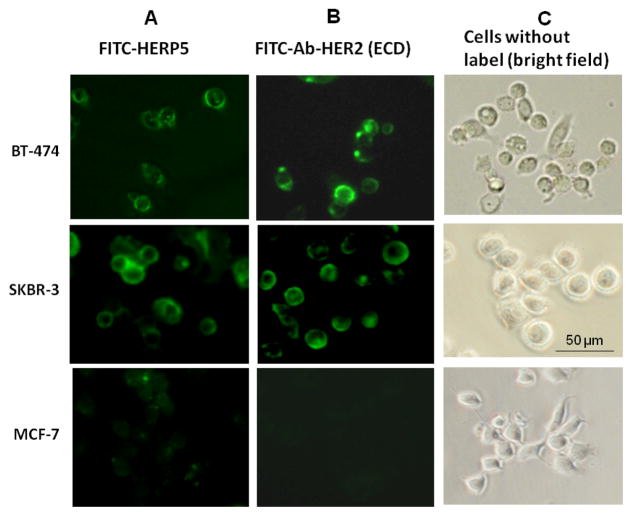
The fluorescence assay and competitive binding studies described above provided the information that FITC-HERP5 binds with HER2 protein expressed in BT-474 cell lines. To visually observe this, fluorescence microscope studies were carried out. FITC-HERP5 was incubated with breast cancer cell lines SKBR-3, BT-474 and MCF-7, and cells were visualized under a fluorescence microscope. Figure 5A shows specific binding of FITC-HERP5 to SKBR-3 and BT-474 cell lines. Non-specific binding was observed for the MCF-7 cell line, which does not overexpress HER2 protein. In comparison, Figure 5B shows binding of FITC-labeled antibody to the extracellular region of HER2 to SKBR-3 and BT-474 cell lines. There was no antibody binding to MCF-7 cell lines as they do not overexpress HER2 protein. Figure 5C shows cells in bright field.
Figure 5.
Binding of FTIC-HERP5 and antibody to HER2 protein (FITC-Ab-HER2(ECD)) on cells that overexpress HER2 protein (BT-474 and SKRB-3) and cells that do not overexpress HER2 protein (MCF-7) using fluorescence microscopy. Specific binding was observed for (A) FITC-HERP5 and (B) FITC-Ab-HER2 to BT-474 and SKBR-3 cells. For MCF-7 cell lines, non-specific binding of FITC-HERP5 was observed. No antibody binding was observed for MCF-7 cell lines. (C) Cells without label in bright field. 20X maginification. FITC-HERP5, 50 μM; FITC-Ab-HER2, 0.55 μg/well.
Structure of peptidomimetic HERP5
To evaluate the structure-activity relation of HERP5, the three-dimensional structure of HERP5 was modeled based on NMR-restrained molecular dynamics simulations. Linear peptides/peptidomimetics of 10 amino acids or less show flexible conformation in solution. The observed NMR spectral parameters (chemical shift, coupling constant, and ROE) are averaged values of the conformers that exist in solution (53, 68). Hence, based on the NMR data and NMR-restrained molecular dynamics simulations, the most probable structures of the peptidomimetics in solution were proposed. NMR studies were carried out in 90% H2O/10% D2O. 2D-NMR data (TOCSY, ROESY, and DQF-COSY) of HERP5 are available as Supporting Material.
HERP5
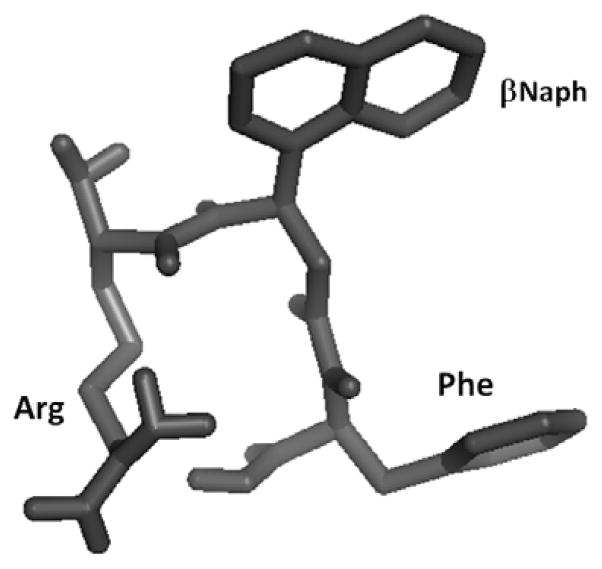
The amide region of NMR spectrum of HERP5 was well resolved over 1 ppm for three amino acids. Arg with a free amino group did not show NH resonances. ROESY spectrum of HERP5 showed sequential connectivities between CαH (i)-NH (i+1) residues. The amide region of the ROESY spectrum did not show any cross-peaks for amide-amide connectivity, indicating the flexible structure of the peptide. Notable ROE peaks were sequential between CαH (i)-NH (i+1) residues and between HN of βNaph and Hβγ resonances of Arg, suggesting that the Arg side chain is bent toward the backbone of the βNaph residue. A total of 17 inter- and intra-residue ROEs were used to calculate the structure of HERP5. The NMR-restrained MD-simulated structure of HERP5 is shown in Figure 6. The structure formed a pseudo β-turn type of structure with an Arg side chain and a βNaph residue. There was intramolecular hydrogen bonding between C=O of βNaph and NH of the Arg residue, forming a γ-turn type of structure.
Figure 6.
NMR distance-restrained MD-simulated energy minimized representative structures of HERP5.
Circular dichroism studies
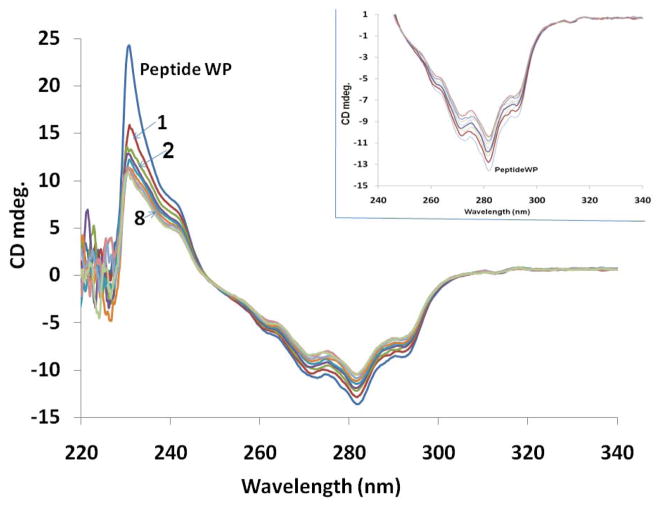
The circular dichroism spectrum of HERP5 peptidomimetic exhibited a negative band with fine structures in the range of 260 to 290 nm and a positive band around 230 nm (Figure 7). The negative band around 230 nm is attributed to the aromatic βNaph group and Phe amino acid residue (69). Below 230 nm the spectrum of HERP5 did not show any CD bands, and the spectrum was noisy around the baseline. The fine structure of the negative band around 280 nm might be due to aromatic interactions between Phe and the βNaph group of the peptidomimetic. Such induced CD spectra of napthalene compounds are very sensitive to their environment (70, 71). It was observed that HERP5 exhibits CD bands in the region from 230 to 300 nm, whereas HER2 protein extracellular domain has CD bands in the region from 190 to 230 nm. Thus, there is no overlap in the CD spectra of peptidomimetic HERP5 and protein HER2 (Supplementary Material). Binding of HERP5 to HER2 protein extracellular domain was monitored by adding aliquots of protein solution to HERP5 and observing the changes in the CD spectra of HERP5. At the concentrations at which HER2 protein was added, no CD spectrum was observed for HER2 protein. Due to this non-overlapping of CD spectral region of the two molecules and low signal intensity of HER2 protein, the interaction of HERP5 with protein HER2 could be studied. Upon addition of protein HER2 to the peptide solution, the CD spectrum of the peptidomimetic changed in intensity. The stepwise change in the CD spectrum of HERP5 upon addition of different amounts of protein HER2 ECD domain is shown in Figure 7 (protein:peptide concentration ratio was 1:1000 to 1:150). The positive CD band around 230 nm decreased in intensity with the addition of protein to HERP5 peptide. The inset shows the changes in bands around 280 nm upon addition of protein HER2 ECD domain. A plot of change in intensity of the CD band at 230 nm with different ratios of protein to peptide (Supplementary Material) indicated a saturation of change in CD signal as the concentration of protein was increased, suggesting specific binding of the peptidomimetic HERP5 to protein HER2 extracellular domain. Changes in the 280 nm band and 230 nm band indicate that the aromatic βNaph group and the backbone of the peptidomimetic are involved in interaction with the protein HER2. Control experiments conducted by using analogs of HERP5 suggested that HERP5 binds specifically to protein HER2.
Figure 7.
CD spectrum of HERP5 and changes in the CD spectra of HERP5 upon addition of the extracellular domain of protein HER2 at different protein:peptide concentrations (1:1000 to 1:150). WP is without protein. 1, 2, and 8 are at different protein concentrations. Details are provided in the text.
Defining the possible binding site of HERP5 on HER2 domain IV using FT-map
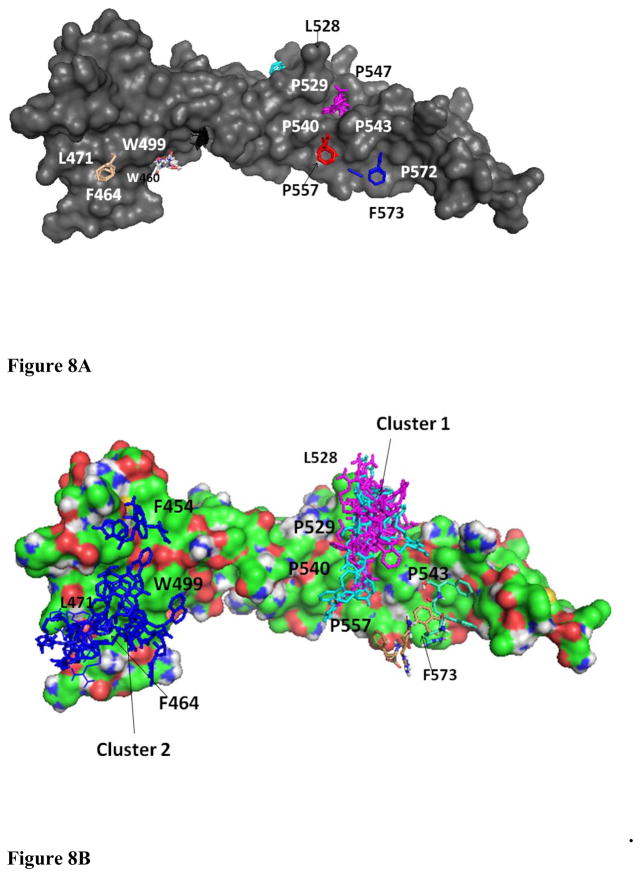
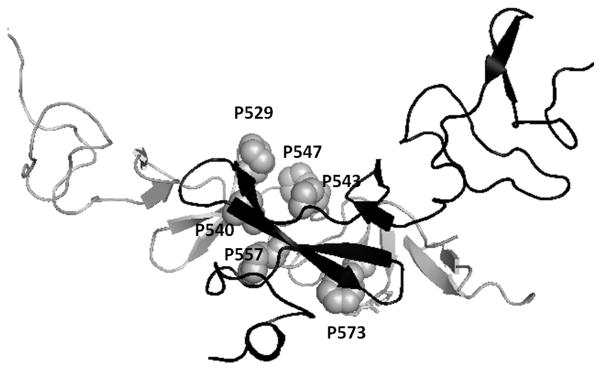
The experiments described above clearly suggest that HERP5 binds to the extracellular domain of HER2 protein and, in particular, domain IV. Domain IV consists of nearly 80 amino acids. We wanted to investigate the possible binding site of HERP5 on domain IV of HER2. Defining the exact binding site of a small molecule on a protein surface is a tedious task and requires the selective labeling of protein with 15N or 13C nuclei or photoaffinity labeling (72, 73). Here we used a computational method to define the possible binding site of HERP5 on domain IV of HER2 protein. In FTMap (60), the structure of the protein is soaked with solvent molecules of different polarity (16 small molecules such as ethanol, isopropanol, isobutanol, acetone, acetaldehyde, dimethyl ether, cyclohexane, ethane, acetonitrile, urea, methylamine, phenol, benzaldehyde, benzene, acetamide, and N,N-dimethylformamide as probes). Favorable binding spots on the protein surface are identified by docking and free-energy calculations. The low energy clusters are grouped into consensus sites, and the largest consensus sites are defined as possible ligand binding sites. Figure 8A shows the possible sites of ligand binding on HER2 domain IV. The lowest docked energy cluster 1 was near a hydrophobic cavity surrounded by proline residues P529, P540, P543, and P557 near the C-terminal portion of domain IV of HER2. The second cluster was near the N-terminal of domain IV surrounded by W460, F464, L471, and W491. These two clusters were chosen as possible binding sites of HERP5 peptidomimetic on HER2 protein domain IV.
Figure 8.
(A) Determination of possible binding sites of ligand on the domain IV of HER2 protein using FTmap. The C-terminal portions of domain III and domain IV of HER2 protein are shown in surface representation. Solvent molecules used as probes are shown in color. A cluster of solvent molecules at a particular site on a protein represents the possible binding site of ligand. The array of clusters around P529, P540 to P572, F573 indicates the most likely binding site of ligand (see text for details). (B) Low energy docked structures of HERP5 with HER2 protein domain IV. Two possible clusters of docking are shown in the figure. HER2 protein domain IV is shown in surface representation. A comparison of a possible binding site (from Figure 8A) and cluster 1 of HERP5 binding on HER2 suggests that a possible binding site of HERP5 on HER2 protein is around the hydrophobic pocket formed by proline residues shown in the figure. Cluster 2 is at the interface of domain III and domain IV of HER2 protein.
Docking of HERP5 on HER2 protein
Docking of HERP5 and its analogs has been described in an earlier published report (45). However, in that report, docking calculations were done with a limited grid box on HER2 domain IV that encompassed the region of the herceptin binding site (covering 40 × 40 × 40 Å3 box). The docking was performed to compare different analogs of HERP5 molecules for binding to HER2 protein using virtual screening. Our aim here is to show that HERP5 peptidomimetic binds to domain IV of HER2 and model the possible binding. Hence, we carried out the detailed docking of HERP5 on HER2 domain protein encompassing the entire domain IV. Although overlapping grid boxes to cover the entire domain IV of HER2 were used and docking was performed in each grid box, the results indicated that low energy docked structures were clustered in two areas on HER2 domain IV. The docking energy, free energy of binding calculated from docking and the possible area with number of structures in each cluster are shown in Table 1. Docking using a grid box around the C-terminal and the center of domain IV resulted in low energy conformers with a cluster around the hydrophobic pocket near the amino acid residues P529, P540, and P543 (Figure 8B). The second cluster was obtained by docking using a grid box near the N-terminal of domain IV and C-terminal part of domain III. The low-energy docked conformers were around a hydrophobic pocket near amino acid residues F464, L471, and W499. This region is an interface of domain III and domain IV of HER2 protein. The calculated free energy of binding and docked energy was relatively high compared to that of cluster 1. Considering the energy and number of conformers in the cluster, and the interface of domain II and IV, we can conclude that the hydrophobic pocket near P529, P540, and P543 is a possible binding site of HERP5 on HER2 protein.
Table 1.
Cluster of docked conformations and binding energy for docking of HERP5 on domain IV of HER2 protein. Docking was performed using three overlapping grid boxes on the protein.
| Parameter | Grid box around HER2 domain IV | ||
|---|---|---|---|
| N-terminal (interface of domain III and IV) | C-terminal | Center | |
| Calculated free energy of binding (kcal/mol) of the lowest docked structure | −2.9 | −4.31 | −3.72 |
| a Docking energy (kcal/mol) | −5.27 | −6.51 | −6.65 |
| Number of conformations in the cluster near the defined region (out of 50 low energy docked structures) | 10 | 17 | 18 |
| Position of docked structure on HER2 protein | Hydrophobic pocket around F464, L471,W499 Cluster 2 | Hydrophobic pocket around P529, P540 P543 Cluster 1 | Hydrophobic pocket around P529, P540 P543 Cluster 1 |
Docking energy is final intermolecular energy consisting of Van der Waals, Hydrogen bonding, desolvation and electrostatic energy.
Docking of HER2 and EGFR
HER2 and EGFR are known to form heterodimers (9, 63, 74). This heterodimerization leads to phosphorylation of the kinase domain, which is important for cell growth and differentiation. To understand how the peptidomimetic HERP5 modulates this signal by binding to HER2 protein, a model was proposed based on the protein-protein docking studies. Several models were obtained from docking of EGFR domain I–III and HER2 domains I–IV (extracellular domain only) using ZDOCK. Dimer models that are compatible with previously reported experimental observations were chosen for final analysis. The following experimental reports were used to choose the final model. Domain II of HER2 interacts with domain II of EGFR to form a heterodimer. EGFR forms a homodimer whereas HER2 is not known to form a homodimer. The 3D structures of ligand-bound EGFR and unligated HER2 overlap with a backbone rmsd of 4.9 Å (5, 6, 63, 75). Based on this, we made the assumption that EGFR homodimer and EGFR-HER2 heterodimer should be similar. The modeling of heterodimer of HER2-EGFR was carried out in four stages as described in Materials and Methods. In the first stage, domain I–II of EGFR was docked with domain I–IV of HER2. Among the low docked energy structure which has high surface complementarity, only those complexes that form dimerization at domain II were selected. In model 1, the three-dimensional structure of the complex of EGFR-HER2 was similar to the EGFR homodimer. In model 2, the dimerization interaction between EGFR and HER2 was in domain II. However, domains I–III of EGFR and HER2 were nearly perpendicular to one another compared to the almost parallel orientation of domains I–II in the EGFR homodimer. If we consider model 2 of the complex and insert domain IV in the structure of EGFR, domain IV of EGFR will not interact with domain IV of HER2 because of the orientation of domains I–III of EGFR with respect to HER2 (domains IV of the two proteins will be away from each other in this model). Thus, model 1 was considered the best model to represent the EGFR-HER2 dimer. Model 1 was refined by energy minimization, and the quality of the structure was evaluated by MolProbity (66). A Ramachandran plot showed that 89.8% of the residues were in the favoured region and 98.9% were in the allowed region with 1.1% outliers.
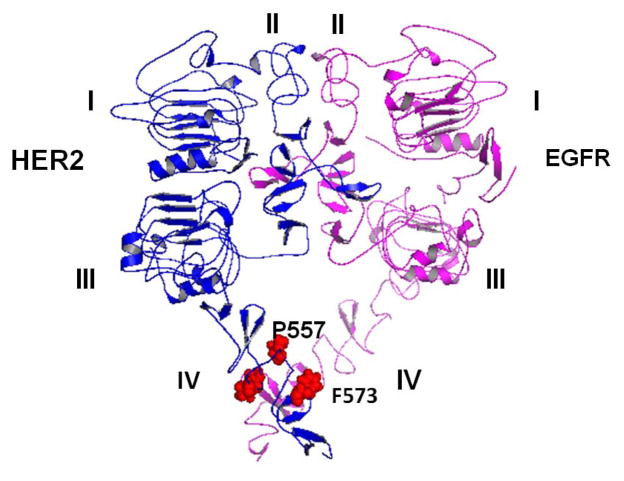
In the second stage, only domains IV of HER2 and EGFR were docked. The possible docked model is shown in Figure 9. In the docked structure, the C-terminal portions of HER2 and EGFR interact with one another. In the third stage, domain IV was added to EGFR. To properly orient domain IV with respect to domain III, the crystal structure of EGFR of drosophila domain IV of EGFR was used and the heterodimer of HER2-EGFR containing all the extracellular domains (I to IV) was built. In the fourth stage of modeling, the heterodimer was subjected to molecular dynamics and energy minimization. The minimized model was analyzed for its quality using MolProbity; 96.7% (1230 total residues) of the residues were in the allowed region of the Ramachandran map. The model containing all four extracellular domains of EGFR and HER2 is shown in Figure 10.
Figure 9.
Possible docked model for the interaction of domain IV of EGFR and HER2. Using Z-DOCK, only domains IV of HER2 and EGFR were docked. EGFR is shown as a dark ribbon and HER2 as a light ribbon. Possible interacting residues are shown.
Figure 10.
Proposed model for EGFR-HER2 interaction with domains I–IV. Note that domain IV of EGFR was modeled based on EGFR of drosophila (open conformation) and EGFR domain IV structure (closed conformation). The final model was obtained by molecular dynamics of the heterodimer after adding domain IV to EGFR domains I–III and HER2 domains I–IV. C-terminal portions of domain IV of EGFR and HER2 seem to interact with one another. Amino acid residues in domain IV of the HER2 protein that interact with EGFR are shown. These residues also form the possible binding site of HERP5 peptidomimetic.
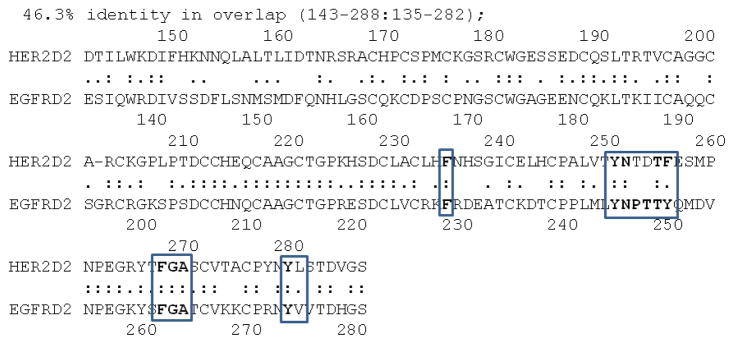
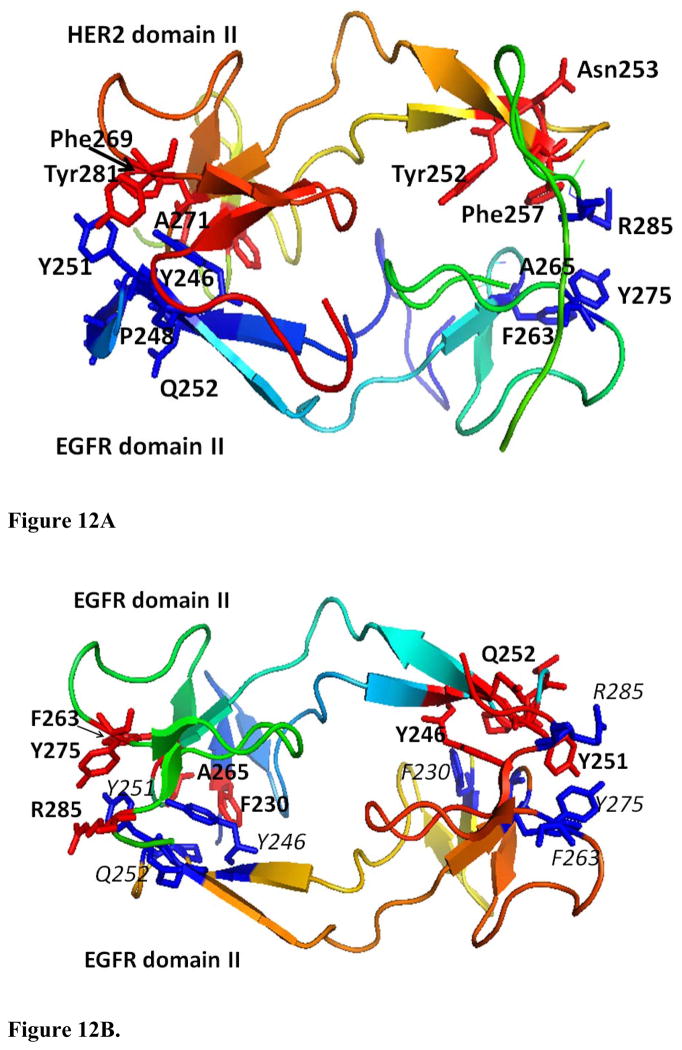
Comparison of the sequences of domain II of HER2 and EGFR (Figure 11) indicated that there is a 46% sequence identity between the two. It is also known that the dimerization arm of domain II has conserved residues in the sequences in growth factor receptors. Of these, important residues that are conserved are F236, Y252, N253, F257, F269, A271, and Y281 (63). In the dimerization arm of the proposed models of EGFR and HER2 complexes, these residues are on the interacting surface as shown in Figure 12A. Comparison of the dimerization arms of EGFR (Figure 12B) and HER2 clearly indicates that both are similar with conserved residues.
Figure 11.
Sequence comparison of domain II of EGFR and HER2. Residues that are conserved in domain II and that are important in dimerization are highlighted in boxes. Amino acids 143–288 in HER2 and 135–282 in EGFR are compared.
Figure 12.
A) HER2 and EGFR domain II-interactions with residues in domain II that are important for dimerization are shown (blue –EGFR, red-HER2). B) Homodimer structure of dimerization arm of EGFR (domain II) interaction. Important residues from one of the EGFR domains II are shown in blue and those from the other homodimer partner are shown in red.
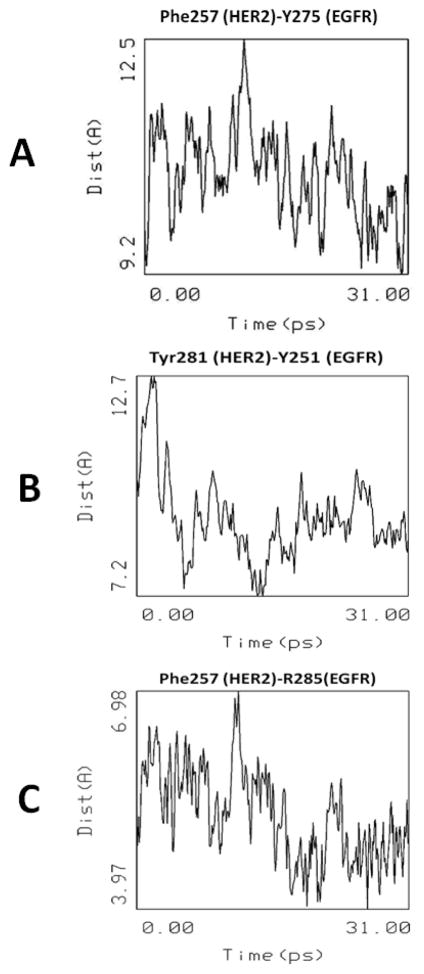
To understand the dynamics of interaction of domain IV of HER2 and EGFR, and to evaluate the stability of the proposed model, the heterodimer structure was subjected to molecular dynamics at 300 K for 10 ps and 600 K for 30 ps. The distances between conserved residues in domain II and domain IV that are important in interactions between EGFR and HER2 were analyzed. A plot of time vs. distance between Cα atoms of F257 of HER2 and Y275 of EGFR is shown in Figure 13. The variation in the distance between the Cα atoms of F257 and Y275 suggests that, overall, there is no significant change in the distances in the dimerization arm; this suggests the stable nature of the dimer. Similarly, the distance between Y281of HER2 and Y251 of EGFR indicated that in domain II the dimerization arm is energetically stable during the dynamics in the heterodimer structure of the model. For comparison, the distance between similar residues in EGFR homodimer were measured. The distances between Cα atoms of Y275 to Y251 in the dimerization arm was 9.6 Å and the distance between R285 and Y251 was 6.3 Å. From Figures 13A and C, it is very clear that, in the HER2-EGFR heterodimer, the corresponding distances between Cα atoms of F257-Y275 and F257-R285 were stable around 9.6 and 6.0 Å during the dynamics.
Figure 13.
Changes in the distance between important amino acid residues in domain II (A, B, C) that are involved in protein-protein interaction between HER2 and EGFR during the 30 ps molecular dynamics.
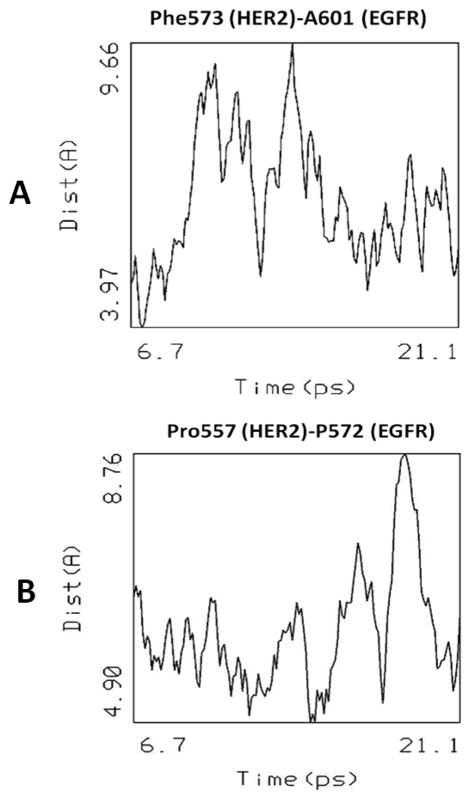
Domain IV is known to be flexible in both EGFR and HER2. The dynamics of domain IV for 30 ps at 600 K indicated that after 20 ps domains IV of HER2 and EGFR were folded towards domain III of the respective proteins. We believe that this is due to the flexible nature of domain IV and the absence of transmembrane domain in the structure used for modeling. During 20 ps of dynamics, domains IV of HER2 and EGFR were interacting with one another as shown by distance between the C-terminal amino acids of domain IV (Figure 14A). The distance between F573 of HER2 and A601 varied from 3.9 to 9.6 Å during the dynamics, suggesting that the side chains of the amino acids of domain IV of HER2 and EGFR interact with one another at the C-terminal. Similarly, the distance between P557 and P572 side chain Cα atoms (Figure 14B) suggest that the hydrophobic pocket around proline residues participates in interactions between the proteins. Based on the docking of EGFR domains I–III and HER2 domain I–IV, a model was proposed for domains I–IV of EGFR and HER2. A possible site of HERP5 peptidomimetic on domain IV is highlighted in Figure 10.
Figure 14.
Changes in the distance between important amino acid residues in domain IV (A, B) that are involved in protein-protein interaction between HER2 and EGFR during the 30 ps molecular dynamics. Results for dynamics from 6 to 21 ps are shown.
Discussion
The crystal structure of HER2-herceptin complex indicates that the binding site on HER2 domain IV has a pocket-like structure homologous to that of domain II of other HERs (5). This pocket accommodates binding of small peptide/peptidomimetic molecules, which can modulate HER2-mediated signaling. Domains II and IV of the HER2 extracellular region play major roles in multimerization of HERs and the downstream signaling that leads to cell growth (6). Herceptin (anti-HER2) binds to HER2 on the C-terminal portion of domain IV. This interaction is known to block proteolytic cleavage in HER2 and indirectly affect dimerization with other HERs that induce signaling pathways. Thus, blocking any interaction in these regions on HER2 can disrupt signaling pathway(s) that promote cell proliferation and cancer. Using in silico and rational drug design approaches, we designed and synthesized a peptidomimetic HERP5 that showed antiproliferative activity against HER2--overexpressing breast cancer cell lines with IC50 of 0.396 μM in SKBR-3 and 0.896 μM in BT-474 cell lines that overexpress HER2 protein, 16.9 μM in MCF-7, and 25.7 μM in HCT-116 cell lines that do not overexpress HER2 protein (45).
In this study, our aim is to show that the peptidomimetics we designed bind to domain IV of the HER2 protein and to model the interaction between EGFR and HER2 and show how the peptidomimetic modulates this interaction in the extracellular domains of HER2 and EGFR protein. To understand the molecular mechanism of the activity of the compound HERP5 and to identify the proposed target for HERP5 peptide, fluorescence assays were carried out using domain IV of HER-2 protein and breast cancer cell lines that overexpress HER2 protein. From these studies it is very clear that HERP5 binds to HER2 protein domain IV and possibly to the extracellular domain of HER2 protein in BT-474 and SKBR-3 cell lines. Circular dichroism studies suggested that there is a change in the CD signals of HERP5 in the presence of protein HER2 and, hence, that HERP5 binds to the extracellular region of HER2 (Figure 7). The changes in the CD signals observed were around the 230 nm and 280 nm bands. The negative CD band at 280 nm was due to the βNaph ring of HERP5 (69). Upon addition of HER2 protein, the CD signal at 280 changed in intensity, which is indicative of the βNaph moiety of the peptidomimetic interacting with HER2 protein. Although the concentration of protein added was very small compared to the peptide concentration, a change in the CD spectrum was observed. It is known that aromatic compounds with induced CD spectra are very sensitive to changes in the environment. In derivatives of napthalenes that form host-guest complexes with cyclodextrins, changes in CD spectrum have been observed due to binding and changes in the environment of the orientation of the bound compound (70, 71). Changes observed in the CD spectrum clearly suggest that the Naph group of HERP5 is involved in binding to the protein. Docking studies indicated that the βNaph moiety of HERP5 interacts with hydrophobic region near the P543 of HER2 protein. Fluorescence microscopy data suggests that HERP5 specifically binds to HER2-overexpressing breast cancer cell lines as seen in Figure 5. Competitive binding studies indicated that HERP5 specifically binds to HER2-overexpressing cell lines with an affinity constant of 1.19 μM.
The studies presented here provide evidence for binding of HERP5 to HER2 protein. However, the exact mechanism of binding of HERP5 and its effect on HER2 protein on the multimerization process is not clear. Domain II of HER2 is known to be involved in heterodimerization with other HERs. EGFR is known to interact with HER2, forming a heterodimer, which leads to downstream signaling for cell growth. The interaction of domain IV of HER2 with EGFR is not clear. Blocking domain IV of HER2 with antibodies is known to suppress the growth of cancer cells by indirectly inhibiting the dimerization mechanism of HER2 with other receptors. Previous reports have indicated that domain IV mutation impairs phosphorylation (75). It is also known that C-terminal part of the domains interact with one another and absence of domain IV of HER2 changes the heteromeric signaling of EGFR (76). Peptides from module 6 and 7 of domain IV of HER2 can disrupt HER2 interaction with other receptors (23), and HER2/ErbB2 is reported to resemble autoinhibited invertebrate EGFR (77). To understand the molecular mechanism of peptidomimetic HERP5 and its antiproliferative activity, modeling of EGFR-HER2 heterodimerization was carried out. A model for HER2-EGFR interaction was proposed (Figure 10), which is consistent with experimentally observed results from the literature. In the model of EGFR-HER2, the dimerization arms of domain II in both proteins interact with one another, stabilizing the dimer. The conserved residues in domain II of EGFR and HER2 participate in stabilizing the dimer interface at protruding β-hairpin region. Franklin et al (10) have proposed a model for EGFR-HER2 heterodimer based on mutational studies and the crystal structure of EGFR homodimer. In EGFR homodimer residues R285 and Y246 interact across the dimer interface. In the HER2 protein the corresponding residue is L291. In the proposed model of HER2-EGFR, the L291 hydrogen bonds with Y251 stabilizing the dimer. Mutagenesis studies have shown that in HER2, H296 and L295 are important for dimerization of EGFR and HER2. In the previous proposed model of HER2-EGFR, it is shown that H296 of HER2 and D279 of EGFR are in proximity forming the dimer interface. Mutation and binding studies of HER2 with an antibody pertuzumab (10) suggested that substitution of H296 with alanine resulted in significant loss of binding of antibody. This clearly indicates the importance of H296 in hetero dimerization. In the model proposed in this study, the H296 of HER2 and the D279 of EGFR are in proximity with side chains at a distance of 5 Å, and Cα atoms of the two residues at a distance of 10 Å. H296 of HER2 forms hydrogen bond with K301 of EGFR. The model of EGFR-HER2 is similar in interaction to EGFR homo dimer. However, the overall structure of HER2-EGFR heterodimer is different from EGFR homodimer. EGFR homodier is symmetric, whereas, HER2-EGFR heterodimer is asymmetric. The main reason for asymmetry is a result of absence of ligand in HER2 which is present in EGFR. Domain IV C-terminal part from EGFR and HER2 seem to interact near F573 and P557 of HER2 (Figure 10). A recent report on the EGFR dimer with domain IV using electron microscopy provided evidence for the interaction of the C-terminal portion of domain IV of two EGFR molecules in the EGFR homodimer (78). Domain IV is very flexible and the nature of interaction of domain IV in two proteins is dynamics. In the reported crystal structure of HER2 and EGFR, domain IV in open conformation could not be defined with high resolution. Electron density for domain IV steadily deteriorates and becomes untraceable near the C-terminal part of domain IV (near residues 600 onwards). To understand the flexible nature of domain IV and stability of the proposed dimer interface molecular dynamics studies were carried out. Results from 300 K and 600 K dynamics suggested that dimer interface near domain II is stable (Figures 13&14). Based on this model and binding of HERP5 on domain IV of HER2 using docking studies, we propose that HERP5 binds to the C-terminal part of domain IV and thus modulates the interaction between EGFR and HER2. Further studies with NMR of isotopically labeled protein are needed to understand the details of the way that HERP5 modulates the signal for cell growth.
Conclusions
Peptidomimetics with conformational constraints were designed based on the HER2:herceptin crystal structure. The peptidomimetics designed exhibited antiproliferative activity against breast cancer cell lines. NMR and molecular dynamics studies revealed the structure of the peptidomimetics in solution. Fluorescence assay and microscopy studies indicated that peptidomimetic HERP5 binds to the extracellular region of HER2 protein. A model for peptidomimetic binding to HER2 protein domain IV was proposed using docking studies. Based on our studies and protein-protein docking, a possible model for HER2-EGFR heterodimer was proposed in which domain IV of EGFR interacts with domain IV of HER2 protein. The results obtained will help us to design small molecules that have specificity toward HER2-overexpressing breast cancer cell lines.
Supplementary Material
Acknowledgments
The project described was supported by Grant Number P20RR016456 from the National Center for Research Resources. The content is solely the responsibility of the authors and does not necessarily represent the official views of the National Center for Research Resources or the National Institutes of Health. Part of the docking calculations were performed using Dell Clusters, Louisiana Optical Network Initiative (LONI) computer resources. The authors would like to thank the NMR facility, Department of Chemistry, Louisiana State University, Baton Rouge for obtaining the NMR spectra of the peptides.
Footnotes
Supplementary material dealing with HPLC, mass spectra, 2D-NMR data, and control experiments mentioned in the text is available at no charge from the authors directly or can be downloaded free of charge from the author's server at URL --------------. The supplementary data can also be purchased from Adenine Press for US $50.00.
References
- 1.Hynes NE, Lane HA. Nat Rev Cancer. 2005;5:341–354. doi: 10.1038/nrc1609. [DOI] [PubMed] [Google Scholar]
- 2.Baselga J, Swain SM. Nat Rev Cancer. 2009;9:463–475. doi: 10.1038/nrc2656. [DOI] [PubMed] [Google Scholar]
- 3.Woodburn JR. Pharmacol Ther. 1999;82:241–250. doi: 10.1016/s0163-7258(98)00045-x. [DOI] [PubMed] [Google Scholar]
- 4.Hobbs S, Cameron EM, Hammer RP, Le ATD, Gallo RM, Blommel EN, Coffing SL, Chang H, Riese DJ. Oncogene. 2004;23:883–893. doi: 10.1038/sj.onc.1207250. [DOI] [PubMed] [Google Scholar]
- 5.Cho HS, Mason K, Ramyar KX, Stanley AM, Gabelll SB, Denney DW, Leahy DJ. Nature. 2003;421:756–760. doi: 10.1038/nature01392. [DOI] [PubMed] [Google Scholar]
- 6.Burgess AW, Cho HS, Eigenbrot C, Ferguson KM, Garrett TP, Leahy DJ, Lemmon MA, Sliwkowski MX, Ward CW, Yokoyama S. Mol Cell. 2003;12:541–552. doi: 10.1016/s1097-2765(03)00350-2. [DOI] [PubMed] [Google Scholar]
- 7.Yarden Y, Baselga J, Miles D. Semin Oncol. 2004;31:6–13. doi: 10.1053/j.seminoncol.2004.07.016. [DOI] [PubMed] [Google Scholar]
- 8.Cristofanilli M, Hortobagyi GN. Endocr Relat Cancer. 2002;9:249–266. doi: 10.1677/erc.0.0090249. [DOI] [PubMed] [Google Scholar]
- 9.Ferguson KM. Annu Rev Biophys. 2008;37:353–373. doi: 10.1146/annurev.biophys.37.032807.125829. [DOI] [PMC free article] [PubMed] [Google Scholar]
- 10.Franklin MC, Carey KD, Vajdos FF, Leahy DJ, De Vos AM, Sliwkowski MX. Cancer Cell. 2004;5:317–28. doi: 10.1016/s1535-6108(04)00083-2. [DOI] [PubMed] [Google Scholar]
- 11.Agus DB, Akita RW, Fox WD, Lewis GD, Higgins B, Pisacane PI, Lofgren JA, Tindell C, Evans DP, Maiese K, Scher HI, Sliwkowski MX. Cancer Cell. 2002;2:127–137. doi: 10.1016/s1535-6108(02)00097-1. [DOI] [PubMed] [Google Scholar]
- 12.Allen S, Garrett JT, Rawale SV, Jones AL, Philips G, Forni G, Morris JC, Oshima RG, Kaumaya TP. J Immunol. 2007;179:472–482. doi: 10.4049/jimmunol.179.1.472. [DOI] [PubMed] [Google Scholar]
- 13.Cobleigh MA, Vogel CL, Tripathy D, Robert NJ, Scholl S, Fehrenbacher L, Wolter JM, Paton V, Shak S, Lieberman G, Slamon DJ. J Clin Oncol. 1999;17:2639–2648. doi: 10.1200/JCO.1999.17.9.2639. [DOI] [PubMed] [Google Scholar]
- 14.Nahta R, Esteva FJ. Clin Cancer Res. 2003;9:5078–5084. [PubMed] [Google Scholar]
- 15.Menard S, Pupa SM, Campiglio M, Tagliabue E. Oncogene. 2003;22:6570–6578. doi: 10.1038/sj.onc.1206779. [DOI] [PubMed] [Google Scholar]
- 16.Perez-Soler R. Oncologist. 2004;9:58–67. doi: 10.1634/theoncologist.9-1-58. [DOI] [PubMed] [Google Scholar]
- 17.Slamon DJ, Leyland-Jones B, Shak S, Fuchs H, Paton V, Bajmonde A, Fleming T, Eiermann W, Wolter J, Pegram M, Baselga J, Norton LN. N Engl J Med. 2001;344:783–792. doi: 10.1056/NEJM200103153441101. [DOI] [PubMed] [Google Scholar]
- 18.Leonard DS, Hill ADK, Kelly L, Dijkstra B, McDermott E, O’Higgins NJ. British J Surgery. 2002;89:262–271. doi: 10.1046/j.0007-1323.2001.02022.x. [DOI] [PubMed] [Google Scholar]
- 19.Molina MA, Codony-Servat J, Albanell J, Rojo F, Arribas J, Baselga J. Cancer Res. 2001;61:4744–4749. [PubMed] [Google Scholar]
- 20.Kamath S, Buolamwini JK. J Med Chem. 2003;46:4657–4668. doi: 10.1021/jm030065n. [DOI] [PubMed] [Google Scholar]
- 21.Rabindran SK, Discafani CM, Rosfjord EC, Baxter M, Floyd MB, Golas J, Hallett WA, Johnson BD, Nilakantan R, Overbeek E, Reich MF, Shen R, Shi X, Tsou HR, Wang YF, Wissner A. Cancer Res. 2004;64:3958–3965. doi: 10.1158/0008-5472.CAN-03-2868. [DOI] [PubMed] [Google Scholar]
- 22.Fink BE, Vite GD, Mastalerz H, Kadow JF, Kim SH, Leavitt KJ, Du K, Crews D, Mitt T, Wong TW, Hunt JT, Vyas DM, Tokarski JS. Bioorg Med Chem Lett. 2005;15:4774–4779. doi: 10.1016/j.bmcl.2005.07.027. [DOI] [PubMed] [Google Scholar]
- 23.Brezov A, Chen J, Liu Q, Zhang HT, Greene MI, Murali R. J Biol Chem. 2002;277:28330–28339. doi: 10.1074/jbc.M202880200. [DOI] [PubMed] [Google Scholar]
- 24.Wissner A, Overbeek E, Reich MF, Floyd MB, Johnson BD, Mamuya N, Rosfjord EC, Discafani C, Davis R, Shi X, Rabindran SK, Gruber BC, Ye F, Hallet WA, Nilakantan R, Shen R, Wang YF, Greenberger LM, Tsou HR. J Med Chem. 2003;46:49–63. doi: 10.1021/jm020241c. [DOI] [PubMed] [Google Scholar]
- 25.Moulder SL, Yakes FM, Muthuswamy SK, Bianco R, Simpson JF, Arteaga CL. Cancer Res. 2001;61:8887–8895. [PubMed] [Google Scholar]
- 26.Dakappagari NK, Lunte KD, Rawale S, Steele JT, Allen SD, Phillips G, Reilly RT, Kaumaya TP. J Biol Chem. 2005;280:54–63. doi: 10.1074/jbc.M411020200. [DOI] [PubMed] [Google Scholar]
- 27.Andrianov AM. J Biomol Struct Dyn. 2009;26:445–454. doi: 10.1080/07391102.2009.10507259. [DOI] [PubMed] [Google Scholar]
- 28.Hage-Melim LIDS, Da Silva CHTDP, Semighini EP, Taft CA, Sampaio SV. J Biomol Struct Dyn. 2009;27:27–36. doi: 10.1080/07391102.2009.10507293. [DOI] [PubMed] [Google Scholar]
- 29.Andrianov AM. J Biomol Struct Dyn. 2008;26:49–56. doi: 10.1080/07391102.2008.10507222. [DOI] [PubMed] [Google Scholar]
- 30.Sujatha K, Mahalakshmi A, Solaiman DKY, Shenbagarathai R. J Biomol Struct Dyn. 2009;26:771–779. doi: 10.1080/07391102.2009.10507289. [DOI] [PubMed] [Google Scholar]
- 31.Subramaniam S, Mohmmed A, Gupta D. J Biomol Struct Dyn. 2009;26:473–479. doi: 10.1080/07391102.2009.10507262. [DOI] [PubMed] [Google Scholar]
- 32.Mahalakshmi A, Sujatha K, Shenbagarathai R. J Biomol Struct Dyn. 2008;26:375–386. doi: 10.1080/07391102.2008.10507252. [DOI] [PubMed] [Google Scholar]
- 33.Fang PS, Zhao JH, Liu HL, Liu KT, Chen JT, Lin HY, Huang CH, Fang HW. J Biomol Struct Dyn. 2009;26:549–559. doi: 10.1080/07391102.2009.10507270. [DOI] [PubMed] [Google Scholar]
- 34.Zhao JH, Liu HL, Liu YF, Lin HY, Fang HW, Ho Y, Tsai WB. J Biomol Struct Dyn. 2009;26:481–490. doi: 10.1080/07391102.2009.10507263. [DOI] [PubMed] [Google Scholar]
- 35.Sonavane UB, Ramadugu SK, Joshi RR. J Biomol Struct Dyn. 2008;26:203–214. doi: 10.1080/07391102.2008.10507236. [DOI] [PubMed] [Google Scholar]
- 36.Bairagya HR, Mukhopadhyay BP, Sekar K. J Biomol Struct Dyn. 2009;27:149–158. doi: 10.1080/07391102.2009.10507304. [DOI] [PubMed] [Google Scholar]
- 37.Chang LK, Zhao JH, Liu HL, Liu KT, Chen JT, Tsai WB, Ho Y. J Biomol Struct Dyn. 2009;26:731–740. doi: 10.1080/07391102.2009.10507285. [DOI] [PubMed] [Google Scholar]
- 38.Timofeyeva NA, Koval VV, Knorre DG, Zharkov DO, Saparbaev MK, Ishchenko AA, Fedorova OS. J Biomol Struct Dyn. 2009;26:637–652. doi: 10.1080/07391102.2009.10507278. [DOI] [PubMed] [Google Scholar]
- 39.Bairagya HR, Mukhopadhyay BP, Sekar K. J Biomol Struct Dyn. 2009;26:497–508. doi: 10.1080/07391102.2009.10507265. [DOI] [PubMed] [Google Scholar]
- 40.Sunilkumar PN, Nair DG, Sadasivan C, Haridas M. J Biomol Struct Dyn. 2009;26:491–496. doi: 10.1080/07391102.2009.10507264. [DOI] [PubMed] [Google Scholar]
- 41.Huang HJ, Lee KJ, Yu HW, Chen CY, Hsu CH, Chen HY, Tsai FJ, Chen CYC. J Biomol Struct Dyn. 2010;28:23–37. doi: 10.1080/07391102.2010.10507341. [DOI] [PubMed] [Google Scholar]
- 42.Chen CY. J Biomol Struct Dyn. 2009;27:271–282. doi: 10.1080/07391102.2009.10507315. [DOI] [PubMed] [Google Scholar]
- 43.Chen CY, Chang YH, Bau DT, Huang HJ, Tsai FJ, Tsai CH. J Biomol Struct Dyn. 2009;27:171–178. doi: 10.1080/07391102.2009.10507307. [DOI] [PubMed] [Google Scholar]
- 44.Chen CYC, Chen YF, Wu CH, Tsai HY. J Biomol Struct Dyn. 2008;26:57–64. doi: 10.1080/07391102.2008.10507223. [DOI] [PubMed] [Google Scholar]
- 45.Satyanarayanajois SD, Villalba S, Liu J, Mei Lin G. Chem Biol Drug Design. 2009;74:246–257. doi: 10.1111/j.1747-0285.2009.00855.x. [DOI] [PMC free article] [PubMed] [Google Scholar]
- 46.Mosmann T. J Immunol Methods. 1983;5:55–63. doi: 10.1016/0022-1759(83)90303-4. [DOI] [PubMed] [Google Scholar]
- 47.Alley MC, Scudiero DA, Monks A, Huresy ML, Czerwinski MJ, Fine DL, Abbott BJ, Mayo JG, Shoemaker RH, Boyd MR. Cancer Res. 1998;48:589–601. [PubMed] [Google Scholar]
- 48.Riss T, Moravec R, Niles A. Cell Notes. 2005;13:16–21. [Google Scholar]
- 49.Bax A, Davis DG. J Magn Reson. 1985;65:355–360. [Google Scholar]
- 50.Bax A, Davis DG. J Magn Reson. 1985;63:207–213. [Google Scholar]
- 51.Kumar A, Wagner G, Ernst RR, Wuthrich K. J Am Chem Soc. 1981;103:3654–3658. [Google Scholar]
- 52.Rance M, Sorensen OW, Bodenhause G, Wagner G, Ernst RR, Wüthrich K. Biochem Biophys Res Commun. 1983;117:479–485. doi: 10.1016/0006-291x(83)91225-1. [DOI] [PubMed] [Google Scholar]
- 53.Wuthrich K. NMR of proteins and nucleic acids. New York: John Wiley & Sons; 1986. [Google Scholar]
- 54.Delaglio F, Grzesiek S, Vuister G, Zhu G, Pfeifer J, Bax A. J Biomol NMR. 1995;6:277–293. doi: 10.1007/BF00197809. [DOI] [PubMed] [Google Scholar]
- 55.Goddard TD, Kneller DG. SPARKY3. University of California; San Francisco: http://www.cgl.ucsf.edu/home/sparky/ [Google Scholar]
- 56.Sutcliffe MJ. Structure determination from NMR data II. Computational approaches. In: Roberts GCK, editor. NMR of Macromolecules: A Practical Approach. Oxford University Press; New York: 1993. pp. 359–90. [Google Scholar]
- 57.Morris GM, Goodsell DS, Halliday RS, Huey R, Hart WE, Belew RK, Olson AJ. J Comput Chem. 1998;19:1639–1662. [Google Scholar]
- 58.Huey R, Morris GA, Olson AJ, Goodsell DS. J Compu Chem. 2006;28:1145–1152. doi: 10.1002/jcc.20634. [DOI] [PubMed] [Google Scholar]
- 59.InsightII. Obtained from Accelrys, Inc. Accelrys, Inc; Sandiego, CA: InsightII is a commercial, licensed molecular modeling software. http://www.accelrys.com/products/insight/ [Google Scholar]
- 60.Brenke R, Kozakov D, Chuang G–Y, Beglov D, Mattos C, Vajda S. Bioinformatics. 2009;25:621–627. doi: 10.1093/bioinformatics/btp036. [DOI] [PMC free article] [PubMed] [Google Scholar]
- 61.Chen R, Li L, Weng Z. Proteins. 2003;52:80–87. doi: 10.1002/prot.10389. [DOI] [PubMed] [Google Scholar]
- 62.Pierce B, Weng Z. Proteins. 2007;67:1078–1086. doi: 10.1002/prot.21373. [DOI] [PubMed] [Google Scholar]
- 63.Ogiso H, Ishitani R, Nureki O, Fukai S, Yamanaka M, Kim JH, Saito K, Sakamoto A, Inoue M, Shirouzu M, Yokoyama S. Cell. 2002;110:775–787. doi: 10.1016/s0092-8674(02)00963-7. [DOI] [PubMed] [Google Scholar]
- 64.Ferguson KM, Berger MB, Mendrola JM, Cho HS, Leahy DJ, Lemmon MA. Mol Cell. 2003;11:507–517. doi: 10.1016/s1097-2765(03)00047-9. [DOI] [PubMed] [Google Scholar]
- 65.Alvarado D, Klein DE, Lemmon MA. Nature. 2009;461:287–291. doi: 10.1038/nature08297. [DOI] [PMC free article] [PubMed] [Google Scholar]
- 66.Davis IW, Leaver-Fay A, Chen VB, Block JN, Kapral GJ, Wang X, Murray LW, Arendall WB, III, Snoeyink J, Richardson JS, Richardson DC. Nucleic Acids Res. 2007;35:W375–W383. doi: 10.1093/nar/gkm216. [DOI] [PMC free article] [PubMed] [Google Scholar]
- 67.Crouch SPM. J Immunol Methods. 1993;160:81–88. doi: 10.1016/0022-1759(93)90011-u. [DOI] [PubMed] [Google Scholar]
- 68.Blanco FJ, Jimenez MA, Herranz J, Rico M, Santoro J, Nieto JL. J Am Chem Soc. 1993;115:5887–88. [Google Scholar]
- 69.Fasman GD. Circular Dichroism and the Conformational Analysis of Biomolecules. Plenum Press; New York: 1996. [Google Scholar]
- 70.Yoshida N, Yamaguchi H, Iwao T, Higashi M. J Chem Soc Perkin Trans. 1999;2:379–386. [Google Scholar]
- 71.Yana D, Shimizu T, Hamasaki K, Mihara H, Ueno A. Macromol Rapid Commun. 2002;23:11–15. [Google Scholar]
- 72.Bisson WH, Zhang Z, Welsh K, Huang JW, Ryan J, Reed JC, Pellecchia M. Chem Biol Drug Des. 2008;72:331–336. doi: 10.1111/j.1747-0285.2008.00719.x. [DOI] [PubMed] [Google Scholar]
- 73.Couvineau A, Ceraudo E, Tan YV, Laburthe M. Neuropeptides. 2010;44:127–32. doi: 10.1016/j.npep.2009.11.008. [DOI] [PubMed] [Google Scholar]
- 74.Landgraf R. Breast Cancer Res. 2007;9:202–209. doi: 10.1186/bcr1633. [DOI] [PMC free article] [PubMed] [Google Scholar]
- 75.Saxon ML, Lee DC. J Biol Chem. 1999;274:28356–28362. doi: 10.1074/jbc.274.40.28356. [DOI] [PubMed] [Google Scholar]
- 76.Kumagai T, Katsumata M, Hasegawa A, Furuuchi K, Funakoshi T, Kawase I, Greene MI. Proc Natl Acad Sci. 2003;100:9220–9225. doi: 10.1073/pnas.1633546100. [DOI] [PMC free article] [PubMed] [Google Scholar]
- 77.Alvarado D, Klein ED, Lemmon MA. Nature. 2009;461:287–291. doi: 10.1038/nature08297. [DOI] [PMC free article] [PubMed] [Google Scholar]
- 78.Mi LZ, Grey MJ, Nishida N, Walz T, Lu C, Springer TA. Biochemistry. 2008;47:10314–10323. doi: 10.1021/bi801006s. [DOI] [PMC free article] [PubMed] [Google Scholar]
Associated Data
This section collects any data citations, data availability statements, or supplementary materials included in this article.


