Abstract
Escherichia coli ribonucleotide reductase is an α2β2 complex that catalyzes the conversion of nucleotides to deoxynucleotides and requires a diferric-tyrosyl radical (Y•) cofactor to initiate catalysis. The initiation process requires long range proton-coupled electron transfer (PCET) over 35 Å between the two subunits by a specific pathway (Y122• → W48 → Y356 within β to Y731 → Y730 → C439 within α). The rate-limiting step in nucleotide reduction is the conformational gating of the PCET process, which masks the chemistry of radical propagation. 3-Nitrotyrosine (NO2Y) has recently been incorporated site-specifically in place of Y122 in β2. The protein as isolated contained a diferric cluster, but no nitrotyrosyl radical (NO2Y•) and was inactive. In the present paper we show that incubation of apo-Y122NO2Y-β2 with Fe2+ and O2 generates a diferric-NO2Y• that has a half-life of 40 s at 25 °C. Sequential mixing experiments, in which the cofactor is assembled to 1.2 NO2Y•/β2 and then mixed with α2, CDP, and ATP, have been analyzed by stopped flow spectroscopy, rapid freeze quench EPR spectroscopy and rapid chemical quench methods. These studies have for the first time unmasked the conformational gating. They reveal that the NO2Y• is reduced to the nitrotyrosinate with biphasic kinetics (283 and 67 s-1), that dCDP is produced at 107 s-1, and that a new Y• is produced at 97 s-1. Studies with pathway mutants suggest that the new Y• is predominantly located at 356 in β2. In conjunction with the crystal structure of Y122NO2Y-β2, a mechanism for PCET uncoupling in NO2Y•-RNR is proposed.
Introduction
Ribonucleotide reductases (RNRs) catalyze the conversion of ribonucleotides to deoxyribonucleotides in all organisms. The class Ia RNRs is composed of two subunits: α, where nucleotide reduction occurs and allosteric effectors bind to control substrate specificity and overall reactivity, and β, where the essential diferric-tyrosyl radical (Y•) cofactor resides.1-3 The E. coli RNR is active as an α2β2 complex and nucleotide reduction is initiated by a long-range proton-coupled electron transfer (PCET) process in which Y122• in β2 reversibly oxidizes C439 in α to a thiyl radical through a proposed pathway (Y122 → W48 → Y356 within β to Y731 → Y730 → C439 within α, Figure 1).4,5 Our studies have shown that this process is masked by a rate-limiting conformational change (or changes) and that the conformational change is initiated by the binding of the substrate and allosteric effector to α.6-9 Conformational changes thus mask the PCET process. Recently we have incorporated 3-nitrotyrosine (NO2Y) site-specifically in place of each Y in the pathway.10 Incorporation of NO2Y in place of Y122 in β revealed an assembled diferric cluster with no 3-nitrotyrosine radical (NO2Y•). In the present paper we demonstrate that this NO2Y• can be formed, but has a t½ at 25 °C of 40 s. This t½ is sufficiently long for analysis of the catalytic properties of this mutant RNR by sequential mixing, pre-steady state experiments using stopped flow (SF) visible spectroscopy, rapid chemical quench (RCQ) methods, and rapid freeze quench (RFQ) methods in liquid isopentane. These studies together reveal uncoupling of the conformational gating and the first step in the propagation process (Figure 1), providing direct chemical insight into specific steps in the pathway.
Figure 1.
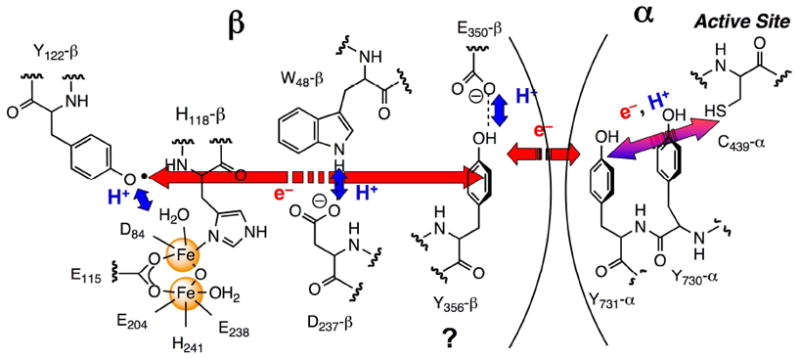
Proposed PCET pathway in E. coli class Ia RNR. Red and blue arrows indicate orthogonal transfer of the electron and proton, respectively. The purple arrow indicates co-linear movement of the electron and proton. Y356- and E350-β2 are in the flexible C-terminal tail and are disordered in all crystal structures.
Electron transfer (ET) in biological systems has been studied in detail using artificial electron donors or acceptors with small model proteins, where conformational gating has been minimized.11 The general rules governing this ubiquitous process are well understood. However, in RNR, the oxidation of C439-α is proposed to occur over a 35 Å distance4 and requires intermediates to account for the turnover numbers of 2 to 10 s-1 with different substrate/effector (S/E) pairs.5,12 Redox active amino acids are proposed to function in this capacity.4,5,12-14 Our previous studies with NO2Y-RNRs with NO2Y incorporated in place of Y356, Y730 or Y731 revealed that these mutants are unable to support dNDP formation,10 likely the result of the inability of Y• to oxidize this residue (unfavorable by 200 mV at pH 7).15 However, NO2Y at 122 is distinct from the other NO2Ys in the pathway, as it can potentially be oxidized by an Fe4+/Fe3+ species (intermediate X)16,17 involved in active cluster assembly. The proposed mechanism of Y122 oxidation is that the proton from its phenol is transferred to the hydroxyl bound to Fe1 of the cluster (Figure 1).5,17,18 Typically, 1.2 Y•/β2 are obtained by this self-assembly process in vitro.19 Whether intermediate X is a sufficiently potent oxidant to oxidize NO2Y122 was unknown. In addition, studies from the Sjöberg lab have shown that mutations in the vicinity of the diferric-Y• cofactor often result in formation of a Y• with greatly reduced stability relative to the Y• in wt-β2 (t½ of s to min vs 4 days, respectively).20 The inability to detect NO2Y122• in our initial experiments could thus be related to the inability of X to oxidize NO2Y or a short t½. NO2Y•, if generated, is a potent oxidant15 and could potentially oxidize residues within the pathway (Figure 1) and lead to dNDP production.
The present paper demonstrates that NO2Y• can be formed and that it has a sufficiently long t½ to investigate its chemical reactivity. To carry out these experiments, a general sequential mixing protocol on the ms time scale was used as described in Figure 2. In this protocol, Y122NO2Y-β2 is preloaded under anaerobic conditions with Fe2+ and then is mixed with CDP and O2 for a time period to maximize the amount of NO2Y• (1 s). This solution is then mixed with a third solution containing α and allosteric effector ATP and the reaction is monitored from 10 to 200 ms by three methods: SF visible absorption spectroscopy, RCQ followed by radioactive quantitation of dCDP formation, and RFQ in liquid isopentane followed by EPR analysis. Analysis of the kinetic data reveal that NO2Y• is reduced to nitrophenolate with rate constants of 283 and 67 s-1, that dCDP is generated with an apparent rate constant of 107 s-1 and that a new radical, likely located at residue 356 in β2, is generated with an apparent rate constant of 97 s-1. The results suggest for the first time that some or all of the conformational gating has been removed by the uncoupling of the proton and electron transfer in the reduction of the NO2Y•. The X-ray crystal structure of Y122NO2Y-β2, refined to 2.2 Å, is presented and used to propose a mechanism(s) for PCET uncoupling at Y122. These studies have resulted in the model shown in Figure 3 that will be presented in detail.
Figure 2.
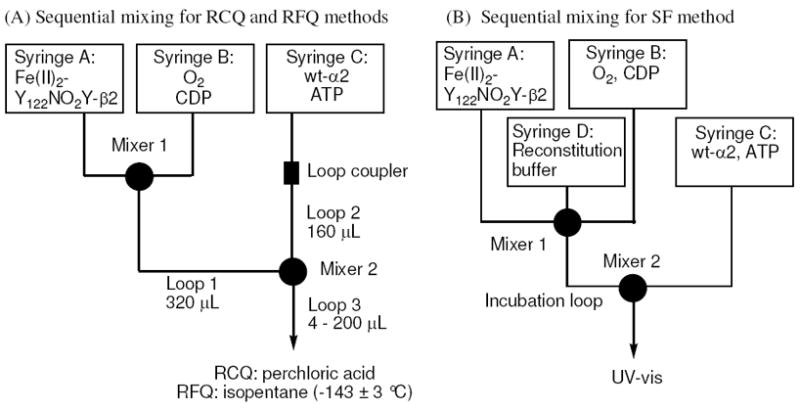
Schematic representation of the sequential mixing set-ups for (A) RCQ and RFQ experiments and (B) SF experiments. Details are described in Methods.
Figure 3.
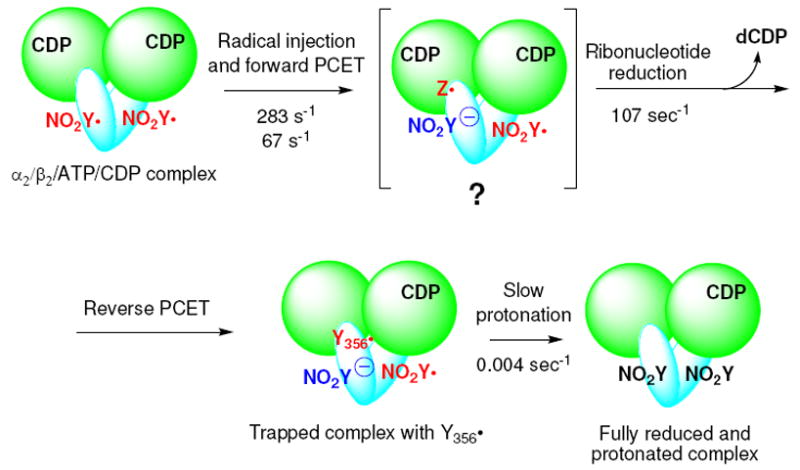
Model for the reaction of Y122NO2Y-β2 with α2, ATP and CDP. Green circles represent α, and blue ovals, β. The ATP allosteric effector is omitted from α for clarity. Any intermediate(s) between the forward PCET and ribonucleotide reduction is (are) designated as Z•.
Materials and Methods
Luria Bertani (LB) medium, BactoAgar, 100 mm Petri dish plates were obtained from Becton-Dickinson. NO2Y, M9 salts, ampicillin (Amp), L-arabinose (L-Ara), chloramphenicol (Cm), all amino acids, ATP, cytidine 5’-diphosphate (CDP), NADPH, ethylenediamine tetraacetic acid (EDTA), Bradford Reagent, Sephadex G-25, phenylmethanesulfonyl fluoride (PMSF) and streptomycin sulfate were purchased from Sigma-Aldrich. Isopropyl-β-d-thiogalactopyranoside (IPTG) and dithiothreitol (DTT) were from Promega. E. coli TOP10 competent cells were from Invitrogen. Calf-intestine alkaline phosphatase (CIAP, 20 U/μL) was from Roche. [5-3H]CDP was purchased from ViTrax (Placentia, CA). Calibrated EPR tubes (3.2 ± 0.01 and 2.8 ± 0.01 mm inner diameter for RFQ and hand-quench experiments, respectively) were from Wilmad labglass (Vineland, NJ). The purification of E. coli thioredoxin21 (TR, 40 units/mg), E. coli thioredoxin reductase22 (TRR, 1400 units/mg), wt-β223 (6200-7500 nmol/min/mg, 1.1-1.2 radicals per β2), and wt-α224 (2500-3000 nmol/min/mg) have previously been described. The concentration of α2 was determined using ε280nm = 189 mM-1 cm-1.25 Wt and all mutant α2s were pre-reduced by DTT and treated with hydroxyurea (HU) to reduce any Y• in endogenous β that copurifies, following the reported procedure7 and exchanged to assay buffer (50 mM HEPES, 15 mM MgSO4, 1 mM EDTA, pH 7.6). The concentration of β2 and Y122NO2Y-β2 was determined using ε280nm = 131 mM-1 cm-1.25 The concentration of apo-Y122NO2Y-β2 was determined using ε280nm = 120 mM-1 cm-1.26 The amino acid enriched glycerol minimal media leucine (GMML) and heavy metal stock solution (1000 x) have previously been described.27,28 UV-vis absorption spectra were determined using the Cary 3 UV-vis Spectrophotometer (Varian, Walnut Creek, CA) and the Ultramark EX Microplate Imaging System (BioRad) was used to monitor fractions from column chromatography: A280nm for protein and A340nm for the diferric cluster and NO2Y phenol. RFQ and RCQ experiments were carried out using an Update Instruments 1019 Syringe Ram Unit and a Model 715 Syringe Ram Controller. For RFQ experiments the samples were sprayed into a funnel containing liquid isopentane at -143 ± 3 °C whose temperature was maintained by its placement in a liquid isopentane bath with a liquid N2 jacket. The temperature was monitored using a Fluke 52 Dual Input Thermometer with an Anritsu Cu Thermocouple probe. Non-linear least square fitting of kinetic data was carried out using KaleidaGraph software (Synergy Software, Reading, PA). EPR spin quantitation was carried out using Cu(II)SO4 as a standard.29
Expression and purification of Y122NO2Y-β2
A plasmid coding for un-tagged β with a TAG codon at amino acid position 122, pBAD-nrdB(Y122Z), was prepared from pBAD-nrdB30 using previously reported primers and PCR conditions.10 Y122NO2Y-β2 was expressed in E. coli TOP10 cells harboring pEVOL-NO2Y10,31 and pBAD-nrdB(Y122Z) grown in the amino acid enriched GMML medium27 and was purified using DEAE and Q-sepharose column chromatography as previously described.10 Typically 20 mg of NO2Y• reduced (met)-Y122NO2Y-β2 (3.0 ± 0.2 Fe/β2, 2.0 ± 0.1 NO2Y/β2, <0.1 radicals/β2) was isolated from one g of cell paste. Apo-Y122NO2Y-β2 (< 0.1 Fe/β2) was prepared using hydroxyquinoline as a chelator in the presence of 1 M imidazole.26 The iron content was determined by the ferrozine assay.32
Preparation of Y122[β-2H2]NO2Y-β2
Y122[β-2H2]NO2Y-β2 was expressed and purified as described above using [β-2H2]NO2Y in place of NO2Y. [β-2H2]NO2Y was prepared by nitration of [β-2H2]Y (98 atom% 2H)33. The deuterium incorporation was >96% based on 1H NMR analysis. 1H NMR (300 MHz, D2O, 25 °C) δ = 4.24 (s, 1H, Cα-H), 7.13 (d, 1H, arom. C-H, 8.7 Hz), 7.52 (dd, 1H, arom. C-H, 2.2 Hz, 8.7 Hz), 8.01 (d, 1H, arom. C-H, 2.2 Hz). 13C NMR (75 MHz, D2O, 25 °C) δ = 34.7 (s, Cβ), 54.2 (s, Cα), 120.4 (d, arom. C2, 2.1 Hz), 126.1 (d, arom. C1, 1.6 Hz), 126.8 (d, arom. C4, 2.4 Hz), 134.2 (d, arom. C3, 15.2 Hz), 138.2 (s, arom. C6), 153.1 (d, arom. C5, 1.15 Hz), 172.1 (s, COOH). UV-vis in 50 mM MES pH 5.0: λmax 360 nm (ε = 3000 ± 100 M-1 cm-1); in 50 mM TAPS pH 9.0: λmax 424 nm (ε = 4500 ± 100 M-1 cm-1).
Expression and Purification of Y122NO2Y/Y356F-β2
The Y356F mutation was introduced by PCR using pBAD-nrdB(Y122Z) as a template and forward primer Y356F-f (5′-GTG GAA GTC AGT TCT TTT CTG GTC GGG CAG ATT GAC-3′) and reverse primer Y356F-r (5′-GTC AAT CTG CCC GAC CAG AAA AGA ACT GAC TTC CAC-3′). PCR was performed using PfuUltraII polymerase (Stratagene) for 18 cycles following the manufacturer’s protocol with an annealing temperature of 55 °C. The methylated template was then digested by DpnI. The mutation was confirmed by sequencing at the MIT Biopolymers Laboratory. The expression and purification of Y122NO2Y/Y356F-β2 were performed as described for Y122NO2Y-β2. Typically, 20 mg protein was isolated per g cell paste.
In vitro reconstitution of NO2Y•-diferric cluster and characterization by EPR spectroscopy
Apo-Y122NO2Y-β2 (100 μM) in 0.5 mL of 50 mM HEPES (pH 7.6) was degassed on a Schlenk line by 15 cycles of 10 s evacuation followed by 2 min Ar gas refill. The sample was then brought into a glovebox and incubated with 5 eq. FeII(NH4)2(SO4)2 at 4 °C for 5 to 10 min. Fe(II)2-Y122NO2Y-β2 (0.3 mL) was transferred to a glass vial sealed with a septum, taken out of the glovebox, and quickly mixed with an equal volume of O2-saturated (1.4 mM) 50 mM HEPES (pH 7.6) to a final concentration of 50 μM Fe(II)2-Y122NO2Y-β2 (5 Fe2+/β2) and 0.7 mM O2. The mixture was incubated for 20 s at 25 °C before quenching in liquid N2. The reconstitution of Y122[β-2H2]NO2Y-β2 was carried out in an identical fashion. EPR spectra were recorded at 77 K in the Department of Chemistry Instrumentation Facility on a Bruker ESP-300 X-band spectrometer equipped with a quartz finger dewar filled with liquid N2. EPR parameters were: microwave frequency = 9.34 GHz, power = 30 μW, modulation amplitude = 1.5 G, modulation frequency = 100 kHz, time constant = 5.12 ms, scan time = 41.9 s. Spectral simulation and fitting were performed using EasySpin.34 The g-values, hyperfine coupling constants and the Euler angles for Y122• in wt-β2 were used as the starting parameters and least square fitting was performed by varying the aforementioned parameters and the line width. For the microwave power saturation experiment, the EPR spectra were recorded as a function of microwave power and the integrated intensity of each signal was plotted against the square root of power. The resulting data were fit to Eq.1,35,36
| Eq. 1 |
where K is a sample and instrument dependent scaling factor, P is the microwave power, b is indicative of homogeneous (b = 3) or inhomogeneous (b = 1) spectral broadening and P½ is the microwave power at half saturation of the EPR signal.
Analysis of NO2Y• formation and decay by RFQ EPR
Fe(II)2-Y122NO2Y-β2 (60 μM, 5 Fe2+/β2) in anaerobic 50 mM HEPES (pH 7.6) in one syringe, prepared as described above, was mixed with O2-saturated 50 mM HEPES (pH 7.6) in the second syringe in an 1:1 ratio at 25 °C and aged for a pre-determined time period (0.5 – 50 s) in the reaction loop. The mixture (400 μL) was then sprayed, by actuation of the ram drive at a velocity of 1.25 cm/s,37 into liquid isopentane (-143 ± 3 °C) in a glass funnel attached to an EPR tube. The frozen sample was then packed into the EPR tube using a stainless steel packer and stored in liquid N2 until the EPR spectrum was acquired. A packing factor of 0.64 ± 0.02 was reproducibly obtained with wt-β2 samples. The quenching dead time of the instrument was determined to be 6.0 ± 0.3 ms by the myoglobin/N3 reaction.37,38
Determination of the vis spectrum of the NO2Y122• in Y122NO2Y-β2 using SF UV-vis spectroscopy and spectral deconvolution
SF kinetics was carried out on an Applied Photophysics DX 17MV instrument equipped with the Pro-Data upgrade using PMT detection. The temperature was maintained at 25 ± 1°C with a Lauda RE106 circulating water bath. The circulating water contained ~10 mM sodium dithionite to minimize O2 diffusion into the SF lines. Prior to the experiment, the SF lines were washed with 10 mL of a 500 mM sodium dithionite solution, 30 mL of anaerobic water and 10 mL of anaerobic 50 mM HEPES (pH 7.6). The connections of the SF syringes to the instrument were purged with N2 throughout the experiments. Fe(II)2-Y122NO2Y-β2 (60 μM, 5 FeII/β2) in anaerobic 50 mM HEPES (pH 7.6) in one syringe was mixed with O2-saturated 50 mM HEPES (pH 7.6) in a 1:1 ratio. The reaction was monitored from 320 – 550 nm in 10 nm intervals, 4 traces were averaged at each wavelength, and the spectra were reconstructed. For the following analysis to deconvolute the vis spectrum of NO2Y•, the 0.44 s time point, at which the amount of NO2Y• is maximized, was chosen. From this spectrum, 2.0 equivalent (eq.) of diferric cluster16 and 0.8 eq. of NO2Y phenol10 were subtracted. The amount of diferric cluster was based on the Fe content (4.0/β2) in met-Y122NO2Y-β2 isolated after in vitro reconstitution. The amount of NO2Y phenol was determined by subtracting the amount of NO2Y• (1.2/β2) determined by RFQ-EPR spectroscopy from the amount of total NO2Y (2.0/β2), assuming that the amount of NO2Y phenolate was negligible (< 0.03/β2) based on the absorption at 450 nm10. The resulting spectrum (Figure 4) is that of the NO2Y•.
Figure 4.
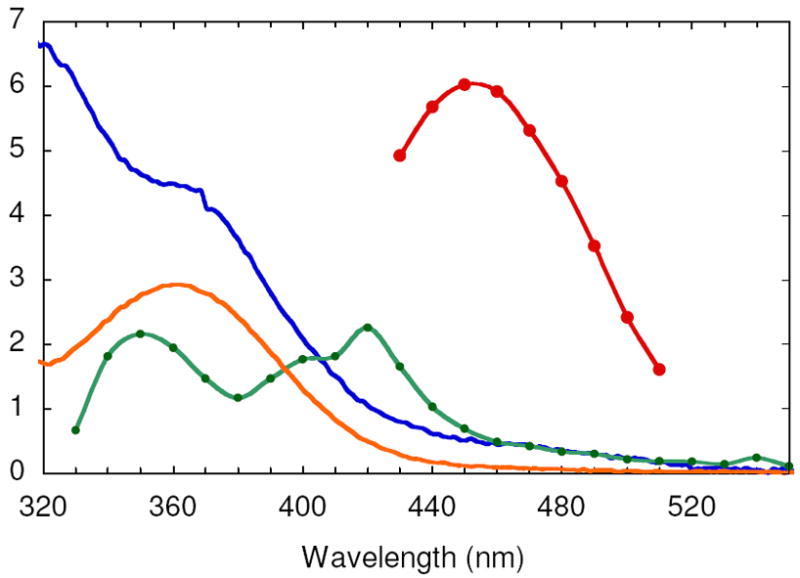
Vis absorption spectra of the species contributing to the SF UV-vis composite spectrum generated from the reaction between FeII-Y122NO2Y-β2 and O2 and the reaction of Y122NO2Y•-β2 with α2, ATP and CDP: diferric cluster (blue), NO2Y122 phenol (orange), NO2Y122 - (red), and NO2Y• (green). See Methods for the details of the spectral reconstructions.
Activity assay of Y122NO2Y-β2 with wt-α2, ATP, CDP ± TR/TRR/NADPH
All reactions were carried out at 25 °C. Fe(II)2-Y122NO2Y-β2 (100 μM, 5 FeII/β2) in anaerobic 50 mM HEPES (pH 7.6, 90 μL) was mixed with O2-saturated 50 mM HEPES (pH 7.6) containing [5-3H]CDP (3000 – 5000 cpm/nmol, 5 mM, 90 μL) and incubated for 7 ± 2 sec to generate 0.95 ± 0.05 NO2Y•/β2. This solution (180 μL) was then mixed with wt-α2 and ATP in 1.7x assay buffer (270 μL) to give a final volume of 450 μL containing 20 μM Y122NO2Y-β2 and α2, 3 mM ATP and 1 mM [5-3H]CDP. Aliquots (80 μL) were removed from 10 to 40 s and the reaction quenched by the addition of 2% perchloric acid (50 μL). The reactions were subsequently neutralized with 40 μL of 0.5 M KOH. Each sample was then incubated at -20 °C for 6-12 h to ensure complete precipitation of potassium perchlorate. The protein was then removed by centrifugation for 3 min using a tabletop centrifuge. Each supernatant was transferred to a 1.5-mL microfuge tube, to which 7 U of CIAP, 120 nmol of carrier deoxycytidine (dC), 0.15 mM EDTA, in 75 mM Tris buffer (pH 8.5) were added. The amount of dC was analyzed by the method of Steeper and Steuart.39 The experiment was also carried out in the presence of TR (30 μM)/TRR (0.5 μM)/NADPH (1 mM).
Kinetics of dCDP formation monitored by the RCQ method
Sequential mixing RCQ and RFQ experiments were carried out by the following general procedure using three syringes and the Update Instrument 1019 syringe ram unit following manufacturer’s protocol (Figure 2A). Ram drive velocities of 1.25 cm/s and 1.0 cm/s were used for the first and the second pushes, respectively. The ram drive pushes all three syringes simultaneously. Loops 1, 2, and 3 were initially filled with 50 mM HEPES (pH 7.6). All reactions were carried out at 25 °C. Fe(II)2-Y122NO2Y-β2 (60 μM, 5 FeII/β2) in syringe A was first mixed with an equal volume of an O2-saturated 50 mM HEPES (pH 7.6) containing [5-3H]CDP (3000 – 5000 cpm/nmol, 3 mM) from syringe B to replace 95% of loop 1 content (300 μL, Figure 2A) and aged for 1 s to allow maximum production of the NO2Y• (1.2 ± 0.05 eq./β2). The push also replaced 95% of loop 2 content with 150 μL of wt-α2 (60 μM) and ATP (9 mM) in 3x assay buffer from syringe C. The contents of loop 1 (300 μL) and loop 2 (150 μL) were then mixed by the second push and aged for 0.01 to 0.20 s by traversing loop 3. The final reaction mixture contained 20 μM Y122NO2Y-β2 and α2, 3 mM ATP and 1 mM [5-3H]CDP, in assay buffer. This mixture (450 μL) was then sprayed into 350 μL of cold 2% perchloric acid. After each run, the mixture was neutralized with 300 μL of 0.5 M KOH and stored at -20 °C for 6 - 12 h. The workup was identical to that described in the previous section.39 The rate constants were obtained by a non-linear least square fit of the dCDP formation data to Eq. 2,
| Eq. 2 |
where t is time (s); y is dCDP concentration at t; A1 and A2 are the amplitudes; and k1 and k2 are the rate constants for each kinetic phase. y and t are experimentally determined, and A1, A2, k1, and k2 are obtained from the fitting.
Kinetics of phenolate formation during the reaction of Y122NO2Y-β2 with wt-α2, ATP, and CDP monitored by SF-UV-vis spectroscopy
All reactions were carried out at 25 °C. The Applied Photophysics instrument was reconfigured for sequential mixing following the manufacturer’s protocol (Figure 2B). The instrument allows movement of syringes A and B independently from syringes C and D. Fe(II)2-Y122NO2Y-β2 (80 μM, 5 Fe2+/β2) in anaerobic 50 mM HEPES (pH 7.6) in syringe A was mixed with an equal volume of O2-saturated 50 mM HEPES (pH 7.6) containing CDP (4 mM) in syringe B and aged for 1 s to maximize NO2Y• formation in the incubation loop. The resulting solution was then mixed with an equal volume of wt-α2 (40 μM) and ATP (6 mM) in 2x assay buffer using syringe C and D. The final reaction mixture contained 20 μM Y122NO2Y-β2 and α2, 3 mM ATP and 1 mM CDP, in assay buffer. The reaction was monitored at 460 nm and 15 traces were averaged. For the point-by-point reconstruction of the vis spectrum, the reaction was monitored from 390 to 510 nm in 10 nm intervals and 2-5 traces were averaged at each wavelength. The rate constants were obtained by a non-linear least square fit of the SF trace at A460 nm to Eq. 3,
| Eq. 3 |
where the parameters are described above.
Determination of the vis spectrum of the NO2Y122 phenolate (NO2Y122 - ) in Y122NO2Y-β2 using SF UV-vis spectroscopy and spectral deconvolution
The NO2Y122- spectrum was obtained from the spectra generated by the SF method during the reaction of Y122NO2Y-β2 with wt-α2, ATP, and CDP. The spectrum from the 2 ms time point was subtracted from that at 120 ms. The region between 430 – 510 nm where the spectrum overlaps minimally with other species was determined. The extinction coefficient was calculated by assuming that the amount of NO2Y• reduced in this period of time corresponds to the amount of phenolate and the amount of NO2Y• reduced was determined by RFQ-EPR described subsequently.
Kinetics of NO2Y• reduction and formation of a new radical monitored by RFQ-EPR spectroscopy
Sequential mixing experiments were carried out as described above for RCQ except that the quenching occurred by spraying the sample into isopentane (Figure 2B). Fe(II)2-Y122NO2Y-β2 or Fe(II)2-Y122[β-2H2]NO2Y-β2 (90 μM, 5 Fe2+/β2) in anaerobic 50 mM HEPES (pH 7.6) was mixed with an equal volume of O2-saturated 50 mM HEPES (pH 7.6) containing CDP (3 mM) and aged for 1 s at 25 °C. This solution (300 μL) was then mixed with 150 μL of a solution containing wt-α2 (90 μM) and ATP (9 mM) in 3x assay buffer and aged for 0.01 – 0.20 s. The final reaction mixture contained 30 μM Y122NO2Y-β2 or Y122[β-2H2]NO2Y-β2, 30 μM α2, 3 mM ATP and 1 mM CDP, in assay buffer. The reaction was quenched and packed into an EPR tube. The packing factor of wt-α2β2 complex was determined to be 0.52 ± 0.02. EPR spectra were collected as described above for NO2Y•.
The EPR spectra of the new radical and the NO2Y• share extensive overlap. The low field region of the composite spectrum was initially used to estimate the amount of the new radical. To actually obtain the spectrum of the new radical, however, experiments with both Y122NO2Y- and with Y122[β-2H2]NO2Y-β2 were carried out. The assumption was made that both proteins give rise to the same radical species in the same amounts. A spectrum of NO2Y• and [β-2H2]NO2Y• was then independently subtracted from the composite spectrum. The amount subtracted was continually readjusted to minimize the differences between the spectrum of the new species obtained in each experiment. The rate constants for NO2Y• loss and formation of the new radical were analyzed by fitting to Eq. 2 as described above.
Reaction of Y122NO2Y-β2 or Y122NO2Y/Y356F-β2 with ATP, CDP, and wt-α2 or C439S-, Y730F-, or Y731F-α2 monitored by EPR spectroscopy
Fe(II)2-Y122NO2Y-β2 or Y122NO2Y/Y356F-β2 (120 μM, 5 FeII/β2) in anaerobic 50 mM HEPES (pH 7.6, 75 μL) was mixed by hand at 4 °C with an equal volume (75 μL) of O2-saturated (2 mM) 50 mM HEPES (pH 7.6) containing CDP (4 mM) and incubated for 10 s. This solution (150 μL, 0.8 NO2Y•/β2) was then mixed with an equal volume (150 μL) of wt or mutant-α2 (60 μM) and ATP (6 mM) in 2x assay buffer and incubated for 20 s at 25 °C. The final reaction mixture contained 30 μM Y122NO2Y- or Y122NO2Y/Y356F-β2, 30 μM wt- or mutant-α2, 3 mM ATP and 1 mM CDP in assay buffer. The solution was transferred to an EPR tube and frozen in liquid N2. EPR was recorded at 77 K as described above. The subtractions were carried out with the spectrum of NO2Y• and [β-2H] NO2Y• as described above for the RFQ experiments.
Crystallization of Y122NO2Y-β2, data collection, and refinement
Y122NO2Y-β2 was crystallized under conditions similar to those reported for wt- and Y122F-β2.40 Crystals were grown using the hanging drop vapor diffusion method against 90-95 % saturated NaCl in Tris buffer pH 7.9. Each drop consisted of Y122NO2Y-β2 (10 mg/mL) in 50 mM Tris, pH 7.9, and 5% glycerol. The crystals grew within 3 – 4 weeks, and were flash-frozen in liquid N2 using 30% glycerol in 60 – 70% NaCl as cryoprotectant.
Data were collected at 100 K at the European Synchrotron Radiation Facility station ID29 (Grenoble, France). The crystals were of the space group P61 with cell axes of a = b = 137.1 Å and c = 109.0 Å containing one β2 dimer per asymmetric unit. Data were collected to 2.2 Å resolution with 100% completion. Data processing and scaling were performed using MOSFLM/SCALA.41 The structure was solved with rigid body refinement in Refmac (CCP4 package)42 using the wt-β2 structure (PDB-ID: 1AV8)40 with all waters and metals removed. Model building was done in the program O.43 The structure was refined to Rfact = 19 % (Rfree = 22%).
Results
Formation of a Diferric-NO2Y• cluster in Y122NO2Y-β2 and its characterization
We have previously reported that Y122NO2Y-β2 has 2.9 ± 0.2 Fe/β2 and no observable radical by EPR spectroscopy.10 Thus, if NO2Y• is generated, it must be reduced during protein purification. In a preliminary experiment therefore, apo-Y122NO2Y-β2 was prepared and the cluster was assembled at 25 °C in vitro as previously described for wt-β2.19 The sample was frozen after 20 s incubation and analyzed by EPR spectroscopy. The results shown in Figure 5A reveal a doublet feature similar to that observed forY122• in wt-β2, but with a spectral width of 64 G rather than 70 G (Figure 5A) and spin quantitation of 0.8 ± 0.05 per β2. If the new radical is associated with oxidation of NO2Y, a study of its relaxation properties will be informative as it is located 5.0 Å from Fe1 in the diferric cluster. The power at half-saturation (P½) was measured as 11.4 ± 0.5 mW at 77 K (Figure S1). This value is similar to that measured for Y122• in wt-β2 (28 ± 4 mW)7. These values may be compard to the P½ for the 3-aminotyrosyl radical at 730-α2 (NH2Y730•, 0.42 ± 0.08 mW7) and 3,4-dihydroxyphenylalanine radical at 356-β2 (DOPA356•, 0.8 ± 0.16 mW44), sites further removed from the diferric cluster. This analysis suggests that the new radical is close to the diferric cluster and is likely NO2Y•.
Figure 5.
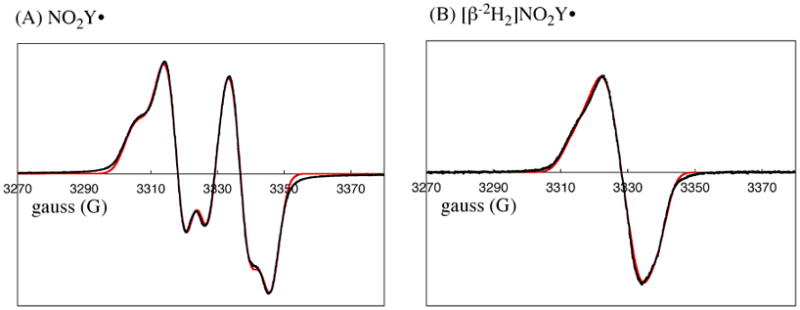
9 GHz EPR spectra of (A) NO2Y122• and (B) [β-2H2]NO2Y122•. Experimental data (black trace) and simulation (red trace) are shown. The parameters used for the simulation are summarized in Table 1.
In general, the large doublet splitting observed for Y• in proteins is associated with hyperfine coupling with one of its two β-methylene protons.45 Thus, to provide further support that the observed radical is located at NO2Y, [β-2H2]NO2Y was incorporated site-specifically into β2 (Y122[β-2H2]NO2Y-β2) and the cluster assembled. Its EPR spectrum (Figure 5B) revealed that the doublet collapsed to a broad singlet. Simulation of the spectra was carried out using EasySpin.34 The parameters for Y122• in wt-β2 were used as a starting point, excluding the hyperfine coupling associated with the proton on C3 of the ring. Least square fitting was performed by individually varying g-values, line width, hyperfine coupling constants, and Euler angles. The parameters resulting in the best fits (red overlay of experimental data in black, Figure 5) are shown in Table 1. These optimized parameters were used to simulate the data for [β-2H2]NO2Y• except that the 1H hyperfine coupling constants were divided by 6.5. These results support the proposal that the species detected is the NO2Y• and provide the standard for EPR spectral deconvolution used in the kinetic analysis described subsequently.
Table 1.
Parameters (in MHz) for EPR simulation of NO2Y•.a
| nucleus | Axx | Ayy | Azz | α | β | γ |
|---|---|---|---|---|---|---|
| C3,5-H | 31.3 | 8.2 | 20.2 | -35.1 | 11.6 | 4.7 |
| Cβ-Ha | 55 | 46.1 | 53.7 | 0 | 0 | 0 |
| Cβ-Hb | 10.1 | 12.7 | 5 | 0 | 0 | 0 |
Hyperfine tensor principal values (Aii) and Euler angles (α, β, γ) are indicated. The intrinsic EPR line width of 13.8 MHz and g-values of 2.00972, 2.00473, and 2.0022 were obtained from fitting.
Maximizing NO2Y• formation and determining its rate of decay using RFQ EPR
Our previous studies on cluster assembly in wt-β2 using RFQ EPR analysis detected an intermediate (X), an Fe4+/Fe3+ center, that is kinetically responsible for the oxidation of Y122 to Y122•.16,17 Preliminary studies of cluster assembly at both 5 and 25 °C with Y122NO2Y-β2 suggested that an X-like species is involved in NO2Y oxidation, however, the kinetics are complicated. The detailed analysis of this process will be reported in due course. The focus of the experiments described in this section was to maximize production of NO2Y• formation and to determine its stability. These are essential first steps in studying the chemistry of this highly reactive, “hot”, oxidant in the initiation of PCET and nucleotide reduction. In a typical experiment at 25 °C, Fe(II)2-Y122NO2Y-β2 was rapidly mixed with O2 and quenched in liquid isopentane from 0.5 to 50 s. The observed EPR signal was identical to that observed by the hand-quench experiments. No intermediate X was observed at ≥ 0.5 s. Each sample was analyzed by EPR spectroscopy and the results are summarized in Figure 6. The NO2Y• concentration is at its maximum at 1.2 ± 0.05 / β2 and unchanged between 0.5 - 1 s. NO2Y• then undergoes bi-exponential decay with rate constants of 0.59 s-1 (10% amplitude) and 0.017 s-1 (90%) with the predominant phase giving a t½ of 40 s. The amount of NO2Y• generated is very similar to Y• in wt-β2 and the rate of decomposition of NO2Y• is sufficiently slow that mechanistic studies can be carried out.
Figure 6.
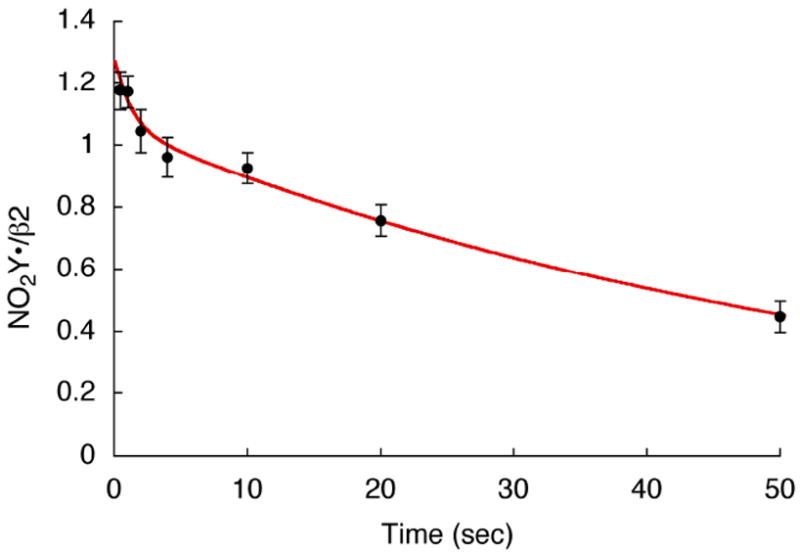
Generation and decay of NO2Y122•-β2 at 25°C. The red line is a bi-exponential fit to the NO2Y• reduction data with rate constants of 0.59 s-1 (10% amplitude) and 0.017 s-1 (90%).
NO2Y• formation and decay examined by SF spectroscopy
The vis spectrum of the NO2Y122• and NO2Y122 - have not been reported and are required for spectral deconvolution of the kinetic studies described subsequently. The NO2Y• formation reaction was thus studied by SF-UV-vis spectroscopy from 2 ms to 20 s with each time point analyzed from 320 – 550 nm in 10 nm intervals for spectral reconstruction. A broad absorption feature at 420 nm was generated within 0.087 s and remained unchanged until 0.94 s (Figure 7A). A very small change in the 450 nm region, associated with NO2Y122 -, was observed at 4.3 s concomitant with a decrease in the 420 nm feature (Figure 7B).
Figure 7.
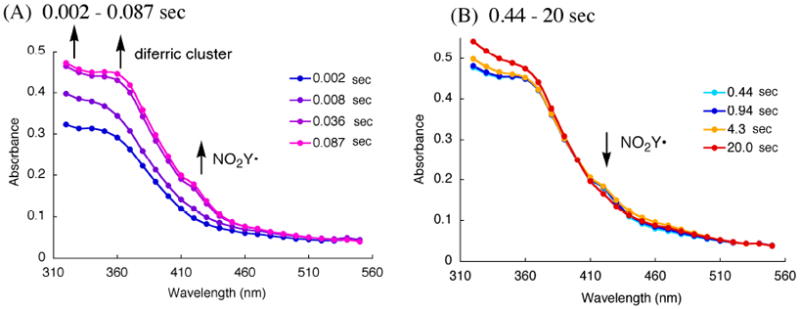
Point-by-point reconstruction of the vis spectra obtained by SF-vis spectroscopy of the reaction of Fe(II)2-Y122NO2Y-β2 with O2 to generate the NO2Y122•-β2. (A) 0.002 – 0.087 s, (B) 0.44 – 20 s at 25 °C. The lines connecting each point are generated by Excel software.
The vis spectrum of NO2Y• was reconstructed from the spectrum at 0.44 s (Figure 7B). The challenging part of reconstruction is the region between 325 and 400 nm where all the visible absorbing species contribute features. At 0.44 s, EPR studies revealed no intermediate X and consequently no absorption feature at 365 nm associated with X and minimal absorption at 450 nm (≤ 0.02/β2) associated with NO2Y122 -. Thus, the predominant species at this time point are NO2Y•, NO2Y phenol, and diferric cluster. Since the visible spectrum of the diferric cluster and the phenol are known (Figure 4), determination of the amount of each species at this time point allows their subtraction from the composite spectrum. Our previous analysis of the isolated met-Y122NO2Y-β2 after in vitro cluster assembly revealed two diferric clusters/β2. The amount of NO2Y phenol was estimated to be 0.8/β2, based on the amount of NO2Y• (1.2/β2) and total NO2Y (2.0)/β2. After subtraction, the results reveal features at 350 nm, 400 nm and 420 nm (Figure 4, green trace). The latter two features are similar to those reported for all tyrosyl radicals including Y122• in wt-β2. Y•s have absorption features around 410 nm with varying degrees of sharpness, with ε ranging from 3400 to 4000 M-1 cm-1.16,46,47 The corresponding feature of NO2Y• is broadened relative to that observed for Y122• and its extinction coefficient appears to be lower, ε = 2200 M-1 cm-1. The feature at 350 nm is unique to NO2Y•.
Catalytic activity of [NO2Y•]-β2
The generation of 1.2 NO2Y•/β2, and its moderately long t½ (40 s) has allowed further study of the catalytic activity of [NO2Y•]-β2. We have previously shown that NO2Y is 200 mV more difficult to oxidize than Y at pH 7.015 and blocks the PCET pathway when site-specifically incorporated in place of Y located at 356, 731 and 730 (Figure 1).10,15 Thus, the expectation was that incubation of [NO2Y•]-β2, a hot oxidant, with wt-α2, ATP, and CDP would readily initiate radical propagation and nucleotide reduction. However, in the reverse PCET process, the pathway radical intermediates, W48• or the Y356•, would be unable to reoxidize NO2Y to NO2Y•. Whether this reaction would generate one dCDP or additional dCDPs using W48• or Y356• as new radical initiators subsequent to the first turnover is of great interest considering our current model of radical propagation6 and our previous and more recent observations that [NH2Y]-RNRs are active.7,48
The activity of [NO2Y•]-β2 was first investigated in the absence of external reductant, that is single turnover conditions, using [5-3H]CDP. Fe(II)2-Y122NO2Y-β2 was incubated with O2-saturated buffer containing [5-3H]CDP for 7 s at 25 °C to generate 0.95 ± 0.05 NO2Y•/β2 and then mixed with wt-α2 and ATP. A burst of 0.64 ± 0.03 eq. dCDP was produced followed by a slow increase in dCDP with a rate constant of 0.004 s-1, which leveled off (Figure S2). The observation of 0.6 eq. dCDPs compares to the 1.4 to 1.7 dCDPs produced by wt-β2 under the same conditions6. Inclusion of the reducing system (TR/TRR/NADPH) required for multiple turnovers, did not change the size of the initial burst (Figure S2) and demonstrates that the enzyme can turnover only once with half-sites reactivity7,9,24,49.
The rate constant for dCDP formation was measured using the sequential mixing RCQ method (Figure 2A). Fe(II)2-Y122NO2Y-β2 in anaerobic buffer was initially mixed with O2-saturated buffer containing [5-3H]CDP and the solution was aged for 1 s at 25 °C to generate 1.2 ± 0.05 NO2Y•/β2. This solution was then mixed with wt-α2 and ATP in assay buffer and sprayed into 2% perchloric acid. The aging time after the second mixing was varied from 10 to 200 ms. The dCDP was dephosphorylated and analyzed by the method of Steeper and Steuart.39 The results are shown in Figure 8. The data fit to Eq.1 gave a rate constant for the fast phase of 107 ± 12 s-1 (82% amplitude) and for the slow phase of 5 ± 2 s-1 (18%). The total amount of dCDP formed in both phases was 0.59 ± 0.04/β2, similar to the results described above for the hand-mixing experiments. The rate constant for dCDP formation is 10 to 50 folds faster than ever observed for wt-β26, and demonstrates for the first time, uncoupling between radical propagation and conformational gating. The amount of dCDP produced is one half the amount of NO2Y•, as observed by hand mixing. A model (Figure 3) to explain this observation will be presented in Discussion.
Figure 8.
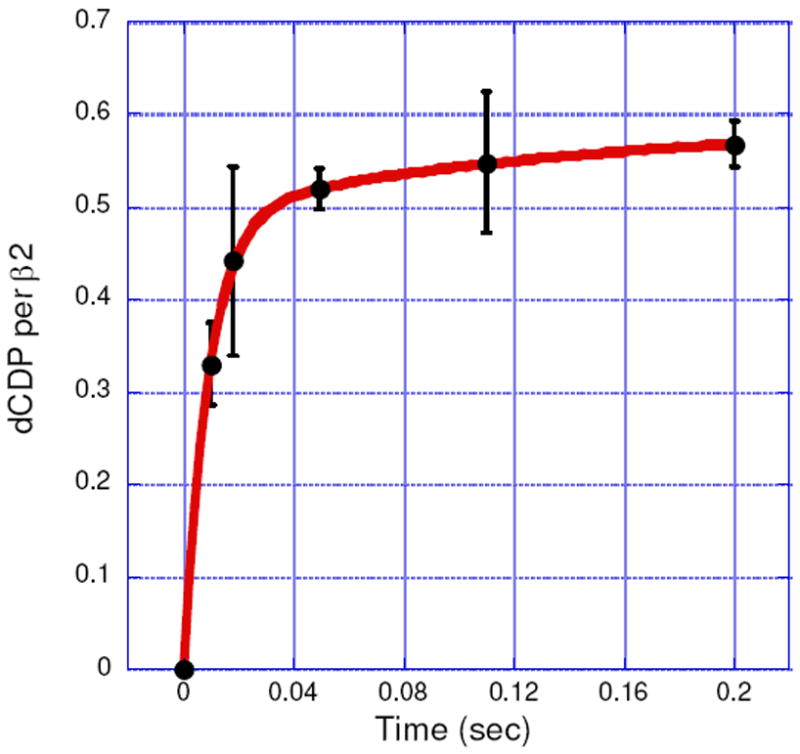
dCDP formation monitored by the RCQ method using sequential mixing (Figure 2A). The experiment was repeated in triplicate. The red line is a bi-exponential fit to the data. (See Table 2 for kinetic parameters.)
Vis spectrum of NO2Y122 - and kinetics of its formation in the reaction of Y122NO2Y-β2 with α2, ATP, CDP monitored by SF-UV-vis spectroscopy
Since dCDP is produced, NO2Y• in β2 must be reduced. The model for Y122• reduction in wt-β2 is that it occurs by a PCET mechanism with the proton being derived from the water on Fe1 and the electron from W48 or Y356 (Figure 1).4,5 Since the rate-limiting step for dCDP formation catalyzed by RNR is a conformational change prior to PCET, reduction of Y122• has never been observed.6 The rapid rate of dCDP formation suggested that we now might be able to monitor the reduction of the NO2Y•. Since NO2Y phenol and phenolate absorb at ~360 nm and 450 nm (Figure 4), respectively, the reduction of NO2Y• and its resulting protonation state can be investigated by SF-UV-vis spectroscopy. As with the RCQ experiments described above, sequential mixing was used to maximize NO2Y• concentration. NO2Y• was generated from Fe(II)2-Y122NO2Y-β2 and O2-saturated buffer containing CDP, which was further mixed with α2 and ATP (Figure 2B). Initially a point-by-point reconstruction of the absorption spectra acquired between 2 and 180 ms was carried out to address the issue of whether the reduction gives the phenol vs phenolate. The results shown in Figure 9A reveal an increase in A450nm where the NO2Y122 - absorbs. The vis spectrum of NO2Y122 - was obtained by subtracting the spectrum at 2 ms from that at 120 ms (Figure 9A) in the region (430 – 510 nm) where spectral overlap with other species is minimal. The ε was calculated assuming that the amount of NO2Y• reduced during this period (50% of the initial NO2Y•) corresponds to the amount of phenolate formation. The amount of NO2Y• reduced was determined by RFQ-EPR as described subsequently. The resulting spectrum (Figure 4, red trace) shows λmax at ~450 nm and ε of 6000 M-1 cm-1, similar to NO2Y phenolate observed at 730 in α10 (λmax = 442 - 445 nm and ε = 6000 - 7000 M-1 cm-1). These observations indicate reduction of NO2Y• to phenolate occurs without protonation.
Figure 9.
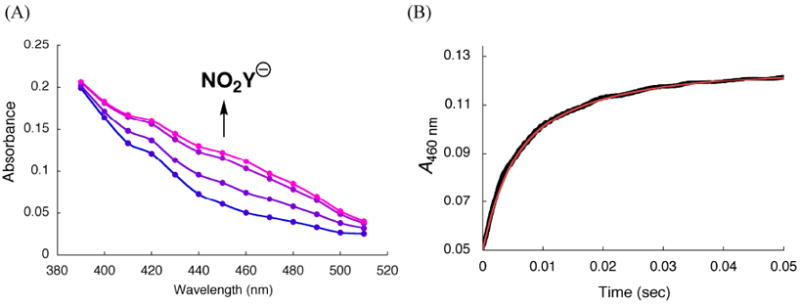
SF-vis spectroscopic analysis using sequential mixing (Figure 2B) of the reaction of Y122NO2Y-β2, α2, ATP and CDP. (A) Point-by-point reconstruction of the vis spectra between 390 - 510 nm at 2, 6, 30, and 180 ms (from blue to pink). The lines connecting the points are generated by Excel software. Each point is an average of 2-5 traces. (B) Changes in A460 nm (black line, an average of 15 traces). The red line is a tri-exponential fit (Eq. 3) to the data. See Table 2 for kinetic parameters.
A comparison of the vis spectra of all species in the reaction mixture (Figure 4) demonstrates that formation of the phenolate can be readily monitored, with minimal interference from other species, at 460 nm. Therefore, NO2Y122 - formation was monitored at this wavelength (Figure 9B). The kinetic data were best fit to Eq. 3 with the rate constants of 283 ± 25 s-1 (48% amplitude), 67 ± 3 s-1 (43%), and 10 ± 1 s-1 (9%), and the total change of A460 nm was 0.073 ± 0.003. A control in the absence of CDP revealed a very slow increase in A460 nm at 0.14 ± 0.02 s-1. Using ε of 6000 M-1 cm-1 for NO2Y122 -, 50% of NO2Y• has been reduced to phenolate. This number implies that 50% of the NO2Y• remains and is in agreement with the eq. of dCDP measured above.
Monitoring disappearance of the NO2Y• and formation of a new radical or radicals by RFQ EPR methods
The reduction of NO2Y• to phenolate, as well as detection of any new radicals generated as a consequence of the reduction can be monitored by the sequential mixing RFQ method with EPR detection. Similar to the experiments described above, 1.2 NO2Y•/β2 was generated in the presence of CDP in the first mixing event and then further reacted with α2 and ATP (Figure 2A). Time points were taken from 9 to 120 ms and the results are shown in Figures 10 and 11. Since 50% of NO2Y• remains unchanged during the reaction based on the dCDP and phenolate formation, its EPR spectrum is subtracted from each reaction spectrum facilitating spectral deconvolution, NO2Y• disappearance and new radical formation. The spectra at t = 0, 9, and 22 ms are shown in Figure 10 and reveal multiple species. Spin quantitation revealed no loss in radical over this time (Figure 11). Spectral overlap of NO2Y• and the new radical or radicals makes analysis challenging (see Figure S3A). Initially, we focused on the differences in the low field side of the spectrum based on an apparent peak width difference between NO2Y• and the new species. This method gave us an approximation of the amount of new radical (±10%). We eventually settled, however, on analyzing the reaction spectra generated with Y122NO2Y-β2 and Y122[β-2H2]NO2Y-β2. Our assumption was that the same species, in the same amount would be generated by both proteins. Subtractions of the NO2Y• spectrum and [β-2H2]NO2Y• spectrum were carried out, adjusting their amplitudes to minimize differences in the spectrum of the new species. One of the results using this approach is shown in Figure S3. Subtraction of NO2Y• (50% of the total radical, Figure S3A) and a similar experiment with [β-2H2]NO2Y• (50% of the total radical, Figure S3B) from the spectrum of the 120 ms time point of each reaction resulted in very similar spectra of the new radical species (Figure S3C, and D). Application of this method to the other time points (9 – 55 ms) revealed the EPR spectra of the new radical species are very similar (Figure S4). The amount of the new radical species formed is equivalent to the amount of NO2Y• lost (Figure 11). The new radical is also very similar to that observed by hand-quenching after incubation at 25 °C for 20 s (red trace overlaid with 22 ms spectrum in Figure 10). This new species has a t½ of > 1 min (Figure S5). A power saturation experiment on the new radical revealed P½ of 0.54 ± 0.08 mW (Figure S1), similar to NH2Y730• (0.4 mW)7 and DOPA356• (0.8 mW)9, and distinct from NO2Y122• (11.4 mW) suggesting that the radical is remote from the diferric cluster.
Figure 10.
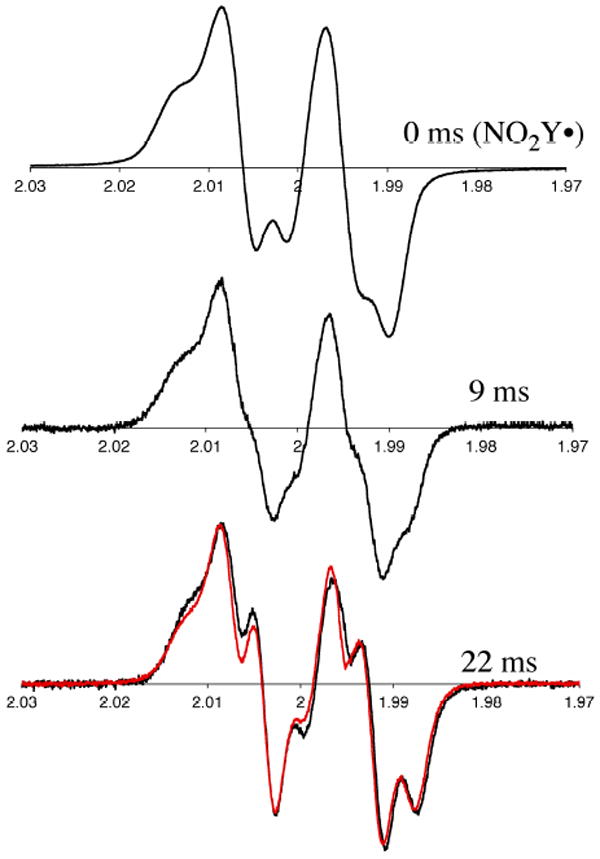
Time course of the reaction of Y122NO2Y-β2, α2, ATP and CDP monitored by RFQ-EPR spectroscopy (Figure 2A). Half of the concentration of the initial NO2Y• was subtracted from each spectrum as 50% of the NO2Y• remains at the end of the overall reaction. Shown are the time points at 0, 9 and 22 ms. The red trace (bottom trace, overlaid with the 22 ms time point) is the EPR spectrum of new radical observed by hand freeze-quench experiments (Figure S6A).
Figure 11.
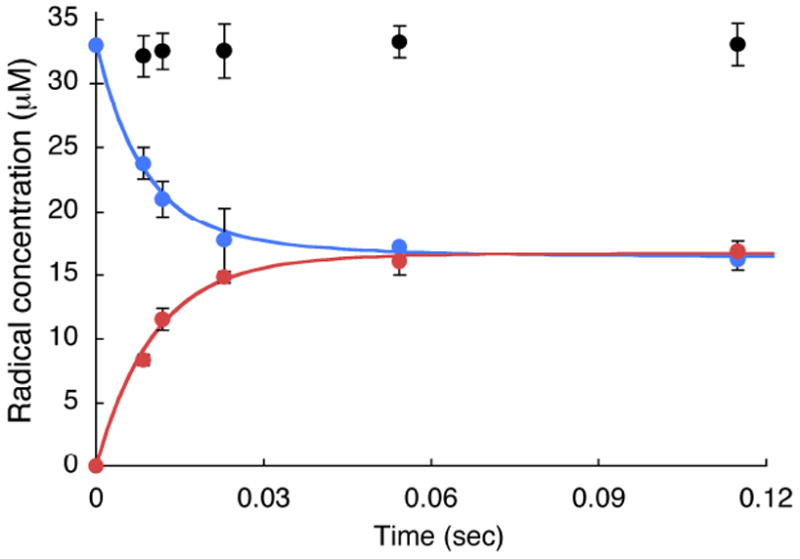
Time course of the experiment in Figure 10 monitored by RFQ-EPR with total radical (black circles), NO2Y• (blue circles) and new Y• (red circles). Each point represents an average of three experiments. Solid lines are biexponential fits for formation of the new Y• and loss of the NO2Y•. See Table 2 for the kinetic parameters.
Given the single turnover for dCDP formation and the observed kinetics, the new radical(s) (or radicals) is (are) likely to be generated in the reverse PCET process. It may be localized on W48- or Y356-β2 or perhaps even equilibrated with the pathway tyrosines in α. A radical associated with a pathway residue has never been observed for wt-RNR under any conditions.6,13 The location of the radical was further investigated using α2 and β2 mutants with a pathway block: C439S, Y730F, or Y731F in α2, or Y356F in β2. It should be noted that in these cases, in contrast with our hypothesis for the Y122NO2Y-β2 reaction with wt-α2, any radical(s) observed would be associated with forward PCET pathway as the blocked residue precludes PCET to the active site. In fact, the conformations of the Y•s could differ in the forward and reverse PCET process, especially near the subunit interface.
Each α2 mutant was mixed with Y122NO2Y-β2 (0.80 ± 0.05 NO2Y•/β2), ATP and CDP, and incubated at 25 °C for 20 s and the sample frozen in liquid N2. The reaction with the wt-α2 under identical conditions, gave 0.60 ± 0.07 radicals/β2 with 47% new radical (Table 3, Figure 10 and S6A). In these hand-mixing experiments, ~25% of the total radical is lost. The total amount of radical in mutant-α2s is ~15% less than that observed with wt-α2 (Table 3) with a 1:1 ratio of the NO2Y• to the new radical with Y731F and a 3:2 ratio of NO2Y• to the new radical with Y730F and C439S. The new radical(s) observed with C439S and Y730F-α2 mutants in the forward PCET is (are) almost indistinguishable from that observed with wt-α2, in the reverse PCET, while that observed with Y731F-α2 is distinct (Figure S6 B, C and D). On the other hand, when the reaction between wt-α2 and Y122NO2Y/Y356F-β2 was examined, only NO2Y• was observed, 0.80 ± 0.05 eq./β2, revealing stabilization relative to the wt- and mutant-α2s (Table 3). These observations suggest that the new radical resides primarily on Y356. Further analysis is required to establish whether the observed signal contains contributions from other radicals. The minimal loss of radical in Y122NO2Y/Y356F-β2, suggests that the 25-40% radical loss during the 20 s incubation likely occurs through a specific pathway involving Y356-β2.
Table 3.
Composition of the radicals observed in the reactions of Y122NO2Y-β2 or Y122NO2Y/Y356F-β2 and wt- or mutant-α2 with ATP and CDP.
| Y122NO2Y-β2 | Y122NO2Y-β2/wt-α2 | Y122NO2Y/Y356F-β2/wt-α2 | Y122NO2Y-β2/Y731F-α2 | Y122NO2Y-β2/Y730F-α2 | Y122NO2Y-β2/C439S-α2 | |
|---|---|---|---|---|---|---|
| total radical (/β2) | 0.80 ± 0.05 a | 0.60 ±0.07 | 0.80 ± 0.05 | 0.53 ± 0.08 | 0.48 ± 0.06 | 0.52 ± 0.08 |
| NO2Y• (%) | 100 | 53 ± 3 | >99 | 51 ± 4 | 60 ± 5 | 60 ± 5 |
| new radical (%) | - | 47 ± 3 | <1 | 49 ± 4 | 40 ± 5 | 40 ± 5 |
Initial NO2Y• before incubation with α2/ATP/CDP.
Structure of met-Y122NO2Y-β2
Met-Y122NO2Y-β2 was crystallized under conditions similar to those previously described for Y122F-β240. One β2 dimer was found in the asymmetric unit. The overall structure shows minimal perturbations relative to the 1.4 Å structure of wt-β250 with an rmsd of 0.3 Å for Cα in residues 10-335 of the dimer (Figure 12). The phenyl ring of NO2Y overlays that of Y122 in wt-β2. The NO2 group is parallel to the phenyl ring, on the side away from D84 embedded within a hydrophobic pocket composed of L77, Q80, I125, N227, I231, and I234-β2 (Figure 12A). One of the noticeable changes relative to the wt structure is that I231 within this pocket has moved 0.6 – 0.8 Å from NO2Y122 relative to Y122 in wt-β2. On the other hand, the residues in the first and second coordination sphere of the diferric cluster overlay with an rmsd of 0.3 Å with the wt-β2 structure50 (Figure 12B). In both structures, D84, which may facilitate oxidation of Y122, is oriented similarly with monodentate coordination to Fe1. The mutant structure demonstrates that there are no major perturbations relative to the wt-β2 crystallized under similar conditions. However, the key to PCET is tenths of angstroms, as discussed subsequently, and the positioning of the NO2 group may preclude the movement of this residue required for the coupling of electron and proton transfers.
Figure 12.
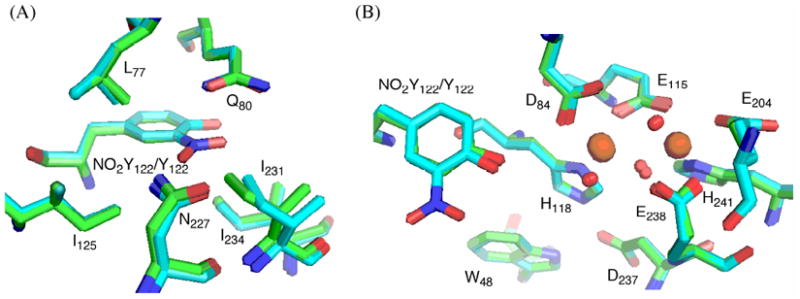
Overlaid crystal structures of Y122NO2Y-β2 (cyan) and wt-β250 (green, PDB-ID 1MXR) showing (A) the environment of the NO2 group, and (B) the NO2Y-diferric cofactor. Oxygens are shown in red, nitrogens in blue, and irons in orange.
Discussion
NO2Y at position 122 in β2 has proven to be an informative probe of the radical initiation process in E. coli RNR. The key observation is that intermediate X, an Fe4+/Fe3+ cluster involved in Y122 oxidation in β, is able to oxidize NO2Y122 to NO2Y122• and that the latter is sufficiently long-lived to allow its chemistry to be examined. The kinetic details of the formation of X, its characterization by EPR and Mössbauer spectroscopies and its ability to oxidize NO2Y122 will be the subject of a future report. For the present work, the conditions to maximize NO2Y• formation and its lifetime were established. The formation of the NO2Y• was detected by both EPR spectroscopy (Figure 5) and UV-vis spectroscopy (Figure 7). The EPR spectrum showed a doublet feature arising from hyperfine interactions with one of the two β protons of tyrosine. The magnitude of this interaction is very similar to that observed for Y122•. Incorporation of β-2H labeled NO2Y into β2 changed the doublet hyperfine to a singlet, establishing the identity of the radical. While the visible spectrum looks like a typical Y• (Figure 4), the ε at 420 nm is substantially reduced relative to other Y•s16,46,47 and it has an absorption feature at 350 nm, absent in Y•s. Efforts to further characterize this radical with model systems, computations, and by high field EPR spectroscopy are in progress.
A number of surprises were encountered while examining the chemistry initiated by this radical. The first surprise was that NO2Y• reduction in the presence of α2, CDP and ATP resulted in production of the phenolate and not the phenol. This result was unexpected for a number of reasons. First, the pKa of NO2Y could not be measured in holo-β2 or in the α2β2 complex and must be > 9.6.10 Second, the reduction of Y122• in the wt-β2, presumably involves transfer of both an electron and a proton, although its reduction and re-oxidation have never been detected with wt-RNR due to the conformational gating.6 Third, the structure of this mutant is similar to that of wt-β2 (Figure 12) in the first and the second coordination sphere around the diferric cluster. Finally, there is no residue in the vicinity of NO2Y other than the putative hydroxide bound to Fe1 to pick up the proton during its oxidation.
A number of possible models are under consideration to explain the mutant’s inability to transfer a proton to NO2Y122 - to regenerate the NO2Y phenol. This observation is unusual given the pKa of this residue in the met-form is so perturbed that we have been unable to detect phenolate formation by pH titration of the phenol.10
One possible model is that during NO2Y oxidation, the proton from the phenol is transferred to a position in the cluster other than the putative HO-ligand on Fe1 of the intermediate X. Analysis of the structure suggests that there are no amino acid side chains positioned to accept a proton or water networks with access to the solvent. The kinetics of NO2Y122• generation by intermediate X are complex relative to Y122• formation, and thus it is possible that the mechanism of NO2Y• formation is different from that for Y•. Detection of differences from the wt oxidation mechanism will require extensive RFQ spectroscopic analyses.
A second possible model is that the NO2 group perturbs the environment of NO2Y122 and/or the cluster sufficiently such that the subtle conformational change(s), required for proton transfer in the forward radical propagation step, are distinct from the reverse process. Changes on the order of tenths of angstroms are likely to be sufficient to alter proton tunneling in the PCET step.5,12 Recent evidence detecting a subtle perturbation of the active cofactor (diferric-Y•) relative to the cofactor with the Y• reduced is provided by comparison of the distance and orientation between Y122 and Fe1 in a high resolution structure of β2 (1.4 Å) with the results from high field EPR measurements made on the Y122• generated in the same crystal. Comparison of the orientation of the oxidized and reduced Y122 50 revealed a significant rotation of the Y side chain, away from the iron cluster (~1Å). Recent FT-IR studies have also identified subtle conformational changes at peptide bonds adjacent to Y122•.51 The structure of Y122NO2Y-β2 indicates that I231 in the vicinity of NO2Y moves substantially relative to Y in the wt-β2. It is unclear, however, how this change could translate into proton uncoupling. Although the mechanism of the mutant’s inability to protonate NO2Y is still unclear, this PCET uncoupling and the higher reduction potential of NO2Y over Y (200 mV at pH 7.0) allows ET without the slow conformational gating (2 – 10 s-1) observed with the wt enzyme. Thus the chemistry of radical propagation can be investigated.
Kinetic analysis of NO2Y122• reduction reveals that phenolate formation occurs with rate constants of 283 and 67 s-1 (Table 2). The rate constants are 28 to 6 times faster than the turnover number of the wt RNR and the reaction occurs in two phases of almost equal amplitude. Similar “half-sites” changes have now been observed with mechanism-based inhibitor studies24,49 and with studies of radical formation with NH2Y7,48 and DOPA9 analogs site-specifically incorporated into both subunits of RNR. These observations are indicative of the incompletely understood complexities in RNR’s conformation and quaternary structure, which we are actively investigating.
Table 2.
Kinetic data for formation of dCDP, NO2Y122 - and the new radical.
| Phenolate formation a | dCDP formation b | New Y• formation c | NO2Y• decay c | ||
|---|---|---|---|---|---|
| 1st phase | kobs (s-1) | 283 ± 25 | 107 ± 12 | 97 ± 8 | 122 ± 11 |
| Amplitude (%) | 48 ± 3 | 82 ± 4 | 96 ± 3 | 84 ± 4 | |
| 2nd phase | kobs (s-1) | 67 ± 3 | 5.3 ± 2 | 28 ± 7 | 36 ± 5 |
| Amplitude (%) | 43 ± 2 | 18 ± 4 | 4 ± 3 | 16 ± 4 | |
| 3rd phase | kobs (s-1) | 10 ± 1 | - | - | - |
| Amplitude (%) | 9 ± 1 | - | - | - | |
| Total change (/β2) | 0.61 ± 0.03 d | 0.59 ± 0.02 | 0.56 ± 0.04 | 0.56 ± 0.04 | |
The rate constants were determined by SF-UV-vis by monitoring changes at 460 nm,
RCQ, or
RFQ-EPR.
ε460nm of 6000 M-1 cm-1 was used.
Since NO2Y122• is reduced, an amino acid in the pathway must be oxidized, which in turn initiates dNDP formation. Thus dCDP formation was investigated by RCQ methods and the formation of new radical(s) was(were) investigated by RFQ-EPR methods. Oxidation of C439 to C439• is expected to be a slow step in forward radical propagation given the redox mismatches and thus one might expect to see an amino acid radical (Z•) transiently formed before nucleotide reduction (Figure 3). The RCQ data (Figure 8) were fit predominantly to a single exponential with a kobs of 107 s-1 (Table 2). However, the method of quenching (Figure 2A) limits data acquisition between 2 and 15 ms, and thus faster rate constants are not measureable. As indicated in Figure S7A (red line), a similar fit to the experimental data for dCDP production, is in fact obtained, if the rate constants and amplitudes obtained from analysis of the SF experiments for phenolate formation are used. Thus, mixing on a faster time scale is essential to tell if an intermediate radical in the forward pathway (Z•, Figure 3) could build up and actually be detected. It is interesting to note that the rate constant of ~100 s-1 for dCDP formation is very similar to the rate constant of 55 s-1 measured for the adenosylcobalamin, class II-RNR for dNTP formation.52 Thus this number may be close to the intrinsic rate constant for the chemical reduction process.
As can be seen in Figure 10, analysis by RFQ EPR methods reveals formation of a new radical(s) within the 9 ms quench time and NO2Y• appears to have been predominantly reduced by 22 ms. Recall that in all of our experiments, 50% of the NO2Y• remains unchanged during the time course. Thus in all the spectra shown in Figure 10, this amount of NO2Y• has been subtracted to facilitate detection of spectral changes. The similarity in the width of the EPR spectra of NO2Y• and the new radical(s), as noted in detail in the results, makes it challenging to carry out subtractions required for kinetic analysis. However, the kinetics with a limited number of data points reveal that NO2Y• disappears with a kobs of 122 s-1 and that the new radical(s) appears at 97 s-1. This method, as with RCQ method, suffers from our inability to obtain data at fast enough mixing times to measure rate constants of 300 s-1. Fitting of each set of data (Fig S7B) with the rate constants and amplitudes observed for phenolate formation, does not preclude an initial rapid phase. Recent studies suggest that mixing on the 100 μs time scale will facilitate deconvolution of forward radical propagation.53
In each of the experiments described above, the amount of NO2Y122 -, dCDP and new radical detected, is ~ ½ the amount of NO2Y• at the beginning (1.2 radicals/β2) of the reaction. As noted above, this ~50% is observed repeatedly with a number of very different types of experiments. A variety of biophysical experiments are in progress to try to understand the basis for these observations. An added complication is that in β2 with 1.2 Y•, no one understands how the radicals are distributed between the two β monomers.
The observation that a new radical(s) builds up rapidly with a rate constant similar to that for dCDP formation suggests that it might reside on a residue in the PCET pathway including the tryptophan radical or radical cation [W48• or W48•+] or Y356•. The radical could in fact also be a composite of radicals distributed between α and β. Sequential mixing SF to look for a W48• (or W48•+), failed to reveal any new absorption features between 510 to 560 nm,54 a spectroscopically clean window (Figure 4). While our previous studies55 and those of the Bollinger/Krebs groups56,57 have established that a W48 •+ is involved in the diferric-Y• cluster assembly, there is currently no support for or against its role in the radical propagation pathway in the class Ia RNR. Our inability to detect this radical in the double mutants suggests that its redox potential is not dramatically perturbed relative to that measured for blocked tryptophans in solution.58 Thus, our favored model based on the kinetic analyses and the preliminary studies with pathway mutants (Y356F, Y731F, Y730F and C439S), is that the new radical is predominantly localized on Y356.
For the first time with the E. coli class Ia RNR, conformational gating has been uncoupled from the chemistry. The question remains, however, as to whether it has been completely uncoupled. If we could incorporate F3Y59 in place of the pathway Ys for example, we could now, by modulating the pH, determine if the rate constants we are measuring are in part or totally associated with the ET steps. In addition, experiments conducted in D2O or at varying temperatures might allow us to determine if the rate constants we are measuring are associated with PCET. Both NO2Y- and NH2Y-substituted RNRs, despite the perturbation of the 3-substitutent, are starting to unveil the chemical mechanism of a very unusual and important reaction in biology. Studies in the immediate future should allow us to tell if unnatural amino acids are the perturbants we need to unravel in detail the mechanisms of PCET in RNRs.
Supplementary Material
Acknowledgments
This work was supported by the NIH grant GM29595 to J. S.
Footnotes
SUPPORTING INFORMATION. Microwave power saturation behavior of NO2Y• and new radical EPR signals; dCDP formation by Y122NO2Y-β2 under steady state or single turnover conditions; EPR spectra of Y122NO2Y-β2 and Y122[β-2H2]NO2Y-β2 incubated with wt-α2, ATP, and CDP; EPR spectra of the new radical species at time points between 9 – 55 ms; stability of new radical species; EPR spectra of the new radical species in pathway mutants; tri-exponential fitting of RCQ and RFQ-EPR data. This material is available free of charge via the Internet at http://pubs.acs.org.
References
- 1.Stubbe J, van der Donk WA. Chem Rev. 1998;98:705–762. doi: 10.1021/cr9400875. [DOI] [PubMed] [Google Scholar]
- 2.Jordan A, Reichard P. Annu Rev Biochem. 1998;67:71–98. doi: 10.1146/annurev.biochem.67.1.71. [DOI] [PubMed] [Google Scholar]
- 3.Nordlund P, Reichard P. Annu Rev Biochem. 2006;75:681–706. doi: 10.1146/annurev.biochem.75.103004.142443. [DOI] [PubMed] [Google Scholar]
- 4.Uhlin U, Eklund H. Nature. 1994;370:533–539. doi: 10.1038/370533a0. [DOI] [PubMed] [Google Scholar]
- 5.Stubbe J, Nocera D, Yee CS, Chang MCY. Chem Rev. 2003;103:2167–2201. doi: 10.1021/cr020421u. [DOI] [PubMed] [Google Scholar]
- 6.Ge J, Yu G, Ator MA, Stubbe J. Biochemistry. 2003;42:10071–10083. doi: 10.1021/bi034374r. [DOI] [PubMed] [Google Scholar]
- 7.Seyedsayamdost MR, Xie J, Chan CT, Schultz PG, Stubbe J. J Am Chem Soc. 2007;129:15060–15071. doi: 10.1021/ja076043y. [DOI] [PubMed] [Google Scholar]
- 8.Seyedsayamdost MR, Yee CS, Reece SY, Nocera DG, Stubbe J. J Am Chem Soc. 2006;128:1562–1568. doi: 10.1021/ja055927j. [DOI] [PubMed] [Google Scholar]
- 9.Seyedsayamdost MR, Stubbe J. J Am Chem Soc. 2006;128:2522–2523. doi: 10.1021/ja057776q. [DOI] [PubMed] [Google Scholar]
- 10.Yokoyama K, Uhlin U, Stubbe J. J Am Chem Soc. 2010;132:8385–8397. doi: 10.1021/ja101097p. [DOI] [PMC free article] [PubMed] [Google Scholar]
- 11.Gray HB, Winkler JR. Q Rev Biophys. 2003;36:341–372. doi: 10.1017/s0033583503003913. [DOI] [PubMed] [Google Scholar]
- 12.Reece SY, Hodgkiss JM, Stubbe J, Nocera DG. Phil Trans R Soc B. 2006;361:1351–1364. doi: 10.1098/rstb.2006.1874. [DOI] [PMC free article] [PubMed] [Google Scholar]
- 13.Ekberg M, Sahlin M, Eriksson M, Sjöberg B-M. J Biol Chem. 1996;271:20655–20659. doi: 10.1074/jbc.271.34.20655. [DOI] [PubMed] [Google Scholar]
- 14.Climent I, Sjöberg B-M, Huang CY. Biochemistry. 1992;31:4801–4807. doi: 10.1021/bi00135a009. [DOI] [PubMed] [Google Scholar]
- 15.Yee CS, Seyedsayamdost MR, Chang MC, Nocera DG, Stubbe J. Biochemistry. 2003;42:14541–14552. doi: 10.1021/bi0352365. [DOI] [PubMed] [Google Scholar]
- 16.Bollinger JM, Jr, Edmondson DE, Huynh BH, Filley J, Norton JR, Stubbe J. Science. 1991;253:292–298. doi: 10.1126/science.1650033. [DOI] [PubMed] [Google Scholar]
- 17.Sturgeon BE, Burdi D, Chen S, Huynh BH, Edmondson D, Stubbe J, Hoffman B. J Am Chem Soc. 1996;118:7551–7557. [Google Scholar]
- 18.Shanmugam M, Doan PE, Lees NS, Stubbe J, Hoffman BM. J Am Chem Soc. 2009;131:3370–3376. doi: 10.1021/ja809223s. [DOI] [PMC free article] [PubMed] [Google Scholar]
- 19.Tong WH, Chen S, Lloyd SG, Edmondson DE, Huynh BH, Stubbe J. J Am Chem Soc. 1997;118:2107–2108. [Google Scholar]
- 20.Ormo M, Regnstrom K, Wang Z, Que L, Jr, Sahlin M, Sjoberg BM. J Biol Chem. 1995;270:6570–6576. doi: 10.1074/jbc.270.12.6570. [DOI] [PubMed] [Google Scholar]
- 21.Chivers PT, Prehoda KE, Volkman BF, Kim BM, Markley JL, Raines RT. Biochemistry. 1997;36:14985–14991. doi: 10.1021/bi970071j. [DOI] [PubMed] [Google Scholar]
- 22.Pigiet VP, Conley RR. J Biol Chem. 1977;252:6367–6372. [PubMed] [Google Scholar]
- 23.Salowe SP, Stubbe J. J Bacteriol. 1986;165:363–366. doi: 10.1128/jb.165.2.363-366.1986. [DOI] [PMC free article] [PubMed] [Google Scholar]
- 24.Salowe SP, Ator MA, Stubbe J. Biochemistry. 1987;26:3408–3416. doi: 10.1021/bi00386a024. [DOI] [PubMed] [Google Scholar]
- 25.Thelander L. J Biol Chem. 1973;248:4591–4601. [PubMed] [Google Scholar]
- 26.Atkin CL, Thelander L, Reichard P, Lang G. J Biol Chem. 1973;248:7464–7472. [PubMed] [Google Scholar]
- 27.Hammill JT, Miyake-Stoner S, Hazen JL, Jackson JC, Mehl RA. Nat Protoc. 2007;2:2601–2607. doi: 10.1038/nprot.2007.379. [DOI] [PubMed] [Google Scholar]
- 28.Farrell IS, Toroney R, Hazen JL, Mehl RA, Chin JW. Nat Methods. 2005;2:377–384. doi: 10.1038/nmeth0505-377. [DOI] [PubMed] [Google Scholar]
- 29.Palmer G. Methods Enzymol. 1967;10:595. [Google Scholar]
- 30.Hristova D, Wu CH, Jiang W, Krebs C, Stubbe J. Biochemistry. 2008;47:3989–3999. doi: 10.1021/bi702408k. [DOI] [PMC free article] [PubMed] [Google Scholar]
- 31.Young TS, Ahmad I, Yin JA, Schultz PG. J Mol Biol. 2010;395:361–374. doi: 10.1016/j.jmb.2009.10.030. [DOI] [PubMed] [Google Scholar]
- 32.Fish WW. Methods Enzymol. 1988;158:357–364. doi: 10.1016/0076-6879(88)58067-9. [DOI] [PubMed] [Google Scholar]
- 33.Seyedsayamdost MR, Argirević T, Minnihan EC, Stubbe J, Bennati M. J Am Chem Soc. 2009;131:15729–15738. doi: 10.1021/ja903879w. [DOI] [PMC free article] [PubMed] [Google Scholar]
- 34.Stoll S, Schweiger A. J Magn Reson. 2006;178:42–55. doi: 10.1016/j.jmr.2005.08.013. [DOI] [PubMed] [Google Scholar]
- 35.Chen-Barrett Y, Harrison PM, Treffry A, Quail MA, Arosio P, Santambrogio P, Chasteen ND. Biochemistry. 1995;34:7847–7853. doi: 10.1021/bi00024a008. [DOI] [PubMed] [Google Scholar]
- 36.Sahlin M, Petersson L, Graslund A, Ehrenberg A, Sjoberg BM, Thelander L. Biochemistry. 1987;26:5541–5548. doi: 10.1021/bi00391a049. [DOI] [PubMed] [Google Scholar]
- 37.Ballou DP. Methods Enzymol. 1978;54:85–93. doi: 10.1016/s0076-6879(78)54010-x. [DOI] [PubMed] [Google Scholar]
- 38.Bollinger JM, Jr, Tong WH, Ravi N, Huynh BH, Edmondson DE, Stubbe JA. Methods Enzymol. 1995;258:278–303. doi: 10.1016/0076-6879(95)58052-2. [DOI] [PubMed] [Google Scholar]
- 39.Steeper JR, Steuart CD. Anal Biochem. 1970;34:123–130. doi: 10.1016/0003-2697(70)90092-8. [DOI] [PubMed] [Google Scholar]
- 40.Tong W, Burdi D, Riggs-Gelasco P, Chen S, Edmondson D, Huynh BH, Stubbe J, Han S, Arvai A, Tainer J. Biochemistry. 1998;37:5840–5848. doi: 10.1021/bi9728811. [DOI] [PubMed] [Google Scholar]
- 41.Leslie AGW. Joint CCP4 and ESF-EACBM Newsletter. 1992:26. [Google Scholar]
- 42.Collaborative Computational Project, Number 4. Acta Crystallogr D Biol Crystallogr. 1994;50:760–763. [Google Scholar]
- 43.Jones TA, Zou JY, Cowan SW, Kjeldgaard M. Acta Crystallogr A. 1991;47(Pt 2):110–119. doi: 10.1107/s0108767390010224. [DOI] [PubMed] [Google Scholar]
- 44.Seyedsayamdost MR. Massachusetts Institute of Technology. 2007 [Google Scholar]
- 45.Svistunenko DA, Cooper CE. Biophysical Journal. 2004;87:582–595. doi: 10.1529/biophysj.104.041046. [DOI] [PMC free article] [PubMed] [Google Scholar]
- 46.Huque Y, Fieschi F, Torrents E, Gibert I, Eliasson R, Reichard P, Sahlin M, Sjoberg BM. J Biol Chem. 2000;275:25365–25371. doi: 10.1074/jbc.M002751200. [DOI] [PubMed] [Google Scholar]
- 47.Thelander M, Graslund A, Thelander L. J Biol Chem. 1985;260:2737–2741. [PubMed] [Google Scholar]
- 48.Minnihan EC, Seyedsayamdost MR, Stubbe J. manuscript in preparation. 2010 [Google Scholar]
- 49.Wang J, Lohman GJ, Stubbe J. Proc Natl Acad Sci U S A. 2007;104:14324–14329. doi: 10.1073/pnas.0706803104. [DOI] [PMC free article] [PubMed] [Google Scholar]
- 50.Högbom M, Galander M, Andersson M, Kolberg M, Hofbauer W, Lassmann G, Nordlund P, Lendzian P. Proc Natl Acad Sci U S A. 2003;100:3209–3214. doi: 10.1073/pnas.0536684100. [DOI] [PMC free article] [PubMed] [Google Scholar]
- 51.Offenbacher AR, Vassiliev IR, Seyedsayamdost MR, Stubbe J, Barry BA. J Am Chem Soc. 2009;131:7496–7497. doi: 10.1021/ja901908j. [DOI] [PMC free article] [PubMed] [Google Scholar]
- 52.Licht SS, Lawrence CC, Stubbe J. J Am Chem Soc. 1999;121:7463–7468. [Google Scholar]
- 53.Yu MA, Egawa T, Yeh SR, Rousseau DL, Gerfen GJ. J Magn Reson. 2010;203:213–219. doi: 10.1016/j.jmr.2009.12.017. [DOI] [PMC free article] [PubMed] [Google Scholar]
- 54.Solar S, Getoff N, Surdhar PS, Armstrong DA, Sing A. J Phys Chem. 1991;95:3639–3643. [Google Scholar]
- 55.Bollinger JM, Tong WH, Ravi N, Huynh BH, Edmonson DE, Stubbe J. J Am Chem Soc. 1994;116:8024–8032. [Google Scholar]
- 56.Baldwin J, Krebs C, Ley BA, Edmondson DE, Huynh BH, Bollinger JM. J Am Chem Soc. 2000;122:12195–12206. [Google Scholar]
- 57.Krebs C, Chen S, Baldwin J, Ley BA, Patel U, Edmondson DE, Huynh BH, Bollinger JM. J Am Chem Soc. 2000;122:12207–12219. [Google Scholar]
- 58.Tommos C, Skalicky JJ, Pilloud DL, Wand AJ, Dutton PL. Biochemistry. 1999;38:9495–9507. doi: 10.1021/bi990609g. [DOI] [PubMed] [Google Scholar]
- 59.Seyedsayamdost MR, Reece SY, Nocera DG, Stubbe J. J Am Chem Soc. 2006;128:1569–1579. doi: 10.1021/ja055926r. [DOI] [PubMed] [Google Scholar]
Associated Data
This section collects any data citations, data availability statements, or supplementary materials included in this article.


